
Optic nerve head perfusion in normal eyes and eyes with glaucoma using optical coherence tomography-based microangiography
Introduction
Vascular dysfunction in the optic nerve head (ONH) is thought to be a contributing factor in the development of glaucoma (1,2). Previous studies have shown that glaucomatous eyes have a significant reduction in ocular perfusion compared to normal subjects (3,4). Furthermore, glaucomatous eyes with disease progression have a more pronounced blood flow reduction than eyes without disease progression (3-6). Vascular dysfunction has been observed even before the development of glaucomatous optic neuropathy (2). This evidence supports the association of vascular dysfunction and glaucoma, but its study in the clinical setting has been limited due to a lack of objective measures to quantify ONH perfusion.
Current methods of fluorescein angiography (FA) and Doppler optical coherence tomography (DOCT) are limited in their ability to study the ocular vasculature non-invasively and accurately (1,2,7). FA requires intravenous dye injection, while DOCT is vulnerable to noise and less sensitive to microcirculation (1,2,7). We developed a novel optical microangiography (OMAG) imaging technique based on Fourier-domain optical coherence tomography (FD-OCT), which is capable of non-invasive three-dimensional (3D) in vivo microcirculatory visualization in the eye with microscopic resolution (8). It has been used successfully to identify retinal capillaries and areas of neovascularization in macular telangiectasia type 2 (9). The purpose of this study was to use OMAG to visualize, quantify, and compare ONH perfusion in healthy and glaucomatous eyes.
Materials and methods
Subjects
This study was approved by the Institutional Review Board of the University of Washington (UW) and informed consent was obtained from all subjects. This study followed the tenets of the Declaration of Helsinki and was conducted in compliance with the Health Insurance Portability and Accountability Act.
Subjects with primary open-angle glaucoma (POAG) or normal optic discs were prospectively enrolled at the UW Eye Institute. Inclusion criteria were best-corrected visual acuity of 20/40 or better, refractive error between −6 and +3 D spherical equivalent, for the glaucoma group, a visual field (VF) mean deviation (MD) ≥−10 dB, and for the normal group, a normal retinal nerve fiber layer (RNFL) thickness on FD-OCT. Exclusion criteria were significant media opacity preventing high-quality imaging, previous diagnosis of migraine, any ocular disease other than glaucoma or cataract, and previous intraocular surgeries other than uneventful cataract extraction or glaucoma surgery.
The diagnosis of POAG was based on presence of glaucomatous optic neuropathy, i.e., cupping and atrophy of the optic disc with corresponding RNFL defects, and a history of intraocular pressure (IOP) >22 mmHg, irrespective of VF loss. All subjects underwent a comprehensive ophthalmologic examination at time of enrollment, and glaucoma subjects received a VF exam to determine MD and pattern standard deviation (PSD). All VF were performed on Humphrey Field Analyser II (Carl Zeiss Meditec Inc., Dublin, CA, USA), and only reliable tests were included (≤33% fixation losses, false-negative results and false-positive results). One eye from each subject was included in this study. A single eye was randomly selected and imaged if both were eligible.
We gathered blood pressure (BP) measurements for a subgroup of subjects that were followed at UW for other medical conditions to determine if differences in calculated mean ocular perfusion pressure (MOPP) were present. All BP measurements were taken within one year before or after the OMAG scan. None of the included subjects had changes in BP medications during the time period reviewed.
Image acquisition and scanning protocol
All eyes were scanned using a 68 kHz Cirrus 5000 HD-OCT based OMAG prototype system (center wavelength at 840 nm) with active motion-tracking capability (Carl Zeiss Meditec Inc, Dublin, CA, USA) (10). Three OMAG scans centered on the ONH were acquired after three to five minutes rest to stabilize the blood flow. The OMAG scan pattern generated a volumetric dataset over a 2.4×2.4 mm2 area centered on the optic disc. Four consecutive B-scans were acquired at each fixed transverse location before the scanning probe moved to the next transverse location on the optic disc. A total of 245 transverse locations were sampled. The time difference between two successive B-scans was approximately 3.6 msec.
In addition, a regular Optic Disc Cube 200×200 raster cube scan was acquired using the same prototype device at the same visit to obtain a 3D structural dataset for RNFL thickness and ONH structural measurements. The scan provided a coverage of 6×6 mm2 centered on the optic disc.
The OMAG scans and the structural raster cube were considered poor quality images and omitted from further analysis if the signal strength (SS) fell below the manufacturer recommended cutoff (SS <6) or if they showed significant eye movement.
Optical microangiography (OMAG) processing
All acquired volumetric scans were processed with an OMAG algorithm to extract both the structural and blood flow signals. The details of the OMAG algorithm have been described elsewhere (8,11). Briefly, blood flow signals were calculated by subtracting complex OCT signals between each consecutive B-scans pair at each transverse location (8,11). The intensity of the blood flow signal is proportional to the amount of red blood cells (RBCs) passing through the vessels (12,13). The average of the differences for all three repetitions at each transverse location was calculated to generate the final blood flow signal, IFlow(x,z), as described in Eq. [1]:
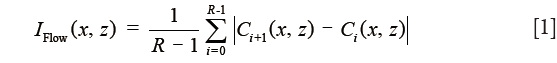
where i is the index of the repeated time of B-scans at each transverse location, C(x,z) indicates the complex OCT signal at xth A-scan and zth sampling point in the axial direction. R(=4) is the number of repeated B-scan.
Retinal layer segmentation
Boundaries of the inner limiting membrane (ILM) and the anterior surface of lamina cribrosa were manually delineated using self-developed semi-automatic retinal layer segmentation software on the structural images to isolate the pre-laminar tissue (preLC, Figure 1A) (14). The same boundaries were then applied to OMAG vascular images (Figure 1B) to form identical retinal layer. Maximum projection analyses, which detected the blood flow signal with the highest intensity value along each A-scan, were performed within the segmented retinal layer to generate vascular en face images in preLC. The optic disc margin was manually delineated by identifying the end of Bruch’s membrane to define the region of ONH on structural B-scans.

Flux, vessel area density, and normalized flux measurements
To quantify ONH perfusion, we created three quantitative measurements: flux, vessel area density, and normalized flux (15).
The flux was defined as the mean flow signal intensity over the entire ONH area and shown in Eq. [2]:
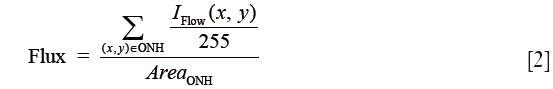
where the blood flow signal IFlow was normalized to between 0 and 1 by dividing 255 (the full dynamic range of the flow signal), and thus represented a ratio without a unit.
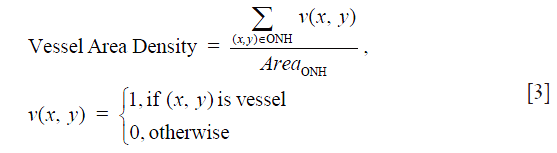
Vessel area density was the ratio of vessel area within the ONH to the area of the ONH (Eq. [3]), indicating the percentage of vessels within the ONH. Blood vessels in the ONH were detected by a multiscale Hessian filter from the vascular en face images (16). The Hessian filter measured the second order of local structure of the vascular en face images. Based on the calculated 2D eigenvalues λ1 and λ2, where |λ1| ≤ |λ2|, the structure information was converted into probability-like estimates of vesselness (16). With Hessian filters in multiple spatial scales, we were able to detect vessels with various diameters. All the detected vessels were then combined together to generate the final vessel map.
As less nerve head tissue requires less ONH perfusion, we further calculated the normalized flux to avoid bias from the reduced vessel area in glaucomatous eyes, which was the flux normalized by the vessel area, to evaluate the flux in the vessels only (Eq. [4]):
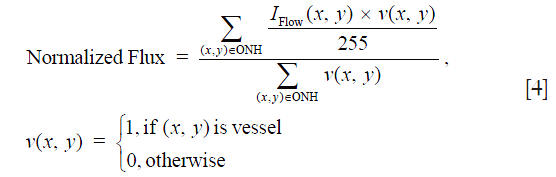
Similar to the flux, in Eq. [4] the blood flow signal was normalized to between 0 and 1 by dividing the full dynamic range of blood flow signal intensity, and thus represented a ratio without a unit.
Statistical analysis
Two-tailed, independent samples t-tests were used to compare the flux, vessel area density, and normalized flux between normal and glaucomatous eyes. Univariate linear regression models were used to investigate the correlation between ONH perfusion metrics and other clinical assessment measurements. All statistical analyses were performed using JMP® Pro 11.1.1 (SAS Institute Inc., Cary, NC, USA). P<0.05 was considered statistically significant.
Results
Twenty-two eyes from 22 normal subjects and 22 eyes from 22 POAG subjects were enrolled. Two normal and one glaucomatous eyes were excluded because of poor signal quality. Table 1 summarizes the demographic information and structural biometric measurements. No significant differences were detected in age, IOP, diagnosis of systemic hypertension and use of systemic antihypertensive medication between normal and glaucoma subjects (P≥0.07). All 21 eyes with POAG were considered stable, with an average MD and PSD of −2.90±2.52 dB (range −7.96 to 0.96 dB) and 4.71±3.02 dB (range 1.74 to 10.91 dB), respectively; 2 eyes (9.5%) had undergone trabeculectomy prior to the OMAG scanning. More subjects in the glaucoma group had diabetes mellitus and used glaucoma medications (P≤0.04, Chi-square tests).

Full table
Among the subgroup of subjects with calculated MOPP (N=16 and 14 for normal and glaucoma groups, respectively), no significant difference in MOPP was found (P=0.15).
For the structural measurements derived from the OCT structural images, normal eyes showed significantly higher RNFL thickness and rim area and significantly lower averaged cup-to-disc ratio compared to glaucomatous eyes (all P<0.0001).
Figure 2 shows an example of the vascular en face image from preLC of a normal and a glaucomatous eye. A significant reduction in the blood flow signal in the preLC vascular en face image was observed in the glaucomatous eyes (Figure 2G) compared to the normal eyes (Figure 2C). The detected vessel map (Figure 2D and H) similarly demonstrated that normal eyes had more blood vessels in the preLC.

Compared with normal eyes, glaucomatous eyes had a significantly lower flux in preLC (0.32±0.04 vs. 0.25±0.07, normal vs. glaucoma, P=0.0002, Table 2), lower vessel area density, and normalized flux in preLC (P≤0.0003).

Full table
In the glaucoma group, univariate regression analyses indicated that the preLC flux, vessel area density, and normalized flux showed significant correlations with VF MD, VF PSD, RNFL thickness, and ONH cup-to-disc ratio and rim area (P≤0.012, Table 3 and Figure 3).

Full table

For the normal group, significant correlations of preLC vessel area density with RNFL thickness and rim area were detected (P≤0.0453, Table 4 and Figure 3) but not with other clinical measurements. In both groups, ONH perfusion metrics did not show significant correlation with MOPP (P>0.74).

Full table
Discussion
We demonstrate that OMAG is able to visualize and quantify ONH perfusion in normal and glaucomatous eyes. By detecting differences in OCT signals between adjacent B-scans at the same transverse location, we visualized the blood vessels in the ONH and measured ONH perfusion. Significant differences in ONH perfusion were found between normal and glaucomatous eyes, and ONH perfusion was robustly correlated with functional and structural changes found in glaucoma.
In OMAG, when the incident light is backscattered by retinal tissue, the OCT signal remains steady, but it changes over time when the light is backscattered by moving RBCs. Based on this concept, OMAG generates ONH microcirculatory information by subtracting two consecutive B-scans; the OCT signals from static retinal tissues are removed while the signals from moving blood cells remain. We have found OMAG has high intra- and inter-observer repeatability and reproducibility [coefficient of variation <3.7% (intra-observer) and intraclass correlation coefficient ≥0.953 (inter-observer); unpublished data], which compares favorably to traditional methods, such as DOCT (17). By averaging differences of each repetition, OMAG further enhances the signal-to-noise ratio and generates blood flow signals with better contrast. Since we were detecting the blood flow signals caused by the moving blood cells and then projecting 3D blood flow signals onto 2D vascular en face images, the ONH perfusion measured here is termed flux—number of RBCs crossing through a cross-sectional area of the vessel - which is correlated with blood flow (12,13).
Jia et al. recently quantified ONH perfusion (defined as “flow index”) using split-spectrum amplitude decorrelation angiography (SSADA) algorithm, which detects the decorrelation between A-scan signals and converts it into blood flow signals (18,19). Flow index measures the decorrelation of the OCT signals, which was a function of the displacement of blood cells over time and related to blood flow velocity (18). However, the relationship between flow index and flow velocity is linear only within a narrow range (20). Furthermore, because of the spectrum splitting, the axial resolution was worsened from 5 to 18 µm (18). In contrast, OMAG measures the differences of adjacent complex OCT signals, which have a stronger linear relationship with the number of the blood cells passing through over time, i.e., flux, without sacrificing axial resolution.
Because Jia et al. (19) obtained microcirculatory measurements calculated from en face images of the entire ONH (without segmentation), our results cannot directly be compared to theirs. Nevertheless, they similarly found that glaucomatous eyes showed significantly lower ONH perfusion compared to normal eyes, and the flow index was correlated with the VF PSD and rim area. We found OMAG-derived ONH perfusion metrics had significant correlations with VF MD, VF PSD, RNFL thickness, and ONH cup-to-disc ratio and rim area. A strength of OMAG is the ability to isolate preLC, which is relevant to early glaucomatous damage (21,22). We specifically limited our glaucoma group to those with mild-moderate glaucoma, to determine the ability of OMAG to distinguish earlier disease from normal, and found it performed well, with high correlation with both structural and functional measures of glaucoma. Another strength of our study was the use of an age-matched control group, which limits bias due to potential age-related changes in ONH circulation.
Notably, we also found significant correlations of vessel area density with RNFL thickness and rim area in normal group. No significant correlation was found between normalized flux and OCT structural measurements because this metric was normalized by vessel area.
Our study has limitations. Studies have shown that ocular antihypertensive eye drops decrease the IOP and may increase the blood flow in the ONH (23,24). Most of our glaucoma subjects (86%) were taking antihypertensive eye drops and the effects of their medications on ONH perfusion are unknown. In addition, we did not obtain VF testing in our normal subjects. However, all normal subjects underwent comprehensive ocular examination and had statistically normal peripapillary RNFL thickness and normal optic disc measures using FD-OCT. Another limitation was that the BP measurements were not taken at the time of the OMAG scan, and MOPP was based on retrospective BP measurements. However, none of the included subjects had changes in BP medications during the time period reviewed and a previous published paper using OCT angiography also found no significant correlations between MOPP and ONH perfusion (19).
Our OMAG prototype was not able to measure accurately the ONH perfusion in the lamina cribrosa (LC), because with its 840 nm laser source, the visibility of the LC tissue was limited and highly affected by the pre-laminar tissue. However, since previous studies have shown that early glaucomatous damage is primarily found in preLC tissue, the results of our cohort with early to moderate glaucoma (MD range −7.96 to 0.63 dB) are notable (21,22). A light source with a longer wavelength, or using swept-source OCT at 1,060 nm wavelength (25), might enable accurate measurement of microcirculation within LC tissue.
In conclusion, OMAG provides a highly reproducible, non-invasive method to visualize and quantify ONH perfusion in normal and glaucomatous eyes. ONH perfusion metrics detected by OMAG were significantly lower in glaucomatous than normal eyes within the preLC, and strongly correlated with functional and structural changes in glaucomatous eyes. Our results show that OMAG may be able to add additional insight into ONH perfusion and its relationship to disease states such as glaucoma.
Acknowledgements
This study was supported in part by National Institutes of Health contract NEI R01-EY024158; Carl Zeiss Meditec Inc.; Research to Prevent Blindness (New York, NY, USA).
Footnote
Conflicts of Interest: CL Chen, Q Zhang, and RK Wang received research support from Carl Zeiss Meditec, Inc. MA Johnstone is a consultant for Healonics, Sensimed, Ivantis, Cascade Ophthalmics, and receives royalties from intellectual property owned by Allergan. RK Wang has significant financial interest in the intellectual property of OMAG technology, owned by Oregon Health & Science University. The other authors have no conflicts of interest to declare.
References
- Flammer J, Orgül S. Optic nerve blood-flow abnormalities in glaucoma. Prog Retin Eye Res 1998;17:267-89. [Crossref] [PubMed]
- Flammer J, Orgül S, Costa VP, Orzalesi N, Krieglstein GK, Serra LM, Renard JP, Stefánsson E. The impact of ocular blood flow in glaucoma. Prog Retin Eye Res 2002;21:359-93. [Crossref] [PubMed]
- Gherghel D, Orgül S, Gugleta K, Gekkieva M, Flammer J. Relationship between ocular perfusion pressure and retrobulbar blood flow in patients with glaucoma with progressive damage. Am J Ophthalmol 2000;130:597-605. [Crossref] [PubMed]
- Kaiser HJ, Schoetzau A, Stümpfig D, Flammer J. Blood-flow velocities of the extraocular vessels in patients with high-tension and normal-tension primary open-angle glaucoma. Am J Ophthalmol 1997;123:320-7. [Crossref] [PubMed]
- Stewart WC, Kolker AE, Sharpe ED, Day DG, Holmes KT, Leech JN, Johnson M, Cantrell JB. Factors associated with long-term progression or stability in primary open-angle glaucoma. Am J Ophthalmol 2000;130:274-9. [Crossref] [PubMed]
- Tobe LA, Harris A, Hussain RM, Eckert G, Huck A, Park J, Egan P, Kim NJ, Siesky B. The role of retrobulbar and retinal circulation on optic nerve head and retinal nerve fibre layer structure in patients with open-angle glaucoma over an 18-month period. Br J Ophthalmol 2015;99:609-12. [Crossref] [PubMed]
- Stein MR, Parker CW. Reactions following intravenous fluorescein. Am J Ophthalmol 1971;72:861-8. [Crossref] [PubMed]
- Wang RK, An L, Francis P, Wilson DJ. Depth-resolved imaging of capillary networks in retina and choroid using ultrahigh sensitive optical microangiography. Opt Lett 2010;35:1467-9. [Crossref] [PubMed]
- Thorell MR, Zhang Q, Huang Y, An L, Durbin MK, Laron M, Sharma U, Stetson PF, Gregori G, Wang RK, Rosenfeld PJ. Swept-source OCT angiography of macular telangiectasia type 2. Ophthalmic Surg Lasers Imaging Retina 2014;45:369-80. [Crossref] [PubMed]
- Zhang Q, Huang Y, Zhang T, Kubach S, An L, Laron M, Sharma U, Wang RK. Wide-field imaging of retinal vasculature using optical coherence tomography-based microangiography provided by motion tracking. J Biomed Opt 2015;20:066008. [Crossref] [PubMed]
- An L, Shen TT, Wang RK. Using ultrahigh sensitive optical microangiography to achieve comprehensive depth resolved microvasculature mapping for human retina. J Biomed Opt 2011;16:106013. [Crossref] [PubMed]
- Yousefi S, Qin J, Wang RK. Super-resolution spectral estimation of optical micro-angiography for quantifying blood flow within microcirculatory tissue beds in vivo. Biomed Opt Express 2013;4:1214-28. [Crossref] [PubMed]
- Yousefi S, Wang RK. Simultaneous estimation of bidirectional particle flow and relative flux using MUSIC-OCT: phantom studies. Phys Med Biol 2014;59:6693-708. [Crossref] [PubMed]
- Yin X, Chao JR, Wang RK. User-guided segmentation for volumetric retinal optical coherence tomography images. J Biomed Opt 2014;19:086020. [Crossref] [PubMed]
- Reif R, Qin J, An L, Zhi Z, Dziennis S, Wang R. Quantifying optical microangiography images obtained from a spectral domain optical coherence tomography system. Int J Biomed Imaging 2012;2012:509783.
- Frangi AF, Niessen WJ, Vincken KL, et al. Multiscale vessel enhancement filtering. Springer, 1998:130-7.
- Wang Y, Lu A, Gil-Flamer J, Tan O, Izatt JA, Huang D. Measurement of total blood flow in the normal human retina using Doppler Fourier-domain optical coherence tomography. Br J Ophthalmol 2009;93:634-7. [Crossref] [PubMed]
- Jia Y, Tan O, Tokayer J, Potsaid B, Wang Y, Liu JJ, Kraus MF, Subhash H, Fujimoto JG, Hornegger J, Huang D. Split-spectrum amplitude-decorrelation angiography with optical coherence tomography. Opt Express 2012;20:4710-25. [Crossref] [PubMed]
- Jia Y, Wei E, Wang X, Zhang X, Morrison JC, Parikh M, Lombardi LH, Gattey DM, Armour RL, Edmunds B, Kraus MF, Fujimoto JG, Huang D. Optical coherence tomography angiography of optic disc perfusion in glaucoma. Ophthalmology 2014;121:1322-32. [Crossref] [PubMed]
- Choi WJ, Lee B, Adhi M, Waheed NK, Lu CD, Liu JJ, Potsaid B, Jayaraman V, Duker JS, Fujimoto JG. OCT angiography of retinal pathologies using ultrahigh speed swept source optical coherence tomography (abstract). ARVO Annual Meeting 2014.
- Yang H, Downs JC, Bellezza A, Thompson H, Burgoyne CF. 3-D histomorphometry of the normal and early glaucomatous monkey optic nerve head: prelaminar neural tissues and cupping. Invest Ophthalmol Vis Sci 2007;48:5068-84. [Crossref] [PubMed]
- Roberts MD, Grau V, Grimm J, Reynaud J, Bellezza AJ, Burgoyne CF, Downs JC. Remodeling of the connective tissue microarchitecture of the lamina cribrosa in early experimental glaucoma. Invest Ophthalmol Vis Sci 2009;50:681-90. [Crossref] [PubMed]
- Ishibashi S, Hirose N, Tawara A, Kubota T. Effect of latanoprost on the diurnal variations in the intraocular and ocular perfusion pressure in normal tension glaucoma. J Glaucoma 2006;15:354-7. [Crossref] [PubMed]
- Liu CJ, Ko YC, Cheng CY, Chiu AW, Chou JC, Hsu WM, Liu JH. Changes in intraocular pressure and ocular perfusion pressure after latanoprost 0.005% or brimonidine tartrate 0.2% in normal-tension glaucoma patients. Ophthalmology 2002;109:2241-7. [Crossref] [PubMed]
- Takayama K, Hangai M, Kimura Y, Morooka S, Nukada M, Akagi T, Ikeda HO, Matsumoto A, Yoshimura N. Three-dimensional imaging of lamina cribrosa defects in glaucoma using swept-source optical coherence tomography. Invest Ophthalmol Vis Sci 2013;54:4798-807. [Crossref] [PubMed]

