
1H-MR imaging of the lungs at 3.0 T
Introduction
Clinical lung imaging is most often done using computed tomography or nuclear medicine techniques. More recently, imaging lung parenchyma has been accomplished using hyperpolarized helium-3 (3He) or xenon-129 (129Xe) MR imaging (1-3). Routine lung imaging approaches suffer from radiation exposure, and for the case of nuclear medicine, poor spatial resolution. The hyperpolarization approach requires expensive hardware and costly 3He. More recent advances in this technology has leaned more towards 129Xe, but that suffers from patient/subject anaesthetic effects. Because of these limitations proton-based magnetic resonance imaging (MRI) methods for imaging lung have been of interest. For example, lung 1H-MRI has been done using hyperoxia enhancement (4,5), with double and triple inversion recovery (IR) imaging (6,7), during breathing of nebulized gadolinium (Gd) contrast agent (8), using ultrashort (9) or zero TE (10) MRI and following intravenously injected Gd contrast (11). Although these approaches have all had some success there still remain difficulties, such as limited signal-to-noise ratio (SNR), scan length, and spatial coverage.
MR imaging of the lung is difficult not only because of lung morphology. The problems manifest as susceptibility artefacts due to air, and also longer T1 and shorter T2 compared to other tissues due in part to the relatively low content of mobile water protons. Adding to these problems is the complex physiological motion, through cardiac and respiratory cycles, both of which need diminished in order to produce diagnostically useful data. Respiratory motion can be minimized by either breath holding, prospective gating, or use of navigator echoes. While prospective gating has been found to produce superior image quality over retrospective gating techniques (12), the application of retrospective gating, such the minimal variance algorithm (MVA), has also shown reasonable success.
Breath holding techniques for lung imaging are often not possible in people suffering from respiratory problems (i.e., those that need the imaging done). For these patients motion severely impacts image quality and hence diagnostic utility. Therefore the approach we describe in this manuscript emphasizes quality image acquisition while not imposing difficult breathing demands that also sacrifice subject comfort. We allowed subjects to breathe freely, during a cardiac gated fast spin echo (FSE) [also called turbo spin echo (TSE)] acquisition. The application of FSE pulse sequences to image lungs is not novel. Ogasawara et al. (13) successfully imaged lung physiological changes due to systolic and diastolic components of the cardiac cycle, where differences in image intensity were thought due to microvascular perfusion effects. More recently, a multi-shot radial turbo spin-echo (rTSE) sequence, utilizing a modified golden ratio-based reordering scheme, was used to show good 1H-MR images that have reduced motion artefacts (14).
In our current study we acquired free breathing lung 1H-MR images during acquisition of a cardiac-gated rectilinear k-space filling FSE sequence with 9 to 10 trigger delays. By retrospectively sorting k-space according to respiratory cycle, motion compensated lung images were produced for each cardiac trigger point resulting in lung images spanning the entire cardiac cycle. As previous FSE lung contrast was thought due to flow, we compared prospectively gated FSE images to routine lung blood perfusion using dynamic contrast enhanced MRI (dceMRI).
Materials and methods
Subjects and image acquisition parameters
In a study approved by a local research ethics board, 10 healthy volunteers (nine males and one female, 23–37 years old) were scanned using a GE twin speed short bore 3 T MRI system and 8 channel torso array RF coil (GE Healthcare, Milwaukee, WI, USA). Subjects were positioned supine with four posteriorly placed electrocardiogram (ECG) leads and a standard GE respiratory bellows. An intravenous line (20 gauge), connected to a Spectris Solaris power-injector (Medrad, Warrendale, PA, USA), was positioned in the left antecubital vein. Arms were positioned proximal to their sides to improve subject comfort during long scan times.
Lung imaging was done using a modified (see below) cardiac gated FSE-XL sequence (TE =13.4 ms, 256×256, FOV =40×40 cm, 15 mm thick, echo train length, ETL =6, NEX =18). Acquisition was triggered evenly at 2×RR intervals (20% R window), with varying (18 to 800 ms) time delays incremented to cover the entire cardiac cycle (Figure 1). Cardiac rate at rest for different subjects varied between 50–70 bpm creating a variation between proton density and T1 weighting. Total imaging time was 13 minutes (depending on cardiac rate).

The FSE pulse sequence was modified such that k-space data was written to disk sequentially as it was acquired. Each line of k-space was acquired from one refocused echo, but with the use of the FSE, and scan parameters above, raw data was acquired in a series of 22 view windows, each sampling 6 lines of k-space. The time to acquire one view window TView Window depended on ETL and TE as:

Each of the views belongs to a time point triggered from the ECG signal as shown in Figure 1. The trigger point was always an R wave, only the trigger delay data was varied and collected throughout the entire cardiac cycle.
Data analysis
Retrospective gating of FSE data, to reduce respiratory motion artefacts, was done by reconstructing images from raw data according to physiological parameters recorded from the respiratory bellows and ECG leads. Raw image data (i.e., k-space) acquired during the scan was then sorted based on the MVA, and reconstructed off-line using an in house Matlab (Mathworks Inc., Natick, MA, USA) program that took into account respiratory motion. The basic principle behind the MVA algorithm is to sort k-space data according to physiologic state. First k-space data is over sampled in time according to its location in k-space and time of collection. The limit of allowed physiological motion is preset by the user. Subsequently data that was collected outside of the permitted range is discarded. Remaining data is sorted into appropriate k-space positions and reconstructed (Figure 2). In addition to k-space reordering, location of k-space data from multiple coils was identified and used in the final reconstruction.

Images from the eight individual elements of the torso phased array RF coil were combined using a sum-of-squares algorithm (SoS). As shown by Larsson et al. (15) and Roemer et al. (16) SNR improvements of an optimally reconstructed image from known coil sensitivity profiles over the SoS method is minuscule. Image I(x,y) was thus reconstructed according to:
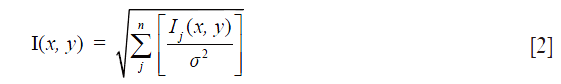
where Ij(x,y) refers to image from coil j, and σ2 is the mean squared deviation of noise or noise variance. If images were misaligned, realignment was done using ImageJ (http://rsb.info.nih.gov/ij/) with the StackReg plug-in http://bigwww.epfl.ch/thevenaz/stackreg.
Signal to noise ratio (SNR) and contrast to noise ratio (CNR) calculations were performed on 12 circular ROIs: 3 each for muscle, lung, highest intensity ghost, and in the background between the ghosts. ROIs were placed identically between subjects. Lung ROIs were kept away from major vessels. Lung images from the modified FSE sequence were obtained by two methods. The first technique involved subtraction of images collected in a systole from those collected in diastole. The second approach was through pixel-wise integration over the cardiac cycle.
Lung microvascular perfusion (dynamic contrast MRI, dceMRI) was done following FSE acquisition, using a fast spoiled gradient recalled echo (fSPGR) acquisition (single slice, minimum TE, flip angle =75°, FOV= 40×40 cm, 246×256 matrix, 100 mm thick). A 17 cc bolus of Gd-DTPA-BMA (0.2 mmol·kg−1, GE Healthcare/Amersham, Milwaukee, WI, USA), and 20 cc saline (0.9%) flush, was injected at a rate of 2 cc/second during one 30 second breath hold resulting in 20 to 30 images. The dynamic contrast enhanced images were used to calculate images related to microvascular perfusion. Using the Functool2 software (GE Healthcare, Milwaukee, MI, USA) the bolus mean transit time (MTT), time to peak (TTP), and enhancement integral were calculated.
Results
By ECG triggering image acquisition throughout the entire cardiac cycle, and sorting k-space based on physiological parameters, clear variation in lung signal intensity was observed (Figure 3). This variation corresponded to different phases of the ECG waveform. The ECG QRS complex, marking the beginning of ventricular systole, is immediately followed with isovolumetric contraction of the heart ventricles and rapid blood ejection. This phase matched a decrease in MR lung signal intensity. The end of systole is marked by the T-wave, during which reduced ejection of blood occurs. The end of the T-wave marks the beginning of diastole, where ventricular volume is at a minimum (isovolumetric relaxation) and lung MR signal returns to pre-QRS intensity. With the drop in ventricular pressure valves open and the blood accumulated in the atria jets rapidly into the ventricles. This cardiac phase was matched with a second drop in signal intensity in the lung parenchyma. Based on ROI analysis the observed lung MR signal changes were most pronounced in the posterior regions of the right lung (Figure 3). Furthermore, the left lung had more consistent signal throughout the parenchyma, based on ROI analysis throughout the cardiac cycle (Figure 3).

The signal to noise ratio of lung was on the order of 10% relative to thoracic muscle (Table 1). The motion correction algorithm did not significantly affect SNR for lung or any other thoracic tissues. Quantification of ghosting showed a slight decrease in signal, although not significant at the 95% level of confidence (Tables 1 and 2). Signal change in muscle, lung and background versus trigger delay time was analyzed and no correlation between the signal change in muscle and background was noted. However a clear change in lung signal occurred as a dip around 200 ms after the trigger delay (Figure 3). The MR signal change with cardiac phase during inspiration and expiration were found to be nearly identical.

Full table

Full table
Following sorting of k-space, based on physiological state, lung images were obtained by either subtracting diastole from systole (Figure 4A) or by peak integration over the cardiac cycle (Figure 4B). Motion appeared to contaminate both approaches. However, the pixel-wise integration appeared to give the best CNR for lung tissue (Figure 4B). Although ROI based analysis showed regional differences in lung signal (Figure 3) these were not easily appreciable on the images.

Lung dynamic MRI microvascular perfusion images were calculated from MR signal change following first pass of a Gd contrast agent. A 150% increase in parenchyma signal intensity was observed during peak signal change of a T1-weighted perfusion sequence (Figure 5A). TTP (Figure 5B) and map of positive enhancement integral (Figure 5C), both related to tissue perfusion, were used to infer lung perfusion. In healthy volunteers blood perfusion was clearly elevated in the posterior aspects of the lung parenchyma, relative to anterior (Figure 5B).

Discussion
The most frequently chosen method for imaging lung is CT scanning. However, dosage of ionizing X-ray radiation precludes repeated CT scanning procedures. Use of MR techniques for routine clinical lung imaging is done almost exclusively using an intravenous Gd-based contrast agent which increases lung tissue contrast. However, contraindications for Gd agents, such as the relationship between impaired renal function and the development of nephrogenic systemic fibrosis (NSF) (17), and the more recent discovery of intracranial accumulation of Gd following intravenous injection (18) has fuelled interest in development of MR imaging approaches that do not rely on intravenous contrast. For example novel lung imaging approaches have been demonstrated using 2D or 3D time of flight techniques, arterial spin labelling (ASL), or by employing difference in perfusion due to cardiac phases (7,13,19-22). Nonetheless the intravenous gadodiamide agent produces by far the highest quality lung imaging with minimal artefacts. Furthermore, one advantage of intravenous MR contrast agents over conventional angiography and CT contrast agents is that, unlike iodinated contrast media, Gd chelates are not nephrotoxic (11,23).
In this paper proton-based lung imaging was approached using two different methods. Our first approach, using a modified FSE pulse sequence, used inherent vascular contrast that modulates as a result of the cardiac cycle. This was compared to signal modulated during injected contrast. Both methods offered signal changes resulting from blood flow. However, the FSE-based approach can provide a qualitative picture of flow while contrast studies can lead to flow quantitation.
In total ten healthy subjects were scanned at 3.0 Tesla using a ECG gated FSE pulse sequence, with rectilinear k-space filling. Ghosting due to respiratory and cardiac motion was observed in all scans. In several scans some images were predominately corrupted with motion artefacts throughout the lungs making the analysis impossible (those image were discarded). Only in two subjects between-scan motion was severe enough that images had to be realigned. Signal changes during systole and diastole were observed throughout both lungs (Figure 3). Lung signal change was compared to the signal change in muscle and background (Figure 4). Correlation was observed only between lung signal and cardiac cycle. No significant signal change was observed in muscle throughout the cardiac cycle. Background signal was dominated by noise and ghosting thus signal change was sporadic.
In previous work, we compared 1.5 and 3 T with quantitative perfusion imaging obtained with both spin echo and FSE (24). For all cases images collected in systole were subtracted from those in diastole (Figure 4). Integrating over the cardiac cycle improved lung visibility substantially and parenchyma was better delineated compared to simple subtraction. For both methods 3T, with its improved SNR was superior at showing lung tissue. Spin echo, although slower in acquisition, did not show appreciable difference compared to FSE at either field strength.
FSE imaging offers considerable advantages over SE techniques. For example, acquisition is faster and SAR is lower (twice as fast with 16% reduction in SAR comparing 6NEX SE to 18NEX FSE with an ETL of 6) (note: SAR is unquestionably higher at 3 T compared to 1.5 T, increasing with the square of the field strength). One disadvantage however is not all of the acquired FSE data can be used for retrospective gating. In order to minimize motion, only about 33% of acquired data that fall within the limits of the respiratory cycle is reconstructed. More data can be recovered by reconstructing data in expiration and inspiration respiratory phases. Furthermore, image acquisition using SE with respiratory compensation is slow, and respiratory motion correction is not perfect. Also the ghosting from muscle-fat still appeared in all of the images, albeit with lower SNR comparing to that of lung. Ghosting from the tissue surrounding lungs was observed in all of the images in the phase direction. Respiratory compensation and motion correction were comparable in the inability to suppress ghosting. Note, the signal and CNRs (of ghosts) were comparable between spin echo and FSE experiments (Tables 1 and 2). It is hard to quantify ghost suppression through SNR and CNR measurements. Instead ghosting was judged non-quantitatively as high, moderate or low based on visual inspection.
Lung images were obtained by two methods where for both the change in signal is hypothesized to be due in part to microvascular perfusion. The first technique involved subtraction of images collected in a systole from images collected in diastole (Figure 4). The second method involves integrating over the cardiac cycle producing images shown in Figure 4. Successful MR imaging of the lung is highly dependent on the ability to compensate for respiratory and cardiac motion. Two different methods for minimizing motion artefacts have been used in this paper. The first technique, a free breathing cardiac gated technique relying on blood flow as contrast, is likely more suitable for patients. However free breathing acquisitions required long scan times, at least two cardiac time points at 13 min per point with (NEX 18) and thus it becomes more difficult to correct for all respiratory motion. Evaluation of diseased lung images with artefacts could be problematic. The second technique involved Gd-based contrast perfusion combined with breath holding to eliminate respiratory motion. Cardiac motion was not accounted for in this technique, because it is critical to time image acquisition and contrast arrival correctly to produce useful results. Two techniques both bring certain advantages and disadvantages to the field of lung imaging. The non contrast based method offers a great deal of information not only on perfusion but also pulmonary hemodynamics.
The variation of flow and MR signal during the cardiac cycle is complex but well understood. In a recent report by Miyazaki et al. (25) variation in MR signal with cardiac phase was shown in ascending and descending aorta, and superior vena cava at 1.5 Tesla. An 85% signal increase between blood velocity of 60 and 10 cm/s was measured using a half Fourier FSE pulse sequence. As the pulmonary artery branches into smaller vessels, lung blood velocity decreases. In another study mean pulmonary blood flow of 11.0±2.1 cm/s through the pulmonary trunk, in resting healthy individuals, was measured compared to significantly increased blood flow (20.5±3.0 cm/s) in patients with pulmonary hypertension (26). Achievement of more accurate blood flow signal can lead to better differentiation between healthy and diseased lungs. FSE experiments showed lung signal increase of 85.55%±55.0% at 3.0 Tesla between, systolic and diastolic phases. Using a Student’s t-test to compare percent signal change between the two MRI systems showed 3.0 Tesla to be more sensitive to signal changes due to blood flow than 1.5 Tesla (P=0.037) (24). In order to perform a scan of the entire cardiac cycle however with sufficient SNR (through increased NEX), up to 13 minutes per data point is required, making it hard to observe signal change throughout the entire cardiac cycle. A reduction of NEX to 6 and discarding the retrospective gating would reduce the scan time to 4 minutes. With the use of an even faster approach, that of cine phase-contrast, Kellenberger et al. (27) showed blood flow measurements in aorta. However, the same technique however could not be used to image lung tissue, because of susceptibility problems.
Two methods often used for gating are retrospective and prospective gating. In prospective gating data is acquired only when the physiological motion is within predefined acceptance window. Retrospective gating, on the other hand, reconstructs over sampled data, according to the physiological motion (28). Prospective gating has been found to produce superior image quality over the retrospective gating images (12). A recent study has also used k-space view reordering to minimize artifacts when doing 1H lung MRI scans (14). Their approach was based on a multi-slice 2D radial projection approach where each view was acquired using a modified golden ratio-based reordering scheme so coherent streaking artefacts due to cyclically varying physiological motion became benign in the final images. Their results matched very well with that seen using CT in patients having a number of pulmonary diseases. Our current work, demonstrated here, had quite good CNR for lung tissue using view reordering based on the cardiac cycle. However, we did suffer from physiological motion contamination. Therefore future work in 1H lung MRI would benefit from combining the view reordering approach we describe herein with that of Völker et al. (14). Such an approach would likely have superior lung CNR combined with a tremendous reduction in the visibility of physiological motion related contamination.
In conclusion, lung imaging at 3.0 Tesla is possible and was demonstrated for non-contrast perfusion imaging. Non-contrast perfusion performed better at 3.0 Tesla as higher fields provide enhanced sensitivity to flow and thus increase percent signal enhancement. In order to evaluate this perfusion technique further a study involving a diseased population is necessary.
Acknowledgements
Funding provided through a Natural Sciences and Engineering Research Council of Canada (NSERC) Discovery Grant and Ontario Thoracic Society block term grant to MDN. Thanks to Ms. Toni Cormier who placed IVs in volunteers and did the MRI acquisitions.
Footnote
Conflicts of Interest: The authors have no conflicts of interest to declare.
References
- Wild JM, Ajraoui S, Deppe MH, Parnell SR, Marshall H, Parra-Robles J, Ireland RH. Synchronous acquisition of hyperpolarised 3He and 1H MR images of the lungs - maximising mutual anatomical and functional information. NMR Biomed 2011;24:130-4. [PubMed]
- Fain SB, Korosec FR, Holmes JH, O'Halloran R, Sorkness RL, Grist TM. Functional lung imaging using hyperpolarized gas MRI. J Magn Reson Imaging 2007;25:910-23. [PubMed]
- Kauczor HU, Hanke A, Van Beek EJ. Assessment of lung ventilation by MR imaging: current status and future perspectives. Eur Radiol 2002;12:1962-70. [PubMed]
- Hemberger KR, Jakob PM, Breuer FA. Multiparametric oxygen-enhanced functional lung imaging in 3D. MAGMA 2015;28:217-26. [PubMed]
- Ohno Y, Chen Q, Hatabu H. Oxygen-enhanced magnetic resonance ventilation imaging of lung. Eur J Radiol 2001;37:164-71. [PubMed]
- Jakob PM, Hillenbrand CM, Wang T, Schultz G, Hahn D, Haase A. Rapid quantitative lung (1)H T(1) mapping. J Magn Reson Imaging 2001;14:795-9. [PubMed]
- Mai VM, Knight-Scott J, Berr SS. Improved visualization of the human lung in 1H MRI using multiple inversion recovery for simultaneous suppression of signal contributions from fat and muscle. Magn Reson Med 1999;41:866-70. [PubMed]
- Haage P, Karaagac S, Spüntrup E, Adam G, Günther RW. MR imaging of lung ventilation with aerosolized gadolinium-chelates. Rofo 2003;175:187-93. [PubMed]
- Ma W, Sheikh K, Svenningsen S, Pike D, Guo F, Etemad-Rezai R, Leipsic J, Coxson HO, McCormack DG, Parraga G. Ultra-short echo-time pulmonary MRI: evaluation and reproducibility in COPD subjects with and without bronchiectasis. J Magn Reson Imaging 2015;41:1465-74. [PubMed]
- Gibiino F, Sacolick L, Menini A, Landini L, Wiesinger F. Free-breathing, zero-TE MR lung imaging. MAGMA 2015;28:207-15. [PubMed]
- Berthezène Y, Croisille P, Wiart M, Howarth N, Houzard C, Faure O, Douek P, Amiel M, Revel D. Prospective comparison of MR lung perfusion and lung scintigraphy. J Magn Reson Imaging 1999;9:61-8. [PubMed]
- Du YP, McVeigh ER, Bluemke DA, Silber HA, Foo TK. A comparison of prospective and retrospective respiratory navigator gating in 3D MR coronary angiography. Int J Cardiovasc Imaging 2001;17:287-94; discussion 295-6. [PubMed]
- Ogasawara N, Suga K, Zaki M, Okada M, Kawakami Y, Matsunaga N. Assessment of lung perfusion impairment in patients with pulmonary artery-occlusive and chronic obstructive pulmonary diseases with noncontrast electrocardiogram-gated fast-spin-echo perfusion MR imaging. J Magn Reson Imaging 2004;20:601-11. [PubMed]
- Völker M, Ehses P, Weick S, Breuer FA, Blaimer M, Hintze C, Biederer J, Jakob PM. Free breathing 1H MRI of the human lung with an improved radial turbo spin-echo. MAGMA 2015;28:227-38. [PubMed]
- Larsson EG, Erdogmus D, Yan R, Principe JC, Fitzsimmons JR. SNR-optimality of sum-of-squares reconstruction for phased-array magnetic resonance imaging. J Magn Reson 2003;163:121-3. [PubMed]
- Roemer PB, Edelstein WA, Hayes CE, Souza SP, Mueller OM. The NMR phased array. Magn Reson Med 1990;16:192-225. [PubMed]
- Kuo PH, Kanal E, Abu-Alfa AK, Cowper SE. Gadolinium-based MR contrast agents and nephrogenic systemic fibrosis. Radiology 2007;242:647-9. [PubMed]
- McDonald RJ, McDonald JS, Kallmes DF, Jentoft ME, Murray DL, Thielen KR, Williamson EE, Eckel LJ. Intracranial Gadolinium Deposition after Contrast-enhanced MR Imaging. Radiology 2015;275:772-82. [PubMed]
- Hatabu H, Gefter WB, Kressel HY, Axel L, Lenkinski RE. Pulmonary vasculature: high-resolution MR imaging. Work in progress. Radiology 1989;171:391-5. [PubMed]
- Mai VM, Liu B, Polzin JA, Li W, Kurucay S, Bankier AA, Knight-Scott J, Madhav P, Edelman RR, Chen Q. Ventilation-perfusion ratio of signal intensity in human lung using oxygen-enhanced and arterial spin labeling techniques. Magn Reson Med 2002;48:341-50. [PubMed]
- Knight-Scott J, Keilholz-George SD, Mai VM, Christopher JM. Temporal dynamics of blood flow effects in half-Fourier fast spin echo (1)H magnetic resonance imaging of the human lungs. J Magn Reson Imaging 2001;14:411-8. [PubMed]
- Bader TR, Semelka RC, Pedro MS, Armao DM, Brown MA, Molina PL. Magnetic resonance imaging of pulmonary parenchymal disease using a modified breath-hold 3D gradient-echo technique: initial observations. J Magn Reson Imaging 2002;15:31-8. [PubMed]
- Obruchkov SI, Noseworthy MD. Comparing Gd contrast and non-contrast lung perfusion imaging at 1.5T and 3T. Proc Intl Soc Mag Reson Med 2006;14:1309.
- Miyazaki M, Sugiura S, Tateishi F, Wada H, Kassai Y, Abe H. Non-contrast-enhanced MR angiography using 3D ECG-synchronized half-Fourier fast spin echo. J Magn Reson Imaging 2000;12:776-83. [PubMed]
- Saro JP, Rafael JA, De Lima JJ, Botelho MF, Ribeiro MJ. First pass evaluation of blood velocity in the pulmonary artery. Nucl Med Commun 2001;22:813-6. [PubMed]
- Kellenberger CJ, Macgowan CK, Roman KS, Al-Habshan F, Benson LN, Redington AN, Yoo SJ. Hemodynamic evaluation of the peripheral pulmonary circulation by cine phase-contrast magnetic resonance imaging. J Magn Reson Imaging 2005;22:780-7. [PubMed]
- Bernstein MA, King KF, Zhou XJ, editors. Handbook of MRI Pulse Sequences. Elsevier Academic Press, 2004:482-9.

