
Arterial input function placement effect on computed tomography lung perfusion maps
Introduction
Dynamic perfusion computed tomography (DPCT) is becoming an important functional imaging technique on clinical management. It is an established and widely utilized tool in patients with an acute cerebrovascular accident to assess viability of brain tissue (1-3). In oncology, it is being increasingly recognized to assess tumor vascularity (4-6) and it has been studied in different organs, including the liver (7), the kidneys (8), the pancreas (9) and the lungs (10). Functional imaging with computed tomography (CT) has many advantages over other imaging techniques such as nuclear medicine and magnetic resonance imaging (MRI). CT offers wider availability, shorter exam times, higher temporal and spatial resolution and a linear relationship between the concentration of iodinated contrast medium and the CT attenuation value measures in Hounsfield units (HU).
However, physical constraint of detector size renders a z-axis volume coverage <4 cm, which is a significant disadvantage of CT when isotropic data and high temporal resolution are required for whole organ coverage in the same volume. The mismatch between scan coverage and physical dimensions of the detector can be minimized by using wider CT detectors, faster gantry rotation speeds and bidirectional table movements, resulting in whole lung coverage (z-axis =20.7), with a sampling frequency (time stamp) of 2 s (10).
An additional limitation of DPCT is the lack of a standardised approach to data analysis that results in various sources of variability (11). A critical source of variability is the arterial input function (AIF) (12,13). Within first-pass perfusion kinetics, the AIF represents the exact arterial inflow to the capillary bed (13-15). The placement of a region of interest (ROI) in different feeding arteries results in different AIF curves and different quantitative perfusion metrics from the same target organ (13). Hence, in brain DPCT it is recommended to locate the AIF as close as possible to the feeding artery in the tissue of interest. However, the impact of AIF location in lung perfusion has not been investigated yet.
The goal of our study is to determine the impact of AIF location in the pulmonary trunk (PT), right main (RM) or left main (LM) pulmonary arteries on the pulmonary blood flow (PBF) perfusion maps generated using first-pass kinetics with the single input maximum slope (MS) approach (16). We hypothesize that the location of the AIF in the PT, RM, or LM does not have any impact on the perfusion maps.
Materials and methods
The Institutional Animal Care Committee approved this study. We enrolled three juvenile pigs (38.2–40 kg). Each pig had a series of chest CT scans performed pre- and post-pulmonary emboli injection. The order of the CT scans series was as follows: (I) one helical unenhanced scan; (II) one helical contrast enhanced computed tomography pulmonary angiography (CTPA); and (III) nine DPCT scans using three different injection rates and three different injection volumes. Following these CT scans, the pigs were euthanized in accordance with our institutional procedures and policies.
Animal preparation
All pigs arrived at the animal facility 2 days before the study date. The pigs were kept orally hydrated for 12 to 16 hours prior to the study. One hour prior to the experiments, they received intramuscular ketamine (10–33 mg/kg) and atropine sulphate (0.05 mg/kg). The pig was then intubated and maintained under isoflurane anaesthesia (inhalant). During the course of the experiment, the pig was ventilated with a tidal volume of 15 mL/kg at a respiratory rate of 20–24 breaths/min. Using a cut-down technique, an 11-French vascular access sheath (with side arm injection port) was placed in the right common femoral vein to facilitate the injection of thrombotic material.
Pulmonary emboli injection
Thrombotic material, in the form of 20 mL fragments of pre-prepared autologous blood clot, was injected via the femoral vein sheath into the right common iliac vein, using a 20 mL syringe. Ten to twelve clots, ranging from 20 to 40 mm in size were injected sequentially over 5–10 minutes. Previous studies have demonstrated that thrombi of these lengths fragment during the transit to the pulmonary arteries and create in vivo showering of peripheral pulmonary emboli (17).
Scanning protocol
CT scans were performed with the Aquillion ONE scanner (Toshiba Medical Systems, Otawara, Japan) using both helical (64×0.5 mm) and wide volume (320×0.5 mm) modes.
A baseline unenhanced helical scan of the chest was performed using the following parameters: 120 kV, 100 mA, 64×0.5 mm collimation, 0.5 s gantry rotation and pitch factor =0.86. Axial images (1.0/1.0 mm) were reconstructed using a mediastinal kernel. These images were used to confirm scan location, coverage and anatomical location of the pulmonary arteries for the CTPA and DPCT scans.
A helical CTPA was performed after the administration of intravenous contrast medium (Visipaque 320), using a volume of 0.8 mL/kg at a rate of 5 mL/s, followed by saline flush at the same volume and rate. Automated image acquisition was triggered using proprietary software (SureStart, Toshiba Medical Systems, Otawara, Japan) at a threshold of 200 HU in the PT. All scan and reconstruction parameters were identical to the unenhanced helical scan.
A total of 18 DPCT scans were performed; 9 before injection of autologous thrombotic material and 9 afterwards. Intravenous contrast medium was injected using three different injection volumes (0.4, 0.6, and 0.8 mL/kg) and three different injection rates for each volume (4, 6, and 8 mL/s). The DPCT scans were performed with a volume mode using the following parameters: 100 kV, 100 mA, 320×0.5 mm collimation and 0.5 s gantry rotation. The mechanical ventilation was stopped for 25 s during data acquisition. CT images were reconstructed with a slice thickness of 1.0 mm and without overlap, using an Adaptive Iterative Dose Reduction (AIDR-3D) algorithm and a standard body kernel. The time stamp for each volume reconstruction was 0.35 s. A washout period of 10 min was observed after each DPCT scan to enable animal recovery and contrast material washout.
Post-processing and image analysis
Reconstructed images were sent to a dedicated research workstation (Toshiba Medical Systems, Otawara, Japan). In this analysis, first-pass kinetics with the single input MS perfusion model was used to generate PBF perfusion maps. This approach assumes that there is no venous outflow and that blood flow can be calculated as the ratio of the MS of tissue enhancement to the arterial enhancement (= arterial peak—arterial background signal) (16), i.e.,:
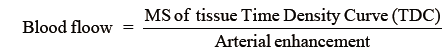
All the sequential reconstructed volumes from the DPCT scan were uploaded into the perfusion analysis software. The software traces contrast flow into the organ and subsequent washout of contrast by recording change in attenuation at every voxel. Two ROIs were manually drawn within the lumen of the target artery and within the target tissue. The change in attenuation values within these ROIs determines the arterial TDC and the lung parenchyma/tissue TDC. The arterial TDC corresponds to AIF and is used to determine the arterial enhancement. The tissue TDC is used to localize the time interval when the MS of tissue enhancement occurs. The MS of tissue enhancement is calculated for every voxel and the PBF is calculated on a voxel by voxel basis using the equation above.
A single user manually prescribed an ROI within the PT, RM and LM pulmonary arteries for each DPCT series (Figure 1), resulting in three arterial TDC maps for each of 54 DPCT series [(9 DPCT pre-PE + 9 DPCT post-PE) ×3 pigs]. A total of 162 AIF TDCs with corresponding PBF perfusion maps were generated.

Quantitative analysis of TDCs and blood flow perfusion maps
Quantitative analysis was performed by comparing the TDCs in the RM and LM to the TDC in the PT.
Quantitative analysis of the PBF perfusion maps was performed by prescribing 26 ROIs of approximately 100 mm2, distributed evenly throughout the lung parenchyma at the following anatomical locations: (I) aortic arch; (II) PT bifurcation; (III) inferior pulmonary veins; (IV) superior lung bases; and (V) inferior lung bases, as demonstrated in Figure 2. The average PBF value in each ROI was determined for every AIF.

Qualitative analysis of blood flow perfusion maps
PBF perfusion maps were generated on 3.0/3.0 mm axial slices for each AIF. The color of each pixel corresponded to a specific PBF value (mL/100 mL/min). Two subspecialty trained chest radiologists independently performed a blinded review and comparison of the PBF color maps on a slice by slice basis from the apex to the diaphragm. They qualitatively assessed any difference in the PBF colour maps and perfusion defects on each slice. A difference in PBF color maps was defined as any mismatch in color between the three maps. A difference in perfusion defects was defined as a focal region of decreased PBF with an area larger than 100 mm2.
A 3-point scale was used for qualitative assessment: a score of 1 corresponds to identical colour maps and perfusion defects for the three AIF; a score of 2 corresponds to visual mismatch between color maps but no disparity in perfusion defects for the three AIF; a score of 3 corresponds to visual mismatch in the color maps as well as discrepancy in perfusion defects for the three AIF. Consensus between the two readers was reached for any discrepant cases.
Statistical analysis
Pearson’s correlation coefficient was calculated to compare the TDCs of the LM and RM to the TDC of the PT. Bland-Altman analysis of the RM-PT and LM-PT TDCs was performed to determine the agreement between different TDCs.
The median and range of the PBF perfusion maps were calculated from the 26 selected ROIs for the three AIF. Fisher’s analysis of variance (ANOVA) was used to compare the mean quantitative values among the three arterial input selections for each ROI. A P value <0.05 was considered statistically significant.
Results
Quantitative analysis of TDCs
An example of the TDCs generated from the PT, RM and LM for different injection volumes and rates of contrast medium is presented in Figure 3. The graphs demonstrate a marked difference in the location and the attenuation peak value for different injection volumes and rates. However, the anatomical location of the AIF (PT, LM or RM) had minimal or negligible impact. These results were consistent across all 3 pigs for all DPCT scans.

Figure 4 demonstrates a comparison of TDCs between the PT and RM (Figure 4A,C) and between the PT and LM (Figure 4B,D) for a single DPCT using a contrast medium volume of 0.8 mL/kg and injection rate of 8 mL/s. Linear regression of the RM and LM TDCs to the PT is demonstrated in Figure 4A,B. These results demonstrate an almost perfect fit, with correlation coefficients of 1.01 (PT-RM and PT-LM) and a residue ≥0.97. The median and range of the linear regression coefficients of all the DPCT scans were 1.01 (0.98–1.03) and of the residues were 0.99 (0.96–1.02) respectively. The agreement in attenuation values between PT and RM and PT and LM were assessed using Bland-Altman plots (Figure 4C,D). These graphs demonstrate that the difference in attenuation values for most measurements is within ±1.96 standard deviations of the mean.

The Spearman’s rank correlation coefficient demonstrated a strong correlation for all scans with r=0.88 (P<0.05).
Quantitative analysis of perfusion maps
Perfusion maps of the 54 DPCT scans were generated for the three different AIF. Evaluation of the perfusion maps demonstrated a wide range in PBF from 200 mL/100 mL/min to 1,300 mL/100 mL/min within the lungs with increased PBF in the posterior and basal regions and substantially reduced flow in the anterior and apical regions. The PBF perfusion maps from the PT, RM and LM were identical on qualitative analysis in all lung regions. There was a substantial inter-pig variation in mean PBF values, ranging from 234 mL/100 mL/min to 953 mL/100 mL/min. However, for a given exam the change in average PBF was less than 14.9% for the three AIF with a median value of 6.9%.
Quantitative assessment of the color maps was performed using the 26 ROI measurements (Figure 2), on the different AIF placements. Fisher ANOVA demonstrated no significant difference between PT, RM, and LM in mean color map value for all the 54 experiments (P>0.05).
Qualitative analysis of perfusion maps
Qualitative assessment of all perfusion maps demonstrated no discrepancy in assessing perfusion defects for the different AIF locations. All color maps scored values in the range of 1 to 2, indicating identical visual maps or maps with minor visual difference but without any impact on assessing perfusion defects. The mean qualitative score given by both radiologists was 1.63. Figure 5 shows two color maps that were given qualitative scores of 1 (Figure 5A-C) and 2 (Figure 5D-F) by both radiologists.

Discussion
Assessment of lung perfusion has the potential to improve the diagnostic utility of CT for the diagnosis of thoracic diseases and for the assessment of disease severity. Several authors have demonstrated functional lung imaging with MRI, SPECT, PET, and CT (10,18-21). However their prognostic value has not been determined. While CT offers interesting advantages over MRI and nuclear medicine for dynamic lung perfusion, there are two major limitations: limited scan coverage and lack of protocol standardization.
Limited scan coverage is being addressed by developing wider CT detectors, faster gantry rotations and bidirectional table movements (10). Current technology enables coverage of organs up to 20.7 cm. Therefore, it is now possible to perform whole DPCT scans and to provide a comprehensive assessment of lung perfusion (10).
Protocol standardization for DPCT is more critical as it requires establishing parameters for data acquisition, data post-processing and interpretation of the results with clinical evidence that confirms the reproducibility and accuracy of perfusion maps (11). One of the main sources of variability in DPCT analysis is the location of the AIF, as different perfusion maps may be generated when different arteries are selected to determine the AIF (13).
First-pass kinetics models assume that the AIF represents the exact arterial inflow to the capillary bed in the specific tissue of interest (13-15), therefore the AIF has to accurately reflect the blood flow in the feeding artery to the tissue. For brain perfusion, the effect of AIF location on perfusion maps has been extensively investigated. It has been demonstrated that AIF location within the middle cerebral artery has no impact on perfusion maps as long as the AIF is not located distal to the clot (11,22,23). However, the impact of AIF location for other organs has not been studied.
To our knowledge, there is no published data on the influence of AIF location on lung DPCT. A few studies on lung nodules and lung cancer have compared perfusion maps when AIF location is at the pulmonary artery or bronchial artery (6,24). These studies have demonstrated that both pulmonary arteries and bronchial arteries contribute significantly to tumor blood flow and therefore a dual input compartment model is essential for tumor perfusion analysis. A dual input model is also required in situations when there is chronic insufficiency of the pulmonary arterial blood supply, as the bronchial arteries hypertrophy and partially compensate. However, in acute clinical setting approximately 95% of lung tissue is supplied solely by the main pulmonary artery (24). Therefore, DPCT analysis of the lung parenchyma in the acute clinical setting requires analysis based on a single arterial input. The location of the AIF has recently been assumed at the PT for the whole lung (10,21). However, the accuracy of this selection has not been validated. Close proximity of the AIF to the tissue ROI is achieved by selecting the LM as the AIF for the left lung and the RM as the AIF for the right lung. If the TDC from the PT, RM, and LM demonstrate identical dispersion, full fidelity perfusion maps of both lungs can be generated from a single AIF location. This is an important principle as it simplifies the analysis and increases the potential utility of conventional systems to perform CT lung dynamic perfusion.
In this study, we generated PBF perfusion maps using DPCT protocols with AIF locations at the PT, LM and RM. We utilized three different injection volumes (0.4, 0.6, and 0.8 mL/kg) and three different injection rates (4, 6, and 8 mL/s) in three pigs for a total of 54 studies. Our linear regression analysis demonstrated a nearly perfect fit of 1.0 between the TDCs generated from AIF locations in the PT, RM, and LM. Bland-Altman plots also demonstrated a strong agreement in attenuation values between the PT and the RM artery as well as the PT and LM artery. Qualitative assessment determined that all PBF perfusion maps were either identical or very similar with minor color mismatches that did not impact the assessment of perfusion defects.
Our results are consistent with previous brain DPCT studies performed in stroke patients, where different locations of the AIF within the anterior cerebral artery and branches of the middle cerebral artery ipsilateral to the ischemic lesion did not cause significant changes in perfusion maps (22,23,25). In our study cohort, all of the pulmonary arteries were disease free; therefore our results are consistent with these findings. In the presence of arterial thrombus, the AIF has to be placed proximal to the clot otherwise first pass kinetics approximations are broken and this results in significant variability for the generated perfusion maps (23,25).
Additional important observations from this study relate to the influence of gravity on PBF gradients. The PBF was notably enhanced in the posterior-basal segments of the lung. This was due to the supine position of the pigs and has been previously shown in MR perfusion studies of a swine model (26), CT perfusion in humans (10), and MRI perfusion in humans (18). Interestingly, the absolute values of PBF in our pigs had a large variation within subjects with a range of 243–953 mL/100 mL/min. This wide range of values has been previously seen in the swine model (26) and is known to be up to four times larger than human PBF data (10,27). The difference in PBF values between swine and humans is mainly attributable to differences in cardiac output due to the higher heart rates, resulting in higher cardiac output and hence larger PBF in pigs. Differences in lung physiology between pigs and humans may also influence the increased variability in PBF.
There are a few limitations in our study. The study cohort included 3 pigs and each pig had a total of 18 DPCT scans rather than performing 54 scans in individual pigs. This approach may introduce statistical bias. However, the waiting time of 10 minutes between DPCT scans allowed the washout of contrast in the lung parenchyma between studies. The reproducibility and consistency of the results suggests that each DPCT scan can be treated as independent and it is not necessary to involve a larger number of pigs for this purpose. Lastly, the perfusion maps were generated in disease free pulmonary arteries. Future work will determine the influence of emboli within the PT, RM or LM pulmonary arteries on perfusion maps generated during lung DPCT.
Conclusions
There is no significant difference in perfusion maps generated from lung DPCT with location of the AIF in the PT, RM or LM pulmonary arteries. These findings simplify the approach to dynamic perfusion analysis of the lung and increase the potential utility of conventional systems to perform lung DPCT.
Acknowledgements
This research was partially supported by the University of Toronto Faculty of Medicine Dean’s Fund New Staff Grant Program and Toshiba Medical Systems.
Footnote
Conflicts of Interest: The authors have no conflicts of interest to declare.
References
- Snyder KV, Mokin M, Bates VE. Neurologic applications of whole-brain volumetric multidetector computed tomography. Neurol Clin 2014;32:237-51. [PubMed]
- d'Esterre CD, Fainardi E, Aviv RI, Lee TY. Improving acute stroke management with computed tomography perfusion: a review of imaging basics and applications. Transl Stroke Res 2012;3:205-20. [PubMed]
- Tong E, Komlosi P, Wintermark M. One-stop-shop stroke imaging with functional CT. Eur J Radiol 2015;84:2425-31. [PubMed]
- Miles KA. Perfusion CT for the assessment of tumour vascularity: which protocol? Br J Radiol 2003;76:S36-42. [PubMed]
- García-Figueiras R, Goh VJ, Padhani AR, Baleato-González S, Garrido M, León L, Gómez-Caamaño A. CT perfusion in oncologic imaging: a useful tool? AJR Am J Roentgenol 2013;200:8-19. [PubMed]
- Ohno Y, Nishio M, Koyama H, Fujisawa Y, Yoshikawa T, Matsumoto S, Sugimura K. Comparison of quantitatively analyzed dynamic area-detector CT using various mathematic methods with FDG PET/CT in management of solitary pulmonary nodules. AJR Am J Roentgenol 2013;200:W593-602. [PubMed]
- Kim SH, Kamaya A, Willmann JK. CT perfusion of the liver: principles and applications in oncology. Radiology 2014;272:322-44. [PubMed]
- Kandel SM, Meyer H, Boehnert M, Hoppel B, Paul NS, Rogalla P. How influential is the duration of contrast material bolus injection in perfusion CT? evaluation in a swine model. Radiology 2014;270:125-30. [PubMed]
- Kandel S, Kloeters C, Meyer H, Hein P, Hilbig A, Rogalla P. Whole-organ perfusion of the pancreas using dynamic volume CT in patients with primary pancreas carcinoma: acquisition technique, post-processing and initial results. Eur Radiol 2009;19:2641-6. [PubMed]
- Sun H, Gao F, Li N, Liu C. An evaluation of the feasibility of assessment of volume perfusion for the whole lung by 128-slice spiral CT. Acta Radiol 2013;54:921-7. [PubMed]
- Zussman B, Jabbour P, Talekar K, Gorniak R, Flanders AE. Sources of variability in computed tomography perfusion: implications for acute stroke management. Neurosurg Focus 2011;30:E8. [PubMed]
- Sanelli PC, Lev MH, Eastwood JD, Gonzalez RG, Lee TY. The effect of varying user-selected input parameters on quantitative values in CT perfusion maps. Acad Radiol 2004;11:1085-92. [PubMed]
- Calamante F. Arterial input function in perfusion MRI: a comprehensive review. Prog Nucl Magn Reson Spectrosc 2013;74:1-32. [PubMed]
- Calamante F, Gadian DG, Connelly A. Delay and dispersion effects in dynamic susceptibility contrast MRI: simulations using singular value decomposition. Magn Reson Med 2000;44:466-73. [PubMed]
- Kamath A, Smith WS, Powers WJ, Cianfoni A, Chien JD, Videen T, Lawton MT, Finley B, Dillon WP, Wintermark M. Perfusion CT compared to H(2) (15)O/O (15)O PET in patients with chronic cervical carotid artery occlusion. Neuroradiology 2008;50:745-51. [PubMed]
- Miles KA, Griffiths MR. Perfusion CT: a worthwhile enhancement? Br J Radiol 2003;76:220-31. [PubMed]
- Wildberger JE, Klotz E, Ditt H, Spüntrup E, Mahnken AH, Günther RW. Multislice computed tomography perfusion imaging for visualization of acute pulmonary embolism: animal experience. Eur Radiol 2005;15:1378-86. [PubMed]
- Ohno Y, Hatabu H, Murase K, Higashino T, Kawamitsu H, Watanabe H, Takenaka D, Fujii M, Sugimura K. Quantitative assessment of regional pulmonary perfusion in the entire lung using three-dimensional ultrafast dynamic contrast-enhanced magnetic resonance imaging: Preliminary experience in 40 subjects. J Magn Reson Imaging 2004;20:353-65. [PubMed]
- Suga K, Kawakami Y, Iwanaga H, Tokuda O, Matsunaga N. Automated breath-hold perfusion SPECT/CT fusion images of the lungs. AJR Am J Roentgenol 2007;189:455-63. [PubMed]
- Neeb D, Kunz RP, Ley S, Szábo G, Strauss LG, Kauczor HU, Kreitner KF, Schreiber LM. Quantification of pulmonary blood flow (PBF): validation of perfusion MRI and nonlinear contrast agent (CA) dose correction with H(2)15O positron emission tomography (PET). Magn Reson Med 2009;62:476-87. [PubMed]
- Alford SK, van Beek EJ, McLennan G, Hoffman EA. Heterogeneity of pulmonary perfusion as a mechanistic image-based phenotype in emphysema susceptible smokers. Proc Natl Acad Sci U S A 2010;107:7485-90. [PubMed]
- Bisdas S, Konstantinou GN, Gurung J, Lehnert T, Donnerstag F, Becker H, Vogl TJ, Koh TS. Effect of the arterial input function on the measured perfusion values and infarct volumetric in acute cerebral ischemia evaluated by perfusion computed tomography. Invest Radiol 2007;42:147-56. [PubMed]
- Ferreira RM, Lev MH, Goldmakher GV, Kamalian S, Schaefer PW, Furie KL, Gonzalez RG, Sanelli PC. Arterial input function placement for accurate CT perfusion map construction in acute stroke. AJR Am J Roentgenol 2010;194:1330-6. [PubMed]
- Nakano S, Gibo J, Fukushima Y, Kaira K, Sunaga N, Taketomi-Takahashi A, Tsushima Y, Mori M. Perfusion evaluation of lung cancer: assessment using dual-input perfusion computed tomography. J Thorac Imaging 2013;28:253-62. [PubMed]
- Chiu FY, Teng MM, Kao YH, Chen YD, Luo CB, Chang FC, Guo WY, Chang CY. Selection of arterial input function for postprocessing of cerebral ct perfusion in chronic unilateral high-grade stenosis or occlusion of the carotid or middle cerebral artery. Acad Radiol 2012;19:8-16. [PubMed]
- Risse F, Ley S, Ley-Zaporozhan J, Kuder TA, Kunz RP, Puderbach M, Kauczor HU, Semmler W. Quantification of 3D pulmonary perfusion in pigs using a prebolus technique and singular value decomposition with a blockcirculant deconvolution matrix. Proc Intl Soc Mag Reson Med 2007;15:2763.
- Ohno Y, Koyama H, Matsumoto K, Onishi Y, Nogami M, Takenaka D, Yoshikawa T, Matsumoto S, Sugimura K. Dynamic MR perfusion imaging: capability for quantitative assessment of disease extent and prediction of outcome for patients with acute pulmonary thromboembolism. J Magn Reson Imaging 2010;31:1081-90. [PubMed]

