

Contrast enhancement of medical images using a new version of the World Cup Optimization algorithm
Introduction
Today’s modern world allows digital images to be downloaded and stored (1). To get better results, it is sometimes necessary to make some improvements in these images (2-5). These changes follow three main goals: processing, analyzing, and understanding the image (3,6-8).
For this reason, computer image processing systems have been developed to allow these actions to be performed more quickly and accurately. In these systems, there are four major processes: preprocessing, image quality upgrade, image conversion, and image categorization and analysis (1,9).
One of the most critical duties in the image processing and the machine vision is contrast enhancement of the input image (10). This batch of processes is purely for improving and enhancing image clarity so that a better understanding of the images can be obtained. The main reason behind this is that if the input image has low quality and contrast, the next processing steps like image segmentation, feature extraction, and image classification fail. For example, the quality of the performance of preprocessing methods such as image enhancement will have a direct impact on any processing in the next steps. Therefore, high-performance image enhancement techniques can significantly enhance the overall system performance (11,12).
Image contrast enhancement is the process of increasing the contrast quality of the intensity variations in the considered image. One of the most useful applications of the image contrast enhancement is its usage in medical imaging.
Also, because of its simplicity in function and mobility, it can be used as a portable system for medical applications. However, because of the low contrast of the captured images from portable phones, it usually has low image quality. Figure 1 shows some examples of low-quality medical images.

Medical imaging has a significant impact on medical applications, and since the quality of healthcare directly affects the quality of living of a patient, using the images for improving the performance of the medical specialists is an important issue.
Medical images are one of the most critical issues because of their great importance and sensitivity in diagnosing various medical problems. While pathology is a good way for recognizing cancerous tissue, the “noninvasive” and “less time-consuming” features in medical imaging cancer detection have led to pathology being surpassed by imaging in the medical field. The use of medical images allows for the early identification of most cancers in their early stages, which increases the chances of treating patients (13).
Medical images have different tissue contrast quality. There are just a few number of medical images in some applications that have enough quality for processing; e.g., the contrast between bone and background in conventional CT images are usually high, or conventional radiography provides higher resolution for bone X-rays. However, in most cases, the contrast available is low. For example, CT can generate much more detailed images of the soft tissues which can be affected by different noises and disturbances. These imaging systems also have a different quality in different applications. For instance, the MR image of the knee has a large number of low-intensity background pixels; i.e., a dark background hardens any post-processes on the images. Alternatively, the contrast in a brain tumor is low, which hardens the segmentation part.
To improve the visual aspects of this condition, image enhancement can be used. Generally, image enhancement is the first necessary step in medical image analysis. Currently, there are different types of medical image contrast enhancement (14,15). The application of the Gamma correction for the contrast enhancement of the medical images is widespread; the main reason for this is its ability in preserving the brightness (16-19). Other methods for medical image enhancement include wavelet-based enhancement (20), histogram equalization (HEs) (21), 2D empirical mode decomposition (22), decorrelation stretching methods (23), PDE-based (24), and median filter-based methods (25).
Most of these methods fail in their duty to provide high-quality images, especially hard condition cases like satellite captured images and images captured by night vision.
For example, wavelet-based enhancement cannot simultaneously improve all parts of an image properly, and it is also difficult to automate the image enhancement procedure with them. HEs methods have the problem of losing information in the histogram of the input image. Histogram equalizations have also several types of image artifacts.
In order to make high-frequency information based on a 2D empirical mode decomposition to show clearer and more prominently, linear gray transformation needs to be included. Decorrelation stretching methods and PDE-based methods are a much more complicated and time-consuming process. Meanwhile, the median, filter-based methods need to find a proper filter parameter strictly dependent on the type of image.
In this study, for the purpose of improving the efficiency of image enhancement, a newly improved optimization algorithm has been employed along with the classic methods.
In section 3, after introducing the primary conception of the Gamma correction, an updated version of the newly introduced World Cup Optimization (WCO) is introduced. Section 4 presents the general structure of the proposed method for the contrast enhancement of the medical images. Experimental results and performance analysis of the system have been given in section 5, and the paper is concluded in section 6.
Literature review
There are several methods which have been developed to improve the contrast of an image (26-29). One of the popular methods for image enhancement is image HE (30).
Although, HE-based image enhancement methods give poor results due to reasons such as the loss some information during the contrast enhancement and over-enhancement for the frequent gray levels (31).
To solve this problem, some different methods have been innovated including DWT-based image enhancement (32), the AVHEQ-based method (32), the adjacent-blocks-based modification method (33), maximum intensity coverage (34), and recursive HE algorithm (35).
For instance, Lidong et al. proposed another method based on an adaptive HE and DWT to improve and cover the HE image contrast enhancement problems (32). However, this was faced with noise enhancement and contrast overstretching problems. Their method included three step process and the final results showed that the proposed method gives a good output in detail.
Two recursive histogram improvements (35) called R-ESIHE and RS-ESIHE procedures have also been proposed. The presented procedures were efficient for low-level quality in low light conditions such as night vision images and underwater sequences. Final results showed that the proposed approach could cover a large part of the above problems of the original HE.
Generally, however, HE-based methods are not adaptive, which makes them unsuitable in some contrast enhancement cases. Gamma correction, unlike HE-based methods, allows the designer to operate in a linear intensity space. This linear space is more intuitive than a non-linear space. Linearity is also required for anti-aliasing and compositing. Hardware tables allow gamma correction to be efficiently performed in real-time.
Methods
The conception of the Gamma correction
Due to the camera quality limitations, most of the captured images are of low quality; therefore, in some cases, they cannot present the principal features of the objects. This drawback is usually known as Gamma distortion.
In most cases, using classical methods like HE cannot compensate for this deficit.
A proper method for eliminating this kind of distortion from the captured devices is to use Gamma correction methods. This method is a histogram-based technique for improving the quality of the image contrast based on a tunable parameter, Gamma (γ) (36).
This method is a nonlinear filter which adjusts the image brightness based on the predefined Gamma parameter. For a considered image, the general form transformed gamma correction (TGC) is calculated as follows:

where, Ii describes the intensity of the image, IM describes the maximum value of the intensity in the input image, and γ is a tunable parameter in the interval [0,∞).
In the equation above, the Gamma parameter changes the intensity of the pixel in the image.
If γ=1, it does not perform any changes on the input image. However, if γ<1, it enhances the brightness, and if γ>1, it decreases the image brightness (37); i.e., the selection of the Gamma directly affects the image intensity.
Hence, it is essential to select an optimal value for the Gamma parameter.
In 2011, Haasanpour proposed a method based on a support vector machine for automatic selection of the Gamma value (38); the method requires training data for doing the task; however, the input image in this method should belong to the trained dataset; if this is not the case, the method fails in the proper selection of the Gamma value.
In 2014, Rani et al. presented a Gamma-based image contrast enhancement method. This technique was based on an improved version of the adaptive Gamma correction weighted distribution (AGCWD) method, which separates the image histogram recursively, and then performs adaptive gamma correction on the processed image (39).
Generally, gamma value selection is directly dependent on the probability density function (PDF) and the cumulative distribution function (CDF); one objection to this method is that the CDF is too affected by noise (3,6,40,41).
This problem may produce some artifacts by finding the gamma value based on PDF and CDF, leading to under enhancement and over-enhancement.
As explained above, the optimal selection of the Gamma value is the most significant part of image quality improvement based on Gamma correction. Recently, meta-heuristic algorithms have been used for achieving the optimal value for the gamma parameter with different techniques (42). For instance, Kwok et al. presented a contrast enhancement algorithm by considering a trade-off between intensity quality and the contrast quality (43). The method is then turned into an optimization algorithm and solved by particle swarm optimization algorithm. In 2016, Dhal et al. presented a meta-heuristic-based method based on two types of the Firefly algorithm (FA) for image contrast enhancement (44). They considered different features of the image, like contrast and energy, to generate the objective function and apply the optimization algorithm. The objective of this paper was to maximize the objective function to achieve an enhanced image. In 2010, Hoseini et al. proposed a hybrid method based on simulated annealing, genetic algorithm, and ant colony optimization methods for the image contrast enhancement (45). In this study, a new optimization-based methodology is introduced to contrast enhancement based on Gamma correction of the gamma distortion. The main idea focuses on the entropy maximization of the image so that in addition to enhancing the image contrast, the edges are also preserved.
Basic WCO algorithm
The crux of optimization is finding the best acceptable solution for a given problem in light of its constraints and other requirements. There may exist different solutions for a single problem which can be compared, so the best of them can be selected according the needs of a pre-defined function—called the objective (cost) function.
Meta-heuristics algorithms are a kind of optimization algorithm that are inspired by nature, physics, and human societies to solve many types of optimization problems (46-48). Optimization algorithms are usually used in combination with other algorithms to reach the optimal solution or escape from the local optimal solution. In recent years, the most promising research in the field has been finding solutions based on nature; these methods have similarities with social or natural systems. Their application is based on continuous inventive techniques that have excellent results in solving complexity class problems (NP-Hard).
Of late, several types of meta-heuristics have been introduced which are based on different natural phenomena, for instance, Shark Smell Optimization (49), WCO algorithm (46), quantum invasive weed optimization (48), artificial bee colony optimization algorithm (50), etc.
Recently, a new optimization algorithm based on the competitions in the FIFA world cup has been introduced by Razmjooy et al., which is called the WCO algorithm. After introducing this algorithm, its capability was analyzed for different applications such as image segmentation, neural network optimization, optimal control of DC motor speed, optimal designing of PID controller for AVR Systems, ordinary differential equations, and optimal control of a robust power system stabilizer (9,46,51-54).
As described before, the primary motivation of this algorithm is inspired by the FIFA world cup, which is a global football competition held every 4 years. This competition ends when a team wins the final and lifts the championship trophy.
One of the most important advantages of the WCO algorithm is that it includes both exploration and exploitation (55). This algorithm starts with a random vector solution that includes some competitive teams and is called “teams”:
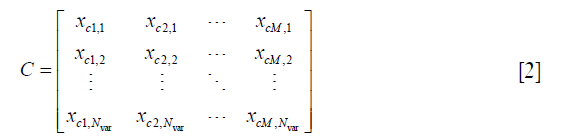
where C describes the continent, Nvar describes the number of variable dimensions, M describes the number of continents and xi,j is the ith team of the jth country.
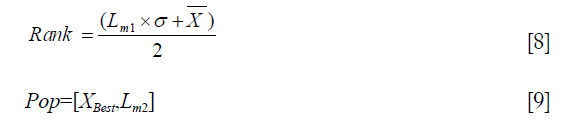
Rating of the teams in this study is based on a parameter called Rank (fr), which is obtained by the method below:
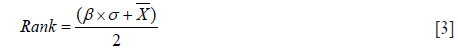
where, β is an adjustable parameter in the range [0, 1] which gives valuation to the mean value and the standard deviation value as follows:
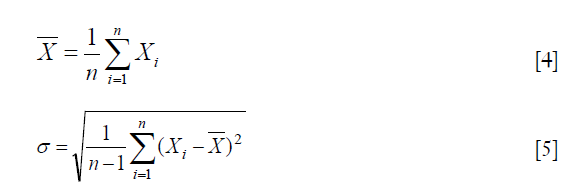
where, n describes the number of teams,  and σ and are the average and the standard deviation of the , respectively.
Another critical parameter in WCO is called “Play-Off”. The Play-Off parameter in the algorithm is directly inspired by the playoff rule in the real FIFA competition in which third-place teams attempt to advance to the next stage by beating another opponent.
The two strongest teams in each group advance to next level of competition, and the rest of the teams are eliminated. However, the third-place team in each group has a second chance to qualify for the next round of competition (Play-Off). The playoff has a direct impact on the Rank parameter for the next iterations. This parameter is generated as follows:

where, describes a N×M matrix that describes the new competition teams, XRand is a random value, and XBest can be obtained by the following formula:
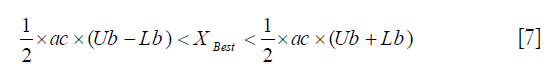
where, Lb and Ub describe the lower and the higher limitations for the problem constraints, and ac describes the accuracy parameter in the range [Lb, Ub].
In some studies, the authors have worked on an improved version of different algorithms to achieve a better solution from the original versions; these include the improved artificial bee colony optimization algorithm (56), improved invasive weed optimization algorithm (57), improved whale optimization algorithm (58) etc.
Improved World Cup Optimization algorithm based on logistic map (LMWCO)
In this study, the logistic mapping function has been utilized for improving the system convergence. The logistic mapping function is a chaotic parameter which has recently been used several times in different applications (59-64).
In terms of Chaos theory, all of the complex systems have a deterministic formulation and they seem like random values. Based on Xiang et al.’s work, logistic mapping has two critical advantages, including high convergence and high speed (65).
Therefore, we can utilize these two features for improving the diversity of the teams’ population to escape from the local optimal point. In this research, the Rank parameter {Eq. [3]} and the Play-Off parameter {Eq. [6]} are improved and changed into the following formulas:
where, Lm1 and Lm2 are Logistic Mapping functions
The following equation can evaluate the Logistic Mapping function:
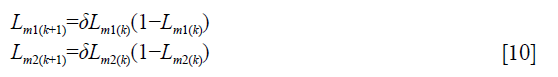
where k describes the iteration number, δ describes a tunable parameter in the interval δ [0,1]−{0.25, 0.5, 0.75}, and Lm1(0)[0,1] is the initial random number.
It can be proven that δ=4 results in the chaos state (65).
It is essential to know that the stopping criterion in this algorithm is the maximum number of evaluations (total number of iterations) of the objective function. In the case study, this iteration is set to 20.
Figure 2 shows the flowchart diagram of the presented improved WCO algorithm.

The proposed contrast enhancement method
The main objective of this research is to utilize the proposed LMWCO algorithm as a multi-objective optimization system for medical image quality enhancement based on the Gamma correction theory.
There are different kinds of manual and automatic methods for selecting the value of the γ parameter (12,36,66). For example, Rani and Kumar proposed an adaptive method for selection of the γ parameter based on PDF such that γ=1−CDFm where CDFm is a modified CDF (39). Salas et al. proposed another method based on the mean value of the image such that γ=2(μ−127.5/127.5) where μ is the mean value of the image (67).
Each of the methods above has its shortcomings. The main advantage of the proposed method here is that we select a cost function based on a designed cost function to achieve both probability density distribution and high detail based on edge information. In the proposed method, we attempt to find the best optimal value for the Gamma parameter to achieve a proper enhanced image. For a better understanding, consider Figure 2; as is clear from the figure, the method is based on the global optimization of the Gamma parameter based on a new, improved, multi-objective algorithm.
In this research, two cost functions have been utilized for contrast enhancement, which is illustrated in the following equations:
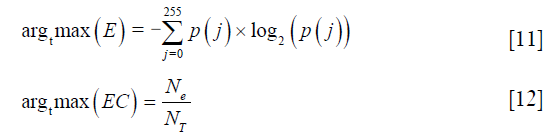
where, describes the probability occurrence for the jth intensity of the improved image, Ne describes the number of detected edge pixels obtained using the Deriche edge detection, and NT describes the number of all the pixels in the improved image. It is essential to know that the Deriche edge detection is an extended, multi-step, and optimal version of the Canny edge detection algorithm which is used for two-dimensional image edge detection and which filters out the pixelization and the high-frequency noise from the image by linking adjacent edges into long, continuous, and smooth contours. This allows the edge map to reflect the dominant structures in the image (68).
From the above two equations, it is clear that we have two cost functions for optimization; i.e., the problem is a multi-objective optimization algorithm. These kinds of problems are usually performed by a method called Pareto dominance. A critical drawback of this algorithm is its computational complexity. In this research, a linear combination of the described functions is utilized for optimization. Therefore, the general cost function is achieved as the following formula:
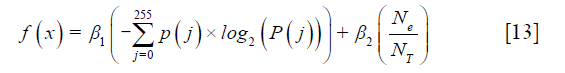
Because of the importance of both functions, the same valuation is selected for the coefficients; i.e., β1=β2=0.5.
β1 and β2 provide a trade-off between the edge details and the probability occurrence for enhancing the image contrast. In our database, an equal trade-off provides a good result for the images. However, β1 and β2 are two weighed constants, which can be changed for different purposes.
Figure 3 shows the whole structure of the presented methodology.

In the presented technique, initial teams, Play-off, and Rank are randomly selected. After initializing, the value for each team is employed for Gamma distortion correction, and then the proposed method is performed. In this technique, the edge content and the entropy are evaluated for each iteration. In the optimized method here, after competing with other teams, the best team is considered as the global optimum. In each iteration, if the cost function has a higher value than the previous iteration, the Gamma value is replaced by the previous value. This technique continues until the termination criteria for the presented LMWCO algorithm are satisfied, and the optimal value for Gamma is taken. In this study, the termination criterion is that if the best solution stays the same for 10 iterations, the algorithm should be stopped.
Results and discussion
To evaluate the proposed method’s efficiency, it was tested against other state-of-the-art methods including BBHE (21), PSO (69), GAPSO (70), BPDFHE (71), and CLAHE (72). The simulation was performed based on the MATLAB R2017b platform, and the system configuration was an Intel® Core™ i7-4720 HQ CPU@2.60 GHz with 16 GB RAM. For the comparison, different indexes including edge content, entropy, contrast, CNR, EME, WPSNR, and homogeneity, were employed.
The region of interest (ROI) in images was manually classified by a dermatologist. These were considered as desired values, and we validated our optimized method by comparing the results with the manually segmented results.
The parameters values for the proposed Logistic Map based on the WCO algorithm are illustrated in Table 1. Since a higher number of teams can increase the convergence speed of the optimization process, 100 teams were selected to form the competition.

Full table
In the presented technique, the initial value of the logistic map coefficient (δ) is selected randomly, but after the initializing, the following values for this coefficient have a deterministic relation. Initially, the values of the teams are selected randomly. The next solution in this research presents the Gamma value; if this value is less than 1, it increases the image brightness, and if this value is greater than 1, it decreases the image brightness (73).
Therefore, the low bound and the high bound in this problem for the algorithm are selected as [LB, UB]=[0, 2]. Here, the termination criterion is reached if the best solution stays the same for 10 iterations. Figure 4 shows the images which were analyzed in this study for illustrating the efficiency of the system in comparison to different state-of-the-art methods. As can be see, we utilized different kinds of cancers to show the generality of the proposed system.

In the following, image performance analysis for the contrast enhancement is analyzed to show how well the images have been enhanced.
In this study, 5 performance metrics including contrast, measure of enhancement (EME), contrast-to-noise ratio (CNR), weighted peak signal-to-noise ratio (WPSNR), and homogeneity were employed.
A single contrast or homogeneity might not be enough to determine the textural features of the image. For instance, a single 0° offset may have not any impact on the texture with a 90° orientation. This led us to use multiple offsets for them. We needed an offsets array to generate multiple features which determine pixel relationships for varying direction and distance. In this study, contrast and homogeneity employed offsets to define in-pixel relationships of varying direction and distance, which were taken in four 4 and 30 distances as follow:
Offsets=
[0 1;0 2;0 3;…;0 30] Horizontal direction (0°)
[−1 1;−2 2;−3 3;…;−30 30] Right down direction (45°)
[−1 0;−2 0;−3 0;…;−30 0] Vertical direction (90°)
[−1 −1;−2 −2;−3 −3;…;−30 −30] Left down direction (135°)
Because it is unclear which angle of offset provides the highest value for the texture measures, the mean value of the contrast and the homogeneity was evaluated.
Contrast
This measure is a statistical characteristic which results in the difference of value between intensity and its neighbor for the input image.
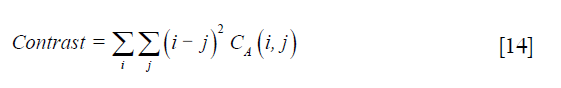
where CA(i,j) describes the number of coappearances for the intensity levels i and j.
CNR
The characteristics of this measure are like the signal-to-noise ratio (SNR) with one difference: in this measure, a term is subtracted from the solution before presenting the ratio. This feature becomes significant, especially for bias in the image [6]. The formula of the CNR is illustrated below:
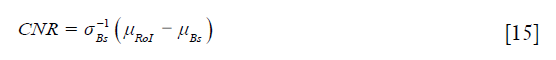
where describes the global noise for the background and describes the standard deviation of the pixel values out of the considered ROI, μRoI describes the mean value of the considered defined subject in the ROI, and μBs is the average of the background image in the objecting neighbor.
The EME
The third metric is the EME. This measure was first presented by Agaian et al. (74). They introduced an absolute score for the image based on the contrast of the image by the Fechner’s Law relating contrast to observed intensity.
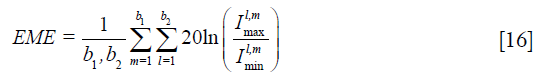
where, the image includes two-fold blocks of b1 and b2, and  and
and  are the minima and the maximum values of the pixels in the blocks of the processed image.
WPSNR
This metric is a measure based on the human visual system (HVS) which has better results than the PSNR. WPSNR employs the redundancy rule of the human eye against the high-frequency cases in images. The formula for this measure is presented below.
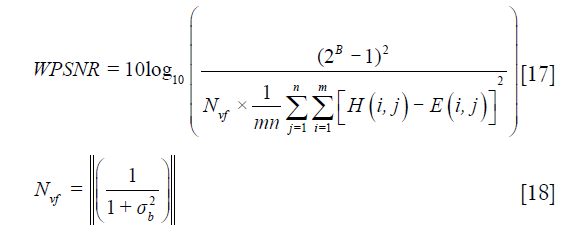
where,  describes the standard deviation for an 8×8 block of pixels and
  describes the normalization function utilized for normalizing the Nvf in the interval [0, 1]—the more value for WPSNR, the higher the quality of the enhanced image.
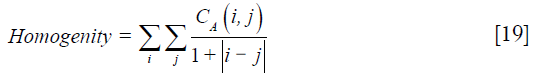
Homogeneity
The last measure in this study is homogeneity. Homogeneity determines the likeliness of the image intensities in the image. Therefore, high values for the homogeneity indicates a broader region for the homogeneity and a higher quality of image. This measure can be calculated as follows:
Performance analysis
The two main features for the performance analysis in this study are edge content and entropy. As observed previously, these two features have been employed as a multi-objective function to apply the optimization process and acquire the best value for the Gamma for achieving the optimal value and the best-enhanced image.
Indeed, using the entropy parameter helps to analyze the information level of the obtained images; in this parameter, whenever its value is higher, the contrast of the image will be higher.
Additionally, the edge content parameter is employed to analyze the content level details of the achieved images. Table 2 illustrates the achieved values of the edge content and the entropy for the analyzed medical images.

Full table
From Table 2, it can be observed that using the presented method has a greater and more extensive ability for improving contrast enhancement when compared to the other methods. The only method which does a slightly better job in skin cancer and for edge content is CLAHE. However, it is essential to know that a trade-off between the edge content and the entropy is required to choose the best method. In Figure 5, co-occurrence matrix offset in 4 directions and 4 distances is presented.

The optimal values of Gamma for medical images, including skin cancer, brain tumor, liver cancer, and breast cancer, are illustrated in Table 3.

Full table
Simulation results for the analyzed images are shown in the Figures 6-9.


From Figure 6, it can be seen that the BBHE method is inapplicable for skin cancer due to its inappropriate histogram.
The obtained results by BPDFHE and PSO are suboptimal because of the gathering in their histogram in the left-hand side, which indicates a dark intensity in their images. The results of the GAPSO are better than the above methods, and have a distributed histogram, but the ROI for skin cancer (i.e., melanoma) has a very weak brightness which makes the subsequent steps fail in terms of cancer detection and the other image processing operations. However, the CLAHE method here shows better results than the others and is an excellent method. However, our proposed method achieves an ideal histogram of two peak values, thus indicating its superiority over the CLAHE method, especially during the thresholding process.
Figure 7 shows the experimental results of the brain tumor. In this example, the BPDFHE has the worst histogram and consequently, the worst contrast. The results of PSO and GAPSO are close to each other, as their histograms both gather to the right-hand side, which means they increase the brightness of the image with no useful results. The results for the BBHE show the opposite results of the prior methods; it gathers towards the left-hand side of the histogram bar. From these findings, the proposed method, along with the CLAHE method, has the best results for the brain tumor.
Figure 8 shows the results of the methods for the liver tumor. Looking at the figure, it is clear that BPDFHE and BBHE have insufficient results for this case study, as their histograms are shifted to the right-hand side and left-hand side, respectively. PSO has comparatively better results for the image than the two methods above, but the proposed method, GAPSO, and the CLAHE, have the most suitable results for this case, with the histogram of the presented method and the CLAHE method being superior to GAPSO for image thresholding purposes.
The final result concerns breast cancer processing. As is evident from Figure 9, BPDFHE is the worst method this case, while PSO’s results are not satisfactory. In addition, the histogram of the BBHE has low brightness, and is consequently not very suitable for image processing applications. PSO, GAPSO, and the CLAHE nearly have better results for the subsequent image processing steps, but as can be seen, the results of the presented method are considerably appealing.
Table 4 illustrates more analysis of the presented optimized method in comparison to the aforementioned methods.

Full table
From the table, it is clear that in all considered cases, the contrast of the presented method has the best results, and the contrast of the BPDFHE has the worst results.
From the table, the higher values for WPSNR, CNR, homogeneity, and EME in the proposed method for all the examples are clear. As explained before, a higher value for these measures corresponds to a higher suitability in brightness of the image.
A comparison of the executed time for the case studies is illustrated in Table 5. The processing time is based on an average value of 4 times of implementation. As seen in Table 5, for most of the test images, classic HE-based methods including BBHE, BPDFHE, and CLAHE provide less running time compared with modern optimization algorithms. This is because HE-based methods are not optimization solutions, and they do not need any repetitive solution for solving the contrast enhancement problem. However, as a result of this feature, they fail in more cases because they are not adaptive. In the following table, in the comparison of the proposed optimization algorithm with the other optimization algorithms, it is clear that the GAPSO has the worst results in terms of time. This is because of the genetic algorithm that needs more time for exploration. It is also clear that using the proposed algorithm has the best results in terms of time when compared with the other optimization algorithms.

Full table
An essential challenge for image enhancement methods in medical imaging is that the “important features” may become “invisible” or “distorted” by applying the enhancement method even if all the image-based contrast or quality has been improved.
So, for illustrating the quality of image enhancement after applying the proposed optimized method, a simple Fuzzy C-means (FCM) method has been applied to them (75). The results are shown in Figure 10.

As can be seen, using the proposed contrast enhancement not only keep the image details but also improve the image segmentation quality in some cases, especially in liver tumor image.
Conclusions
Image contrast enhancement is one of the most significant preprocessing operations in the image processing, and so failure in this stage cascades to failure of the subsequent image processing stages. Furthermore, medical images, because of their extreme importance in finding cancer, have high priority among different applications of image processing. In this paper, a new optimized method is proposed for improving the quality of the image enhancement in medical imaging applications. One of the appealing methods for contrast enhancement is Gamma correction, but finding the best value for the Gamma parameter is still a challenging subject. The primary purpose of the proposed method is to achieve the optimal value for Gamma by considering two essential functions: entropy and edge content. The optimization method here is an improved version of the WCO algorithm based on the logistic mapping method from Chaos theory. To evaluate the proposed method, it was applied to four different medical images and then compared with five state-of-the-art methods, with contrast, CNR, EME, WPSNR, and homogeneity being employed as the performance analysis measures. The results support the presented method as superior to each of the compared methods in the analysis of the dataset.
Acknowledgments
None.
Footnote
Conflicts of Interest: The authors have no conflicts of interest to declare.
References
- Razmjooy N, Ramezani M, Ghadimi N. Imperialist competitive algorithm-based optimization of neuro-fuzzy system parameters for automatic red-eye removal. International Journal of Fuzzy Systems 2017;19:1144-56. [Crossref]
- Moallem P, Razmjooy N, Ashourian M. Computer vision-based potato defect detection using neural networks and support vector machine. International Journal of Robotics and Automation 2013;28:137-45. [Crossref]
- Razmjooy N, Mousavi BS, Sadeghi B, Khalilpour M. editors. Image Thresholding Optimization Based on Imperialist Competitive Algorithm. 3rd Iranian Conference on Electrical and Electronics Engineering (ICEEE2011). 2011.
- Razmjooy N, Mousavi BS, Soleymani F. A real-time mathematical computer method for potato inspection using machine vision. Computers & Mathematics with Applications 2012;63:268-79. [Crossref]
- Razmjooy N, Mousavi BS, Soleymani F, Khotbesara MH. A computer-aided diagnosis system for malignant melanomas. Neural Computing and Applications 2013;23:2059-71. [Crossref]
- Razmjooy N, Mousavi BS, Khalilpour M, Hosseini H. Automatic selection and fusion of color spaces for image thresholding. Signal, Image and Video Processing 2014;8:603-14. [Crossref]
- Razmjooy N, Mousavi BS, Sargolzaei P, Soleymani F. Image thresholding based on evolutionary algorithms. International Journal of Physical Sciences 2011;6:7203-11.
- Moallem P, Razmjooy N. A multi layer perceptron neural network trained by invasive weed optimization for potato color image segmentation. Trends in Applied Sciences Research 2012;7:445. [Crossref]
- Razmjooy N, Sheykhahmad FR, Ghadimi N. A hybrid neural network–world cup optimization algorithm for melanoma detection. Open Med (Wars) 2018;13:9-16. [Crossref] [PubMed]
- García-Lamont F, Cervantes J, López-Chau A, Ruiz S. editors. Contrast Enhancement of RGB Color Images by Histogram Equalization of Color Vectors’ Intensities. International Conference on Intelligent Computing. Springer, 2018.
- Vartak A, Mankar V. Image Processing Techniques for Contrast Enhancement with Poor Lighting on Social and Medical Images. International Journal of Computer Applications 2015.123.
- Maini R, Aggarwal H. A comprehensive review of image enhancement techniques. arXiv preprint arXiv:10034053 2010.
- Catania AM, Sammut Scerri C, Catania GJ. Men's experience of their female partners’ breast cancer diagnosis, breast surgery and oncological treatment. J Clin Nurs 2019;28:1899-910. [Crossref] [PubMed]
- Deng D, Nikolov P, Arevalo H, Trayanova N. Optimal contrast-enhanced MRI image thresholding for accurate prediction of ventricular tachycardia using ex-vivo high resolution models. Comput Biol Med 2018;102:426-32. [Crossref] [PubMed]
- Mahajan PR, Vyavahare MA. Artefact Removal and Contrast Enhancement for Dermoscopic Images Using Image Processing Techniques. International Journal of Innovative Research in Electrical, Electronics Instrumentation and Control Engineering 2013;1:418-21.
- Wang W, Sun N, Ng MK. A variational gamma correction model for image contrast enhancement. Inverse Problems & Imaging 2019;13:461-78. [Crossref]
- Singh H, Kumar A, Balyan L, Lee HN. Fractional-Order Integration Based Fusion Model for Piecewise Gamma Correction Along With Textural Improvement for Satellite Images. IEEE Access 2019;7:37192-210.
- Jiang G, Wong C, Lin S, Rahman M, Ren T, Kwok N, Shi H, Yu YH, Wu T. Image contrast enhancement with brightness preservation using an optimal gamma correction and weighted sum approach. Journal of Modern Optics 2015;62:536-47. [Crossref]
- Singh H, Kumar A, Balyan L, Singh G. Swarm intelligence optimized piecewise gamma corrected histogram equalization for dark image enhancement. Computers & Electrical Engineering 2018;70:462-75. [Crossref]
- Yang Y, Su Z, Sun L. Medical image enhancement algorithm based on wavelet transform. Electronics Letters 2010;46:120-1. [Crossref]
- Kim YT. Contrast enhancement using brightness preserving bi-histogram equalization. IEEE transactions on Consumer Electronics 1997;43:1-8. [Crossref]
- Qin X, Liu S, Wu Z, Jun H. editors. Medical image enhancement method based on 2D empirical mode decomposition. 2008 2nd International Conference on Bioinformatics and Biomedical Engineering. 2008: IEEE.
- Harman J. editor. Using decorrelation stretch to enhance rock art images. American Rock Art Research Association Annual Meeting. 2005: sn.
- Salinas HM, Fernandez DC. Comparison of PDE-based nonlinear diffusion approaches for image enhancement and denoising in optical coherence tomography. IEEE Transactions on Medical Imaging 2007;26:761-71. [Crossref] [PubMed]
- Hantos N, Balázs P. editors. Image enhancement by median filters in algebraic reconstruction methods: an experimental study. International Symposium on Visual Computing. Springer, 2010.
- Sawant H, Deore M. A comprehensive review of image enhancement techniques. International Journal of Computer Technology and Electronics Engineering 2010;1:39-44. (IJCTEE).
- Kotkar VA, Gharde SS. Review of various image contrast enhancement techniques. International journal of innovative research in Science, Engineering and Technology 2013;2.
- Mustafa WA, Yazid H, Jaafar M. A systematic review: Contrast enhancement based on spatial and frequency domain. J Adv Res Appl Mech 2016;28:1-8.
- Kaur G, Bhardwaj N, Singh PK. An Analytic Review on Image Enhancement Techniques Based on Soft Computing Approach. Sensors and Image Processing. Springer, 2018:255-65.
- Singh K, Vishwakarma DK, Walia GS, Kapoor R. Contrast enhancement via texture region based histogram equalization. Journal of Modern Optics 2016;63:1444-50. [Crossref]
- Reddy PS, Singh H, Kumar A, Balyan L, Lee HN. editors. Retinal Fundus Image Enhancement Using Piecewise Gamma Corrected Dominant Orientation Based Histogram Equalization. 2018 International Conference on Communication and Signal Processing (ICCSP). 2018: IEEE.
- Lidong H, Wei Z, Jun W, Zebin S. Combination of contrast limited adaptive histogram equalisation and discrete wavelet transform for image enhancement. IET Image Processing 2015;9:908-15. [Crossref]
- Wang Y, Pan Z. Image contrast enhancement using adjacent-blocks-based modification for local histogram equalization. Infrared Physics & Technology 2017;86:59-65. [Crossref]
- Wong CY, Liu S, Liu SC, Rahman MA, Lin SCF, Jiang G, Kwok N, Shi H. Image contrast enhancement using histogram equalization with maximum intensity coverage. Journal of Modern Optics 2016;63:1618-29. [Crossref]
- Singh K, Kapoor R, Sinha SK. Enhancement of low exposure images via recursive histogram equalization algorithms. Optik 2015;126:2619-25. [Crossref]
- Huang SC, Cheng FC, Chiu YS. Efficient contrast enhancement using adaptive gamma correction with weighting distribution. IEEE Transactions on Image Processing 2013;22:1032-41. [Crossref] [PubMed]
- Niblack W. An introduction to digital image processing. Prentice-Hall Englewood Cliffs, 1986.
- Hassanpour H, Asadi AS. Image quality enhancement using pixel-wise gamma correction via SVM classifier. 2011.
- Rani S, Kumar M. Contrast enhancement using improved adaptive gamma correction with weighting distribution technique. International Journal of Computer Applications 2014.101.
- Sim K, Tso C, Tan Y. Recursive sub-image histogram equalization applied to gray scale images. Pattern Recognition Letters 2007;28:1209-21. [Crossref]
- Huang X, Jia Z, Zhou J, Yang J, Kasabov N. Speckle reduction of reconstructions of digital holograms using Gamma-correction and filtering. IEEE Access 2018;6:5227-35.
- Li B, Meng MQH. Wireless capsule endoscopy images enhancement via adaptive contrast diffusion. Journal of Visual Communication and Image Representation 2012;23:222-8. [Crossref]
- Kwok NM, Ha QP, Liu D, Fang G. Contrast enhancement and intensity preservation for gray-level images using multiobjective particle swarm optimization. IEEE Transactions on Automation Science and Engineering 2009;6:145-55. [Crossref]
- Dhal KG, Quraishi MI, Das S. Development of firefly algorithm via chaotic sequence and population diversity to enhance the image contrast. Natural Computing 2016;15:307-18. [Crossref]
- Hoseini P, Shayesteh MG. editors. Hybrid ant colony optimization, genetic algorithm, and simulated annealing for image contrast enhancement. IEEE Congress on Evolutionary Computation. 2010: IEEE.
- Razmjooy N, Khalilpour M, Ramezani M. A New Meta-Heuristic Optimization Algorithm Inspired by FIFA World Cup Competitions: Theory and Its Application in PID Designing for AVR System. Journal of Control Automation and Electrical Systems 2016;27:419-40. [Crossref]
- Ghadimi N, Akbarimajd A, Shayeghi H, Abedinia O. Two stage forecast engine with feature selection technique and improved meta-heuristic algorithm for electricity load forecasting. Energy 2018;161:130-42. [Crossref]
- Razmjooy N, Ramezani M. An Improved Quantum Evolutionary Algorithm Based on Invasive Weed Optimization. Indian J Sci Res 2014;4:413-22.
- Bagheri M, Sultanbek A, Abedinia O, Naderi MS, Naderi MS, Ghadimi N, editors. Multi-objective Shark Smell Optimization for Solving the Reactive Power Dispatch Problem. 2018 IEEE International Conference on Environment and Electrical Engineering and 2018 IEEE Industrial and Commercial Power Systems Europe (EEEIC/I&CPS Europe). 2018: IEEE.
- Rusdi NA, Yahya ZR, Roslan N, Muhamad W, Azman WZ. Reconstruction of Medical Images Using Artificial Bee Colony Algorithm. Mathematical Problems in Engineering 2018;2018.
- Bandaghiri PS, Moradi N, Tehrani SS. Optimal tuning of PID controller parameters for speed control of DC motor based on world cup optimization algorithm. Parameters 2016;1:2.
- Razmjooy N, Madadi A, Ramezani M. Robust Control of Power System Stabilizer Using World Cup Optimization Algorithm.
- Razmjooy N, Shahrezaee M. Solving Ordinary Differential Equations using World Cup Optimization Algorithm.
- Shahrezaee M. Image segmentation based on world cup optimization algorithm. Majlesi Journal of Electrical Engineering 2017;11.
- Mirjalili S. Dragonfly algorithm: a new meta-heuristic optimization technique for solving single-objective, discrete, and multi-objective problems. Neural Computing and Applications 2016;27:1053-73. [Crossref]
- Cao Y, Lu Y, Pan X, Sun N. An improved global best guided artificial bee colony algorithm for continuous optimization problems. Cluster Computing 2018.1-9.
- Zheng ZX, Li JQ. Optimal chiller loading by improved invasive weed optimization algorithm for reducing energy consumption. Energy and Buildings 2018;161:80-8. [Crossref]
- Xiong G, Zhang J, Shi D, He Y. Parameter extraction of solar photovoltaic models using an improved whale optimization algorithm. Energy Conversion and Management 2018;174:388-405. [Crossref]
- Kocarev L, Jakimoski G. Logistic map as a block encryption algorithm. Physics Letters A 2001;289:199-206. [Crossref]
- Yousefi M, Kamkar-Rouhani A, Carranza EJM. Application of staged factor analysis and logistic function to create a fuzzy stream sediment geochemical evidence layer for mineral prospectivity mapping. Geochemistry: Exploration, Environment, Analysis 2014;14:45-58. [Crossref]
- Liu B, Wang L, Jin YH, Tang F, Huang DX. Improved particle swarm optimization combined with chaos. Chaos, Solitons & Fractals 2005;25:1261-71. [Crossref]
- Mitić M, Vuković N, Petrović M, Miljković Z. Chaotic fruit fly optimization algorithm. Knowledge-Based Systems 2015;89:446-58. [Crossref]
- Yang D, Li G, Cheng G. On the efficiency of chaos optimization algorithms for global optimization. Chaos, Solitons & Fractals 2007;34:1366-75. [Crossref]
- Rim C, Piao S, Li G, Pak U. A niching chaos optimization algorithm for multimodal optimization. Soft Computing 2018;22:621-33. [Crossref]
- Xiang T, Liao X, Wong KW. An improved particle swarm optimization algorithm combined with piecewise linear chaotic map. Applied Mathematics and Computation 2007;190:1637-45. [Crossref]
- Chiu YS, Cheng FC, Huang SC. editors. Efficient contrast enhancement using adaptive gamma correction and cumulative intensity distribution. 2011 IEEE International Conference on Systems, Man, and Cybernetics. 2011: IEEE.
- Salas JGG, Lisani JL. Local color correction. Image Processing on Line 2011;1:260-80.
- Hemalatha R, Santhiyakumari N, Madheswaran M, Suresh S. Comparative Analysis Of Edge Detection Methods And Its Implementation Using UTLP Kit. i-Manager's Journal on Image Processing 2016;3:26.
- Kanmani M, Narsimhan V. An image contrast enhancement algorithm for grayscale images using particle swarm optimization. Multimedia Tools and Applications 2018;77:23371-87. [Crossref]
- Muniyappan S, Rajendran P. Contrast Enhancement of Medical Images through Adaptive Genetic Algorithm (AGA) over Genetic Algorithm (GA) and Particle Swarm Optimization (PSO). Multimedia Tools and Applications 2018.1-25.
- Wang Y, Chen Q, Zhang B. Image enhancement based on equal area dualistic sub-image histogram equalization method. IEEE Transactions on Consumer Electronics 1999;45:68-75. [Crossref]
- Sheet D, Garud H, Suveer A, Mahadevappa M, Chatterjee J. Brightness preserving dynamic fuzzy histogram equalization. IEEE Transactions on Consumer Electronics 2010;56:2475-80. [Crossref]
- Bovik AC. Handbook of image and video processing. Academic Press, 2010.
- Agaian SS, Panetta K, Grigoryan AM, editors. A new measure of image enhancement. IASTED International Conference on Signal Processing & Communication; 2000: Citeseer.
- Chuang KS, Tzeng HL, Chen S, Wu J, Chen TJ. Fuzzy c-means clustering with spatial information for image segmentation. Comput Med Imaging Graph 2006;30:9-15. [Crossref] [PubMed]

