

Glomerular filtration rate measured by 99mTc-DTPA Gates method is not significantly affected by the premature or delayed initiation of image acquisition
Introduction
Glomerular filtration rate (GFR) is defined as the amount of ultra-filtrate kidneys generate per unit of time, and is the best index of kidney function. There are several alternative methods for the measurement of GFR, in which the “gold standard” is performed via continuous infusion of inulin (1). The two- or multi-sample method is considered to be accurate in the determination of GFR and served in the current study as the reference method (2). Both the inulin and plasma sample methods are time consuming to perform, and are thus not applied in clinical practice.
Renal dynamic imaging with Tc-99m diethylenetriaminepentaacetic acid (DTPA), named the Gates’ method, is a simple method to determine GFR (3). The GFR is obtained by the net counts in the region of the kidneys starting between 2 and 3 min from time point of image acquisition. The accuracy of GFR is affected by the net counts directly. Ideally, the image acquisition is synchronized with the completion of radiotracer injection, and it is the same time point. However, in clinical practice, image acquisition occasionally occurs earlier or later than the completion of radiotracer injection. This leads to kidney net count distortion in the 2–3 min interval. It is unknown whether GFR is reliable with the non-synchronization of the radiotracer injection and image acquisition. Thus, in this study, we will explore the reliability of GFR when image acquisition and tracer injection are not synchronized.
Methods
Materials
The study was approved by the Ethic Committee of Chinese PLA General Hospital and written informed consent was obtained from each patient. A total of 218 volunteers were enrolled, including 91 males and 127 females (mean age 48.98±17.86 years, range 20 to 86 years).
Renal dynamic imaging
The participants underwent renal dynamic imaging with the injection of 99mTc-DTPA which was provided by the China Atomic Energy Technology Co., Ltd. The radioactive chemical purity was >95%. The renal dynamic imaging instrument was SIEMENS (ECAM) dual probe SPECT. Thirty min before the tracer injection, the participants drank 500–800 mL (10 mL/kg) of water. SPECT was counted for 10 seconds on the syringe which was filled with 99mTc-DTPA 1 mL (about 5 mCi, 185 MBq). With patients in the supine position, images were acquired posteriorly at 2 sec/frame for 30 frames and 15 sec/frame for 48 frames. After image acquisition, SPECT was counted for 10 seconds on the syringe after tracer injection, and the injection dose was then calculated (unit: cpm). The photo peak was selected at 140 keV with a 20% window. Based on the Gates method (3), the region of interest (ROI) over each kidney was assigned manually on the frame added after injection by selecting a crescent-shaped background ROI in the inferior regions of the kidneys (Figure 1).

Data processing and GFRGates calculation
The time-radioactivity count rate curve of the renal image and background was extracted. We took the peak time of blood perfusion phase as the new time origin (Figure 2) to ensure that all patients were unified on the time-radioactivity count rate curve. We moved the radioactivity curve on different time points to simulate premature, delayed, and synchronous image acquisition in relation to the completion of radiotracer injection, and then acquired different GFRGates. At the left and right renal blood perfusion phase peak time, the mean value was 19.79±5.18 s and 20.25±5.17 s, respectively. We moved the radioactivity curve on 9 time points to simulate premature (+20/+15/+10/+5 seconds), synchronous (0 seconds), and delayed (−20/−15/−10/−5 seconds) image acquisition in relation to the completion of tracer injection; we then acquired 9 GFRGates. The GFRGates was the sum of right and left GFR, and the Gates’ equation is as follows (3):
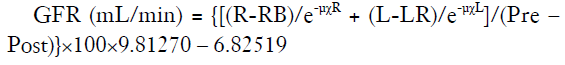

[pre, pre-count; post: post-count; R, right kidney counts; RB right kidney background counts; L, left kidney counts; LB, left kidney background counts; χR, right kidney depth; χL, left kidney depth; µ, attenuation coefficient of 99mTc in soft tissue (0.153/cm); e, constant].
Bios Du formula (4) was used to calculate body surface area, and the standardization of GFRGates (mL/min/1.73 m2) according to the standard surface area of 1.73 m2 was subsequently calculated.
Two-sample method for determination of GFR
We took the two-sample method as the reference standard to explore whether the 9 GFRGates were reliable. Before and after the injection, the activity of the tracer in the syringe was measured by a CRC-25R type radionuclide activity meter, and the corresponding measurement time was recorded. Three ml of venous blood was taken at 120 min (T1) and 240 min (T2) after tracer injection on the other side of the forearm, heparin anticoagulation for venous blood. The blood samples were centrifuged for 10 min (3,000 turn/min) and plasma was obtained. In a well counter (FJ-367), 1 mL plasma was counted for radioactivity for 60 seconds. The activity unit was converted into a counting unit. The measured data was imported into the following equation (5):

where D (cpm/mL) was the radioactive count of the injected tracer; T1 (min) was the first time to blood collection time after 120 min of tracer injection; P1 was the radioactive count of T1 in the plasma; T2 (min) was the second time to blood collection time after 240 min of tracer injection; P2 was the radioactive count of T2 in the plasma. GFRdt is the sum of the 2 kidney functions.
Statistical analysis
All data were expressed as mean ± standard deviation of the mean (SD). Correlation and Bland-Altman analysis were performed between GFRdt and GFRGates, and the correlation coefficient was calculated. Single factor variance was compared between the 9 GFRGates.
Results
Peak time distribution
Figure 3 shows the frequency distribution of the peak time of renal blood flow perfusion. The peak time of left and right renal perfusion was 19.79±5.18 and 20.25±5.17 s, respectively. All of them were nearly normal distribution. Four out of 218 cases were obviously not synchronous between tracer injection and image acquisition, and among them, 1 case’s peak time was on the origin and the other 3 cases peak time were more than 35 seconds.

Correlation analysis
There was a strong and significant correlation between GFRdt and GFRGates (Figure 4), but the GFRGate derived from −5, −10 and −15 s were better than the other time points; the correlation coefficient was 0.827 (P<0.01). The correlation coefficient between GFRdt and GFRGates derived from +20 s was the worst; the correlation coefficient was 0.802 (P<0.01). The correlation coefficients between GFRdt and GFRGates increased with the delay of acquisition time until −20 s.

Bland-Altman analysis
The consistency between GFRGates derived from +20 s and GFRdt was the worst, and the mean difference was −14.09±16.25 mL/(min·1.73 m2) (Figure 5). The consistency between GFRGates derived from –15 s and GFRdt was the best, and the mean difference was −9.22±15.29 mL/(min·1.73 m2) (Figure 5). The consistency between GFRdt and GFRGates improved concurrently with the delay of acquisition time until −20 s. There were no significant differences between the 9 GFRGates.

Discussion
Accurate assessment of renal function is very important for clinical practice. The Gates’ method has been widely used because it is simple, convenient, noninvasive, repeatable and less time-consuming. The accuracy of this method is affected by many factors, such as ROI (6,7), renal depth (8-12), and net injection dose (13).
From the Gates’ formula we can find the accuracy of GFR also affected by the net counts of the kidneys. Most commercial software programs make the measurement of GFR using the 2–3 min interval after the completion of radiotracer injection. Previous studies (12,13) have selected this time interval to assess renal function. The image acquisition should be performed immediately after the completion of radiotracer injection. From Figure 3, it is clear that even in the strict control of experimental conditions, there will be still significant non-synchronization between tracer injection and image acquisition (the outlying points). There are similar patterns of outlier (over 1.96 SD) in Figure 5. These outliers are caused by apparent non-synchronizations.
In this study, we took 9 time points to simulate premature, delayed, and synchronous image acquisition in relation to the completion of radiotracer injection. The results showed that there were no significant differences between the 9 GFRGates. This means GFRGates is reliable when the error between the image acquisition and the completion of radiotracer injection is in the range of ±20 s, and can thus be used in clinical practice. From Figure 2, we know that the time window is very short, and if the delay of the image acquisition is more than 20 s, the peak time of blood the perfusion phase will be lost. However, it is not clear whether GFR is reliable or not when the error is beyond 20 s. Therefore, the key point is to obtain the peak time of blood perfusion phase in clinic. As long as we can get the peak time of the blood perfusion phase, we can know whether GFR is reliable or not.
There are still some limitations in this study. First, the participants in this study only included adults, and further research is needed on children. Second, the GFR range of the subjects was 34.91 and 89.7 mL/(min·1.73 m2). Although the results are applicable to the patients with GFR between 34.9 and 189.7 mL/(min·1.73 m2), the applicability of the results for patients with GFR less than 34.9 mL/(min·1.73 m2) needs further study.
Conclusions
Non-synchronization of the radiotracer injection and image acquisition has no significant effect on the estimates of the GFR if the time difference between image acquisition and radiotracer injection is not more than 20 s; GFRGates is thus reliable and can be used in clinic.
Acknowledgments
None.
Footnote
Conflicts of Interest: The authors have no conflicts of interest to declare.
Ethical Statement: The study was approved by the Ethic Committee of Chinese PLA General Hospital and written informed consent was obtained from each patient.
References
- Peters AM. The kinetic basis of glomerular filtration rate measurement and new concepts of indexation to body size. Eur J Nucl Med Mol Imaging 2004;31:137-49. [Crossref] [PubMed]
- Itoh K. Comparison of methods for determination of glomerular filtration rate: Tc-99m-DTPA renography, predicted creatinine clearance method and plasma sample method. Ann Nucl Med 2003;17:561-5. [Crossref] [PubMed]
- Gates GF. Split renal function testing using Tc-99m DTPA. A rapid technique for determining differential glomerular filtration. Clin Nucl Med 1983;8:400-7. [Crossref] [PubMed]
- Du Bois D, Du Bois EF. A formula to estimate the approximate surface area if height and weight be known. 1916. Nutrition 1989;5:303-11. [PubMed]
- Chantler C, Barratt TM. Estimation of glomerular filtration rate from plasma clearance of 51-chromium edetic acid. Arch Dis Child 1972;47:613-7. [Crossref] [PubMed]
- Awdeh M, Kouris K, Hassan IM, Abdel-Dayem HM. Factors affecting the Gates' measurement of glomerular filtration rate. Am J Physiol Imaging 1990;5:36-41. [PubMed]
- Taylor A Jr, Thakore K, Folks R, Halkar R, Manatunga A. Background subtraction in technetium-99m-MAG3 renography. J Nucl Med 1997;38:74-9. [PubMed]
- Tonnesen KH, Mogensen P, Wolf H, Hald T, Munck O. Residual kidney function after unilateral nephrectomy. Pre- and postoperative estimation by renography and clearance measurements. Scand J Urol Nephrol 1976;10:130-3. [Crossref] [PubMed]
- Taylor A, Lewis C, Giacometti A, Hall EC, Barefield KP. Improved formulas for the estimation of renal depth in adults. J Nucl Med 1993;34:1766-9. [PubMed]
- Inoue Y, Yoshikawa K, Suzuki T, Katayama N, Yokoyama I, Kohsaka T, Tsukune Y, Ohtomo K. Attenuation correction in evaluating renal function in children and adults by a camera-based method. J Nucl Med 2000;41:823-9. [PubMed]
- Li Q, Zhang CL, Fu ZL, Wang FR. Measuring kidney depth of Chinese people with kidney dynamic imaging. Chin J Med Imaging Technol 2007;23:288-91.
- Ma G, Shao M, Xu B, Tian J, Chen Y. Establish New Formulas for the Calculation of Renal Depth in Both Children and Adults. Clin Nucl Med 2015;40:e357-62. [Crossref] [PubMed]
- Assadi M, Eftekhari M, Hozhabrosadati M, Saghari M, Ebrahimi A, Nabipour I, Abbasi MZ, Moshtaghi D, Abbaszadeh M, Assadi S. Comparison of methods for determination of glomerular filtration rate: low and high-dose Tc-99m-DTPA renography, predicted creatinine clearance method, and plasma sample method. Int Urol Nephrol 2008;40:1059-65. [Crossref] [PubMed]

