

Quality assurance of human functional magnetic resonance imaging: a literature review
Background
Functional magnetic resonance imaging (fMRI) is one of the most popular methods to probe and understand the human brain, offering a noninvasive way for the in vivo investigation of brain function (1). fMRI accounts for the growth of neuroscience research with some 40,000 peer-reviewed publications in the last two decades (2,3). The results of fMRI studies are largely determined by fMRI systems and informatics tools which process complex data generated from fMRI scan. fMRI quality assurance (QA) plays a critical role to guarantee high reliability of fMRI studies (4-11), since fMRI QA programs and methods can be used for calibrating fMRI scanner (10-13), testing the stability of fMRI system (14-17), assessing fMRI data quality (15,16,18-22) and evaluating informatics tools (4-9). Moreover, many QA-related metrics such as test-retest reliability and family-wise error rate (FWER) are applied to evaluate the reliability of fMRI studies (3,23,24).
Many QA programs can test basic MRI system performances, such as resolution, signal contrast, geometric distortion, intensity uniformity, and ghosting artifacts (25-27). These programs are helpful but inadequate for fMRI study. The reasons are as follows:
Scanner temporal stability
The blood oxygenation level dependent (BOLD) signal change only accounts for a small fraction of the total signal (less than 5% for MRI systems with a magnetic field from 1.5 to 3 Tesla) (4,28), and extracting real BOLD signals from the total MR signal requires overcoming noise from various sources (28). To track the brain cognitive process, MR scanners need excellent temporal stability to acquire the BOLD signal over time (28). Additionally, fMRI usually applies fast imaging sequences such as echo planar imaging (EPI), which require excellent time resolutions and temporal stability during fMRI (4-9). EPI is sensitive to susceptibility effects (7). Consequently, fMRI based on EPI suffers from various artifacts such as Nyquist ghosting and geometric distortions (13). Thus, the basic QA programs are inadequate for fMRI studies, and QA specially designed for fMRI scanning conditions is needed.
Human factors
Ideally, the QA program for fMRI system is supposed to guarantee high-quality fMRI data (10-13). However, latencies such as human operation errors and subjects’ incompliance will lead to low-quality fMRI data (29,30), subjects’ unconsciously physiological movements will add physiological noise to fMRI data (18-22), making the QA of fMRI data an essential step in fMRI. Indeed, the QA of fMRI data can identify such errors and reduce the effect of data with poor quality.
Data processing
In addition to the stable performance of the fMRI system, high-quality fMRI data, the success of fMRI also relies on reasonable data processing and statistical analysis (3,23,31-33). Flexibility in data processing can cause variations in the results since there are many software packages (34-36) and processing parameter combinations (32,33,37). Moreover, sample size, statistical analysis, multiple comparison correction methods also affect the reliability of fMRI studies (3,32,33,38). State-of-the-art studies questioned weakly statistical analysis methods with a false-positive rate of up to 70% (3,38). Thus, the quality evaluation of fMRI processing tools and statistical methods are needed to ensure reliable studies.
Other factors
For fMRI study, subjects are confined in the scanner, which imposes several physical limitations on stimulus delivery (39). BOLD hemodynamic response to a stimulus is affected by many factors such as study paradigm, temporal signal-to-noise ratio (SNR) and variations in data processing (40,41). All these factors may result in misinterpretation of stimulus-related cortical mapping which cannot be fully addressed by basic MRI QA programs (39).
Generally, fMRI system stability, fMRI data quality, processing, and statistical analysis are the main factors that affect the reliability of fMRI studies (14-16), and fMRI QA programs are mainly focused on these aspects. In 1996, Weisskoff et al. proposed an efficient method to measure MR instabilities (17) that was the first to report fMRI QA issues to our knowledge. In 1999, Simmons et al. applied the Shewhart charting approach with QA phantom to check SNR, signal-to-ghost ratio, and signal drift for MRI system (28). Over time, several groups have developed fMRI reference phantoms to simulate BOLD signals and measure several metrics such as SNR and contrast-to-noise ratio (CNR) (4-9). Leading study projects in neuroscience communities such as Human Connectome Project (HCP) (11) and Function Biomedical Informatics Research Network (FBIRN) (42) have developed complete QA processes including QA phantoms, QA protocols, and software to calculate QA metrics.
As a supplement to QA of fMRI systems, real-time fMRI (rtfMRI) has been used for quality check of fMRI scan process to find errors during or shortly after fMRI scans (29). rtfMRI has also been used to monitor signal drift and the subject’s physiological motion (43,44). Online QA programs based on rtfMRI have been developed and applied in several studies (29,45,46). During the past two decades, much work has been focused on quality check of fMRI data (43-47). QA metrics for fMRI data quality check have been proposed, such as SNR, CNR and signal-to-fluctuation noise (SFNR) (14-16,47). Head motion-related metrics such as rigid-body parameters and framewise displacement (FD) have been applied to evaluate the subject’s head motion (19,22,48,49). QA modules for quality check of fMRI data and processing steps have begun to appear in fMRI processing software packages (50,51).
Although processing steps and statistical analysis methods are not typically QA-related issues, quality evaluation of processing steps and statistical analysis methods also play a critical role in ensuring high reliable fMRI studies (32,33,52). Computer-generated phantoms and simulated data have been applied for quality evaluation of processing steps and statistical analysis methods (12,53). During the last decade, fMRI communities have paid much attention to the statistical power and reliability of fMRI studies (32,33,52). QA metrics such as FWER and test-retest reliability have been applied for evaluating multiple comparison correction methods to obtain a more reliable fMRI result (3,23,38).
In this review, studies focused on QA of fMRI were collected. The collected literature was divided into four categories: QA of fMRI systems, QA of fMRI and fMRI data, quality evaluation of fMRI data processing pipelines and statistical methods and QA of task-related fMRI. Finally, conclusion and future work consideration were given.
QA of fMRI systems
fMRI QA phantoms
Phantoms are used as standard QA devices to evaluate, analyze and tune the performance of MRI scanners (14-16,25). Table 1 summarizes fMRI QA phantoms and gives a detailed description of each phantom.

Full table
The most often used phantoms are the so-called liquid phantoms (25). Liquid QA phantoms play an important role in fMRI QA. There are reports on self-designed liquid phantoms for fMRI quality tests such as motion artifacts (12), geometric distortion (13) and stability (17). Simmons et al. applied Shewhart charting to record SNR, signal-to-ghost ratio and signal drift from liquid phantom image for a long time (28). Control limits were pre-defined for Shewhart charting. If a measure in Shewhart charting exceeded control limits, fMRI system evaluation was required (28).
It is known that agarose gel is commonly used as tissue equivalent materials in MRI phantoms (10,11,14-16), and different concentrations of agarose gel mixed with copper sulfate or other solutions can achieve relaxation times T1, T2 and
Concerning fMRI phantoms that mimic BOLD signal changes, there are two major types, as shown in Table 1 and Figure 1. One type (type I phantom illustrated in Figure 1) uses agarose gel as filling material and mechanical rotation to simulate BOLD fMRI signal changes (4-6). This type of fMRI phantom usually has two cylinders (5,6), the outer cylinder and inner cylinder, as illustrated in Figure 1A. However, the phantom by Tovar et al. has only one cylinder, which has a similar function to the inner cylinder of others (4). The outer cylinder acts as the “baseline” that does not rotate during fMRI scanning. The inner cylinder acts as the “active” cylinder and is connected to a manual handle or an electric motor to allow controllable rotations during fMRI. The active cylinder is segmented into different compartments filled with slightly different concentrations of agarose gel. During the rotation of the inner cylinder, different compartments with different concentrations of agar gel enter and leave the region-of-interest (ROI) as depicted in Figure 1B. Because magnetic susceptibility changes as a function of the agar gel concentration (4-6), the rotation of the inner cylinder provide dynamic changes in, which can mimic the active and baseline states of the brain in fMRI, as shown in Figure 1C. The BOLD-like signal provided by the type I phantom can be detected under conventional fMRI scanning conditions using EPI sequences (4-6). QA metrics such as CNR and SNR are measured with this type of phantom for fMRI system QA. In summary, although the type I phantom is simple to assemble, it is inconvenient to alter the signal intensity during fMRI (54). In addition, for different strength of the magnetic field, the relaxation times T1, T2 and are different (4-9,54), which means for fMRI system with different magnetic strength, the concentration of agar gel should be changed and the phantom should be re-filled (14-16,54). And agarose gel suffers from dehydration (10,11,13), so the phantom will have air gaps as time passes by.

The other type of fMRI phantom (type II phantom in Figure 1) applies electrical properties such as radiofrequency (RF) (7-9) or impurity ion currents in polar materials (54) to generate magnetic inhomogeneities in the magnetic field of MRI, leading to a change in the fMRI signal. As illustrated in Figure 1D,E, the type II phantom has one electric cell inserted into a container (7-9), while Qiu’s phantom has several reference cells to provide a reference signal in comparison to the active signal from the electric cell (54). To use RF to generate magnetic inhomogeneities, the container is filled with proton-rich medium, e.g., agarose gel with copper sulfate (7), oil (8), or Gd-doped water (9). When the electric cell induces current into the medium, magnetic field distortion is generated. MR scanner will detect this distortion as the fMRI signal changes (7-9). Cheng et al. have proved the feasibility of the type II phantom using typical fMRI acquisition methods and fMRI data processing tools that include Statistical Parametric Mapping (SPM), FMRIB Software Library (FSL) and BrainVoyager (7). For Qiu’s phantom, impurity ion currents in propylene carbonate were tested on a 1.5 Tesla MRI system using a spin-echo and EPI sequence, and the applicability of such phantoms was proved (54). The electric cell of the type II phantom is connected to a controlled computer via an optical fiber to allow a controllable signal change, as demonstrated in Figure 1F.
fMRI QA metrics
QA metrics are used for quantitative evaluations of fMRI systems. Since fMRI signal is sensitive to noise (4,28), metrics for system noise evaluation were proposed such as SNR and CNR (5,7,15,17,28). To our knowledge, the existing fMRI QA metrics are as follows: percent signal fluctuation (PSF) (5,14-16,55), CNR (5,17,55), signal fluctuation sensitivity (6), SNR (7,15,17,28,56), percentage signal change (PSC) (9,15), SFNR (15,16,55-57), signal-weighted SFNR, instability SFNR, background SFNR, physiological SFNR (16), percent signal drift (15), radius of decorrelation (15), signal-to-ghost ratio (28) and temporal SNR (47,57). A detailed summary of the major fMRI QA metrics is given in Table 2. QA metrics are often calculated within the ROI of phantom images (14-16). The calculated values of these metrics will reflect the performance of fMRI systems.

Full table
SNR
SNR is one of the most used metrics in science and engineering (4,28). Temporal SNR is also used in fMRI QA to evaluate the stability of the MR system (7,15,17,28,56). Friedman et al. applied the QA phantom of FBIRN (15) to calculate SNR. FBIRN QA scanning protocol was used, and the phantom image was obtained. ROI was defined at the center of the spherical phantom. SNR was defined within the ROI as the ratio of signal summary value and variance summary value. A similar approach was seen in the study by Simmons et al. (28).
Also, SNR-related metrics have been proposed, such as SNR0, time-course SNR, and temporal SNR. SNR0 is defined as the ratio of the average mean signal to the average standard deviation within the center ROI of the phantom image (56,57). Time-course SNR is defined as the ratio of mean intensity within the evaluated ROI in the time-series and standard deviation across time (56). Temporal SNR is a crucial metric to evaluate the ability of an fMRI acquisition to detect subtle neural signal changes in the measured time-series data. Temporal SNR is calculated as the temporal mean signal divided by temporal standard deviation within the center ROI of the phantom image (57). Triantafyllou et al. have pointed out that time-course SNR is dominated by physiological noise with secondary contributions from thermal noise, whereas SNR0 is directly linked to thermal noise (56). Temporal SNR, SNR0, and time-course SNR has been used for evaluation of fMRI image noise properties at different magnetic field strength, and the results demonstrated that higher field strength still provides improved SNR with optimization of acquisition parameters (56,57).
CNR
CNR is an important metric concerning the results of the fMRI study, which depends on signal fluctuation and noise (47). CNR can be calculated using the type I fMRI QA phantom made by Tovar et al. (4). The computational formula of CNR is given as follows:

Where ΔS = SA − SB, SA and SB refer to the signal from two different rotational states of the phantom and σ is the standard deviation in the time series data. Similar calculations can also be found in the study by Olsrud et al. (5). Additionally, CNR-related metrics can be calculated with the help of the type I fMRI QA phantom made by Tovar et al. (4).
In addition to the phantom-assisted calculation methods, Geissler et al. have proposed a calculation method using task-related fMRI data (47). The task is opening and closing of the right hand, and the definition of CNR is similar to Eq. [1], except ΔS refers to the task-related signal variability and σ is the non-task-related variability over time. CNR is calculated for each brain voxel using two different approaches: one is a model-based approach and uses the general linear model, the other uses Savitzky-Golay filters. The results of the two approaches are highly correlated (47).
SFNR
SFNR is a key metric in the fMRI QA protocol of FBIRN (15-17). Using a static QA phantom such as FBIRN’s QA phantom, SFNR is defined as the mean signal intensity divided by the standard deviation of the total noise within the evaluating ROI (15,55).
From the definition, it can be seen that SFNR is sensitive to various noise. To separate different types of noise, Greve et al. proposed several SFNR-related metrics, background SFNR, signal-weighted SFNR, instability SFNR, and physiological SFNR, which reflect different noise sources (16). Specifically, background SFNR, instability SFNR and physiological SFNR reflect the background, instability and physiological components, respectively, and signal-weighted SFNR reflects the sum of the background and instability noise. Greve et al. stated that there were two types of noise during the phantom fMRI scan, background and instability noise, and human fMRI introduced a third type of noise, physiological noise. Signal-weighted SFNR and background SFNR were calculated from agar phantom data obtained with two flip angles, and physiological SFNR was extracted from human fMRI data collected using the same method (16).
PSC/PSF
PSC is another key metric in the fMRI QA protocol of FBIRN (14-16). It is believed that PSC is the most effective measurement metric because it provides direct interpretation regarding whether a signal change is induced by the BOLD effect (14,15,17). Because the average BOLD signal variations do not exceed 5%, temporal PSC that exceeds 5% can hardly be explained by the BOLD effect (4,28). PSC is calculated with the association of the fMRI QA phantom, such as the QA phantom of FBIRN (14,15,17) or types I QA phantom by Olsrud et al. (5). It is defined as the percent ratio of standard deviation to the mean signal intensity in the evaluating ROI. Other descriptions such as signal fluctuation and PSF have similar definitions.
QA of fMRI and fMRI data
QA of fMRI system is not sufficient to guarantee a high-reliable fMRI study because operator- and subject-dependent factors during fMRI (e.g., incorrect operations by MR technologists, subjects’ head motion and subjects’ poor involvement during task experiments) will affect the results of fMRI (18,29). Moreover, these issues are inevitable (29). Researchers have developed tools and QA metrics to handle these issues (19-22,29,43,48,58). For instance, rtfMRI can monitor the subjects’ involvement during fMRI and provide a simultaneous quality check of fMRI data (29,43,58). Head motion-related metrics can reveal the subjects’ head motion (19-22,48).
rtfMRI and online QA of fMRI data
Immediately after fMRI, MR operators should start QA of fMRI data by checking the basic qualities of the data (29,59). For instance, if the image consists of too much noise or ghosting artifacts, the scan should be redone; otherwise, the data should be excluded. Indeed, there are studies and reports on the immediate assessment of fMRI data that use a technique called rtfMRI (29,60). Presently, the research focus of rtfMRI includes neural feedback and brain-computer interface (60). However, one of the most direct applications of rtfMRI is monitoring functional imaging scans and detecting errors (29). With the immediate assessment of the fMRI scan process, rtfMRI can monitor and estimate head motion parameters (43,58), cardiorespiratory parameters (44) and detect signal drift (29). Researchers have developed integrated rtfMRI systems for physiological recording of cardiac, respiratory, head motions (43,44,58,61). Several research sites have developed online QA programs based on rtfMRI to detect signal drift, motion, RF noise and spikes, scan-to-scan stability, artifacts and ghost levels (29,45,46,59). In HCP, the data are transferred to an online database, followed by an immediate quality check shortly after fMRI scan using rtfMRI (59).
QA metrics of fMRI data
fMRI measures BOLD signal changes throughout the scanning period (28), so the in-plane image quality for fMRI is less important compared to the speed of signal acquisition (62). fMRI uses fast imaging methods to achieve its purpose but would inevitably introduce noise to the image (62). Furthermore, the BOLD signal is most sensitive to physiological noise near large vessels by nature (28). So temporal stability and noise level have an impact on fMRI data (14,18). The QA of the fMRI data cannot be apart from the fMRI system, and QA phantom, QA metrics designed for fMRI system can also be applied to the QA of fMRI data. Signal drift and PSC can be applied to evaluate temporal variations (14,29). SNR, CNR, and SFNR can provide a quantitative evaluation of the image noise level (14-17).
Physiological motions such as head, respiratory motion and vasomotion, introduce physiological noise to the fMRI data and lead to false intrinsic functional connectivity (18). Among these physiological motions, head motion is a major concern in the fMRI study (19,20). Mock scanner, cushions, rtfMRI head motion monitor and data acquisition measures are used by fMRI researchers to minimize head motion during fMRI scans (11,43,58), but head motion is inevitable. Head motion-related parameters are the most frequently used QA metrics (19,49). In fMRI, there are several metrics: 6 head motion parameters (19,20), root-mean-squared (RMS) motion (21,22), FD (22,48), absolute displacement (21,48), DVARS (21,22), and standard deviation (21). The major head motion metrics are as follows.
Six head motion parameters and RMS motion
The six head motion parameters, also known as the rigid-body 6-parameter model, include transitional motion and rotational motion, which were proposed by Friston et al. (19). The six parameters are x, y, and z for translation, pitch, roll, and yaw for rotation. Data processing software packages such as SPM and Data Processing & Analysis for Brain Imaging (DPABI) can provide a calculation of the mean and maximum values of the six parameters and set the head motion threshold (50,51). The common threshold for head motion is 0.5 to 1.5 mm for translational motion and 0.5 to 1.5 degrees for rotational motion (48).
RMS motion includes the mean squared values of head position changes (x, y and z translation, pitch, roll, and yaw for rotational motion) across all time points (21,22).
FD
FD is a scalar quantity reflecting head motion and represents the head motion of each brain volume compared with the previous volume (22,49). Power et al. calculated the FD using the following formula (22):
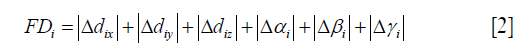
Where Δdix, Δdiy, and Δdiz represent differentiated translational displacements and Δαi, Δβi and Δγi represent differentiated rotational displacements. The displacements are calculated by backward difference, and rotational displacements are calculated on the surface of a sphere with a radius of 50 mm to convert from degrees to millimeters (22). In addition to the FD by Power et al., there are other approaches to calculate FD; for instance, Jenkinson et al. used RMS deviation to calculate FD (49), and Van Dijk et al. defined displacement in 3-D space for each brain volume as the RMS of translation parameters from one volume to the next (63). Power et al. set the threshold for FD with no more than 0.2 mm as well as 1 back and 2 forward neighbors (22,48).
DVARS
Other metrics exist that are not typically head motion metrics but can be used to detect motion-related artifacts and identify bad scans. DVARS is one of them.
DVARS (D refers to a derivative of fMRI time course, VARS refers to RMS variance) reflects BOLD signal fluctuations in the defined ROI of each data volume compared with the previous volume (21,22). DVARS is often calculated within a given ROI. However, if the ROI is not given, DVARS is calculated across the whole brain (21). The definition of DVARS is given in the following formula (22):
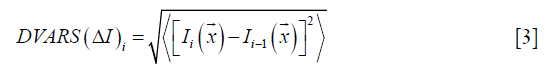
Where Ii(x) is the signal intensity at location x on the ith frame, and denotes the spatial average in the given ROI. As shown in Eq. [3], a low DVARS value represents high data quality (22). However, the threshold of DVARS to distinguish bad scans from good scans is lacking. In a recent study, Afyouni et al. described a sum of squares decomposition of the fMRI data and proposed null distribution and p-values for DVARS thresholding (64).
Quality evaluation of fMRI data processing pipelines and statistical methods
Quality of fMRI data processing
fMRI data processing includes slice timing, realignment, normalization and smoothing (37). Each preprocessing step includes parameters to be set and choices to be made by researchers (51). Carp conducted 6,912 preprocessing choice combinations to a single dataset and found that certain regions experienced more variations than others (32). Although with the upgrade of preprocessing software pipelines, variations induced by parameter settings have been minimized, but flexibility in data preprocessing remains a potential factor that has an impact on the fMRI study (32,33). A state-of-the-art study has stated that a clear description of data processing steps and preregistration of methods and analysis plans are potential solutions to this issue (33).
As for each processing step, smoothing is a controversial step (65). Smoothing is a crucial step in data preprocessing that guarantees the assumptions of Gaussian random field theory and reduces certain noise and the effects of spatiotemporal heterogeneity of fMRI data (66,67). However, there is a controversy regarding whether or not to use spatial smoothing in fMRI preprocessing because smoothing blurs together different types of tissues that may enlarge activation regions and reduce useful spatial heterogeneity (65). Some state-of-the-art works include spatial smoothing in their procedures (68) while others use unsmoothed data (69,70), and the controversy remains unresolved.
For motion-related artifact correction, the method employed is denoising, which is the main step for data processing. Major software packages such as SPM and Analysis of Functional NeuroImages (AFNI) have integrated denoising methods such as bandpass filter and scrubbing into the pipelines (37,50,51). External physiological motion measurements and data-based methods (e.g., realignment, bandpass filter, scrubbing method, Wavelet Despike method, independent component analysis, and principal component analysis) (71-74) are two major denoising methods. By physiological recording of physiological motions, motion-related effects can be modeled and removed with linear regression (61). However, external physiological measurements may not be universal due to the lack of recording equipment and incompliant subjects, thus making data-based methods a reliable choice of motion-related artifact correction (61). QA metrics such as motion-BOLD contrast, test-retest reliability, high-motion vs. low-motion contrast, and temporal degrees of freedom loss have been proposed to assess the performance of different data-based denoising methods (71,75). A recent study by Parkes et al. compared 8 most popular denoising methods, including regression of head motion parameters, anatomical component correction, global signal regression, and independent component analysis-based strategy for Automatic Removal of Motion Artifacts (ICA-AROMA), using the above QA metrics. The results indicated that ICA-AROMA performed best in high-motion vs. low-motion contrast, test-retest reliability, quality control/functional connectivity correlations (75). Moreover, the author recommended ICA-AROMA to be used for motion-related artifact correction.
Comparison of fMRI software packages
fMRI data-processing software can be divided into two categories. One category is that the mentioned above rtfMRI and online analysis tools provided by MRI vendors or large studies sites and projects (29); the other category is offline software including MATLAB-based packages such as SPM (50), Resting-State fMRI Data Analysis Toolkit, DPABI and independent software such as AFNI and FSL (37). Both online processing software and offline software have similar processing steps and statistical analysis methods (50,58).
Because the ground truth of human fMRI data is almost impossible to obtain, images of QA phantoms and computer-generated fMRI phantoms are used to evaluate the performance of the software packages (34-36). Several groups have generated simulated data to evaluate fMRI processing software (12). Table 3 summarizes computer-generated phantoms and simulated data for quality evaluation of fMRI processing software. Studies have shown similar activation results of both online software and offline software using simulated data and real fMRI data (53,71). There are also comparison studies of the same software on different operating systems in the early days (76). With the present upgrade of software packages, each software has strong compatibility, and a few papers related to this issue have been seen.

Full table
In addition to the above comparison, different software packages have their QA features (50,51). For instance, SPM generates head motion reports during the realignment process, and unqualified subjects can be eliminated with the setting of a head motion threshold. SPM can also provide a quality check for spatial normalization and relevant quality scores (50). Additionally, DPABI provides an integrated QA module for functional and structural images in version 3.0 and follow-up versions (51). The quality check for raw functional image, T1 image and normalization are shown in Figure 2A,B,C,D. The head motion report is given in Figure 2E,F,G for translational motion, rotational motion and mean FD.

fMRI statistical analysis
Statistical power
The sample size has a huge impact on the statistical power of fMRI studies (23,77,78). Several studies have indicated that small-sized fMRI studies not only have a reduced chance of detecting true effects but also have a reduced likelihood that a statistically significant result reflects a true effect (77,78). However, how many subjects are enough? A study by Carp reviewed 241 research articles from 2007 to 2012 and found that the median sample size per group for two-group studies was 14.75 and 15 for one-group studies (32). From 2011 to 2015, 1,131 fMRI research articles demonstrated an increased median sample size of 28.5 for single-group studies and 19 per-group for multigroup studies (33). In a recent study, Yeung et al. reviewed 388 articles published in 2017 and found that the median sample size was 33 (52).
Chen et al. calculated the reliability, sensitivity and positive predictive value as the sample size differed and suggested that studies with a sample size less than 80 (40 per group) should be considered as a preliminary study given its low reliability, sensitivity and positive predictive value (23).
State-of-the-art studies suggested a priori power calculation using formal statistical power analysis such as PowerMap or noncentral random field theory framework (33,77). Making research data available and collaborative work will increase the opportunities for data aggregation, allow external checking of the results, which increases total sample size and therefore statistical power and transforms the reliability of findings (33,77).
Quality evaluation of multiple comparison correction methods
All the existing fMRI analysis methods can be roughly classified into two categories. One is the hypothesis-driven approach such as that integrated with SPM, FSL, and AFNI (37,50). The other is the data-driven approach such as principal component analysis (79), ICA (66,74-75), and canonical variate analysis (80). Most analysis methods involve mass univariate testing with separate hypothesis test of each voxel (37,50,66). As a result, the false positive rate will be inflated if there is no correction for multiple comparison tests (33). Therefore, corrections for multiple comparisons are needed in fMRI studies (33). Recently, a growing number of studies have questioned the reliability of some fMRI results that used weak multiple comparisons correction methods with a low statistical threshold (3,33,38,52), which bring a concern to the fMRI communities.
There is no doubt that reliability is the most important factor in fMRI studies (32,33,52). To evaluate the reliability of fMRI multiple comparisons correction methods, many QA metrics have been proposed, such as receiver operating characteristics (34,35,79,81,82), reproducibility (23,24,31), FWER (3,23), test-retest reliability (24,83-85), and positive predictive value (23,77).
Test-retest reliability is one of the most effective metrics to estimate the reliability of fMRI studies. Consortium for Reliability and Reproducibility (CoRR) has promoted test-retest reliability as QA standards for fMRI communities (24). CoRR has also collected and shared the test-retest dataset via the 1000 Functional Connectomes Project and International Neuroimaging Data-sharing Initiative, allowing individual researchers to calculate reliability on their own (24). To measure test-retest reliability, the same fMRI test must be performed on the same subjects on two separate occasions. Next, test-retest reliability can be evaluated using many approaches, such as the intraclass coefficient or the dice coefficient across two fMRI scans (23,86).
FWER is another effective metric for performance evaluation of statistical analysis and multiple comparison strategy. It is defined as the probability of making type I errors when performing multiple comparisons (3,23). To achieve low FWER, several multiple comparison correction strategies are valid, such as FWE and false discovery rate correction (23).
A recent study has reported that permutation associated with Threshold-Free Cluster Enhancement achieves the best balance among FWER, test-retest reliability and replicability, and suggested permutation test with Threshold-Free Cluster Enhancement should be used to guarantee high reliable fMRI studies (23). Furthermore, non-parametric methods such as permutation test have also outperformed other traditional parametric methods in false positive rate and FWER (3,33).
QA of task-related fMRI
The former mentioned QA of fMRI system and fMRI data, quality evaluation of fMRI data processing pipelines and statistical methods are also suitable for task-related fMRI. In terms of QA specially designed for task fMRI scanning equipment and apparatus (e.g., haptic, auditory and visual devices), study design, and paradigm design tools, few related literature sources are available. In this section, the literature on real-time monitoring, reliability of task fMRI is reviewed.
rtfMRI is a useful tool for simultaneous quality check of fMRI scan processes such as monitoring subjects' physiological movements, involvement and behavioral responses to identify problems as early as possible (45). As discussed above, there is external measuring equipment to record eye movement (30,87) and physiological movements such as cardiac, respiratory, head motions (73). Several groups have reported rtfMRI to monitor behavioral responses and subjects’ involvement (44,88,89). FBIRN has adopted a real-time tool as a quality check method for behavioral and physiological data that can continuously monitor a subject’s task performance, physiological status and eye movement and identify errors as early as possible (90).
Task-related fMRI offers a unique way to identify and locate functional areas in the human brain (91). However, reliability remains a concern for task-related fMRI similar to that for resting-state fMRI (91). For task fMRI, reliability is often calculated as test-retest reliability and reproducibility over time (91). Test-retest reliability, often known as repeatability, is the metric to evaluate the stability over time for test-retest data. Extensive works have been performed to assess the test-retest reliability of task-related fMRI using parameters such as intraclass coefficient, Pearson correlation, and coefficient of variation (83,91,92). Reproducibility is a metric to quantify the ability to obtain similar results over time (23,91). For task-related fMRI, reproducibility has been evaluated using parameters such as the dice coefficient or Jaccard overlap (23,91).
Conclusions
The last two decades have witnessed the development of fMRI QA phantoms (4-11,54) and QA metrics (14-16,55-57). Major projects such as FBIRN (14-16) and HCP (11) have established complete QA protocols and well-designed QA processes. Although the QA mentioned above processes could play an important role in ensuring high reliable fMRI studies, future fMRI studies still face many challenges due to flexibility in the experiment, data processing, statistical analysis (32,33). Meanwhile, a considerable amount of fMRI studies still had inadequate statistical power and lacked control over false positive rates (32,52).
In the future, researchers should establish collaborated efforts towards a more transparent and reproducible fMRI communities. Multicenter fMRI studies are recommended for several reasons: Multicenter fMRI studies can recruit subjects with increased demographic diversity. A growing number of subjects also enhances the statistical power of the fMRI study.
About QA of fMRI systems, FBIRN, HCP, and other study projects have made their own fMRI QA protocol. A daily inspection of the fMRI system according to the fMRI QA protocol is highly recommended by the community.
In terms of fMRI data quality check, data sharing should be encouraged for the reason that it not only allows an external check of the original result but also offers a source for researchers all over the world to validate and improve their processing and analysis methods.
As for data processing and statistical analysis, more concerns should be focused on sample size, since sample size affects the statistical power of fMRI studies. Multiple comparison correction should also be focused on for control over false positive rates.
As fMRI research continues to proper with the surging of new fMRI techniques and new processing and statistical methods, it is likely that new fMRI QA programs will be needed.
Acknowledgments
Funding: This work was supported by the National Key Research and Development Program of China (2016YFC0103400 to J Qiu); the Key Research and Development Program of Shandong Province (2017GGX201010 to W Lu); the Natural Science Foundation of China (81371531 to Q Jiao). J Qiu was supported by the Taishan Scholars Program of Shandong Province (TS201712065).
Footnote
Conflicts of Interest: The authors have no conflicts of interest to declare.
References
- Smith K. Brain imaging: fMRI 2.0. Nature 2012;484:24-6. [Crossref] [PubMed]
- Poldrack RA, Farah MJ. Progress and challenges in probing the human brain. Nature 2015;526:371-9. [Crossref] [PubMed]
- Eklund A, Nichols TE, Knutsson H. Cluster failure: Why fMRI inferences for spatial extent have inflated false-positive rates. Proc Natl Acad Sci U S A 2016;113:7900-5. [Crossref] [PubMed]
- Tovar DA, Zhan W, Rajan SS. A Rotational Cylindrical fMRI Phantom for Image Quality Control. Plos One 2015;10:e0143172. [Crossref] [PubMed]
- Olsrud J, Nilsson A, Mannfolk P, Waites A, Ståhlberg F. A two-compartment gel phantom for optimization and quality assurance in clinical BOLD fMRI. Magn Reson Imaging 2008;26:279-86. [Crossref] [PubMed]
- DeDora DJ, Nedic S, Katti P, Arnab S, Wald LL, Takahashi A, Van Dijk KR, Strey HH, Mujica-Parodi LR. Signal Fluctuation Sensitivity: An Improved Metric for Optimizing Detection of Resting-State fMRI Networks. Front Neurosci 2016;10:180. [Crossref] [PubMed]
- Cheng H, Zhao Q, Duensing GR, Edelstein WA, Spencer D, Browne N, Saylor C, Limkeman M. SmartPhantom--an fMRI simulator. Magn Reson Imaging 2006;24:301-13. [Crossref] [PubMed]
- Renvall V, Joensuu R, Hari R. Functional phantom for fMRI: a feasibility study. Magn Reson Imaging 2006;24:315-20. [Crossref] [PubMed]
- Renvall V. Functional magnetic resonance imaging reference phantom. Magn Reson Imaging 2009;27:701-8. [Crossref] [PubMed]
- Jack CR Jr, Bernstein MA, Fox NC, Thompson P, Alexander G, Harvey D, Borowski B, Britson PJ. L Whitwell J, Ward C, Dale AM, Felmlee JP, Gunter JL, Hill DL, Killiany R, Schuff N, Fox-Bosetti S, Lin C, Studholme C, DeCarli CS, Krueger G, Ward HA, Metzger GJ, Scott KT, Mallozzi R, Blezek D, Levy J, Debbins JP, Fleisher AS, Albert M, Green R, Bartzokis G, Glover G, Mugler J, Weiner MW. The Alzheimer's disease neuroimaging initiative (ADNI): MRI methods. J Magn Reson Imaging 2008;27:685-91. [Crossref] [PubMed]
- Marcus DS, Harms MP, Snyder AZ, Jenkinson M, Wilson JA, Glasser MF, Barch DM, Archie KA, Burgess GC, Ramaratnam M, Hodge M, Horton W, Herrick R, Olsen T, McKay M, House M, Hileman M, Reid E, Harwell J, Coalson T, Schindler J, Elam JS, Curtiss SW, Van Essen DC. WU-Minn HCP Consortium. Human Connectome Project informatics: quality control, database services, and data visualization. Neuroimage 2013;80:202-19. [Crossref] [PubMed]
- Muresan L, Renken R, Roerdink JB, Duifhuis H. Automated correction of spin-history related motion artefacts in fMRI: Simulated and phantom data. IEEE Trans Biomed Eng 2005;52:1450-60. [Crossref] [PubMed]
- Mattila S, Renvall V, Hiltunen J, Kirven D, Sepponen R, Hari R, Tarkiainen A. Phantom-based evaluation of geometric distortions in functional magnetic resonance and diffusion tensor imaging. Magn Reson Med 2007;57:754-63. [Crossref] [PubMed]
- Stöcker T, Schneider F, Klein M, Habel U, Kellermann T, Zilles K, Shah NJ. Automated quality assurance routines for fMRI data applied to a multicenter study. Hum Brain Mapp 2005;25:237-46. [Crossref] [PubMed]
- Friedman L, Glover GH. Report on a multicenter fMRI quality assurance protocol. J Magn Reson Imaging 2006;23:827-39. [Crossref] [PubMed]
- Greve DN, Mueller BA, Liu T, Turner JA, Voyvodic J, Yetter E, Diaz M, McCarthy G, Wallace S, Roach BJ, Ford JM, Mathalon DH, Calhoun VD, Wible CG, Brown GG, Potkin SG, Glover G. A novel method for quantifying scanner instability in fMRI. Magn Reson Med 2011;65:1053-61. [Crossref] [PubMed]
- Weisskoff RM. Simple measurement of scanner stability for functional NMR imaging of activation in the brain. Magn Reson Med 1996;36:643-5. [Crossref] [PubMed]
- Goto M, Abe O, Miyati T, Yamasue H, Gomi T, Takeda T. Head Motion and Correction Methods in Resting-state Functional MRI. Magn Reson Med Sci 2016;15:178-86. [Crossref] [PubMed]
- Friston KJ, Williams S, Howard R, Frackowiak RS, Turner R. Movement-related effects in fMRI time-series. Magn Reson Med 1996;35:346-55. [Crossref] [PubMed]
- Seto E, Sela G, McIlroy WE, Black SE, Staines WR, Bronskill MJ, McIntosh AR, Graham SJ. Quantifying head motion associated with motor tasks used in fMRI. Neuroimage 2001;14:284-97. [Crossref] [PubMed]
- Power JD, Mitra A, Laumann TO, Snyder AZ, Schlaggar BL, Petersen SE. Methods to detect, characterize, and remove motion artifact in resting state fMRI. Neuroimage 2014;84:320-41. [Crossref] [PubMed]
- Power JD, Barnes KA, Snyder AZ, Schlaggar BL, Petersen SE. Spurious but systematic correlations in functional connectivity MRI networks arise from subject motion. Neuroimage 2012;59:2142-54. [Crossref] [PubMed]
- Chen X, Lu B, Yan CG. Reproducibility of R-fMRI metrics on the impact of different strategies for multiple comparison correction and sample sizes. Hum Brain Mapp 2018;39:300-18. [Crossref] [PubMed]
- Zuo XN, Anderson JS, Bellec P, Birn RM, Biswal BB, Blautzik J, Breitner JC, Buckner RL, Calhoun VD, Castellanos FX, Chen A, Chen B, Chen J, Chen X, Colcombe SJ, Courtney W, Craddock RC, Di Martino A, Dong HM, Fu X, Gong Q, Gorgolewski KJ, Han Y, He Y, He Y, Ho E, Holmes A, Hou XH, Huckins J, Jiang T, Jiang Y, Kelley W, Kelly C, King M, LaConte SM, Lainhart JE, Lei X, Li HJ, Li K, Li K, Lin Q, Liu D, Liu J, Liu X, Liu Y, Lu G, Lu J, Luna B, Luo J, Lurie D, Mao Y, Margulies DS, Mayer AR, Meindl T, Meyerand ME, Nan W, Nielsen JA, O'Connor D, Paulsen D, Prabhakaran V, Qi Z, Qiu J, Shao C, Shehzad Z, Tang W, Villringer A, Wang H, Wang K, Wei D, Wei GX, Weng XC, Wu X, Xu T, Yang N, Yang Z, Zang YF, Zhang L, Zhang Q, Zhang Z, Zhang Z, Zhao K, Zhen Z, Zhou Y, Zhu XT, Milham MP. An open science resource for establishing reliability and reproducibility in functional connectomics. Sci Data 2014;1:140049. [Crossref] [PubMed]
- Davids M, Zöllner FG, Ruttorf M, Nees F, Flor H, Schumann G, Schad LR. IMAGEN Consortium. Fully-automated quality assurance in multi-center studies using MRI phantom measurements. Magn Reson Imaging 2014;32:771-80. [Crossref] [PubMed]
- Xin X, Han J, Wang D, Feng Y, Feng Q, Chen W. Development of a calibration phantom set for MRI temperature imaging system quality assurance. Acad Radiol 2012;19:740-5. [Crossref] [PubMed]
- Wang D, Doddrell DM, Cowin G. A novel phantom and method for comprehensive 3-dimensional measurement and correction of geometric distortion in magnetic resonance imaging. Magn Reson Imaging 2004;22:529-42. [Crossref] [PubMed]
- Simmons A, Moore E, Williams SC. Quality control for functional magnetic resonance imaging using automated data analysis and Shewhart charting. Magn Reson Med 1999;41:1274-8. [Crossref] [PubMed]
- Bagarinao E, Nakai T, Tanaka Y. Real-time functional MRI: development and emerging applications. Magn Reson Med Sci 2006;5:157-65. [Crossref] [PubMed]
- Brodoehl S, Witte OW, Klingner CM. Measuring eye states in functional MRI. BMC Neurosci 2016;17:48. [Crossref] [PubMed]
- Gonzalez-Castillo J, Talavage TM. Reproducibility of fMRI activations associated with auditory sentence comprehension. Neuroimage 2011;54:2138-55. [Crossref] [PubMed]
- Carp J. The secret lives of experiments: methods reporting in the fMRI literature. Neuroimage 2012;63:289-300. [Crossref] [PubMed]
- Poldrack RA, Baker CI, Durnez J, Gorgolewski KJ, Matthews PM, Munafò MR, Nichols TE, Poline JB, Vul E, Yarkoni T. Scanning the horizon: towards transparent and reproducible neuroimaging research. Nat Rev Neurosci 2017;18:115-26. [Crossref] [PubMed]
- Pickens DR, Li Y, Morgan VL, Dawant BM. Development of computer-generated phantoms for FMRI software evaluation. Magn Reson Imaging 2005;23:653-63. [Crossref] [PubMed]
- Morgan VL, Pickens DR, Hartmann SL, Price RR. Comparison of functional MRI image realignment tools using a computer-generated phantom. Magn Reson Med 2001;46:510-4. [Crossref] [PubMed]
- Xu N, Fitzpatrick JM, Li Y, Dawant BM, Pickens DR, Morgan VL. Computer-generated fMRI phantoms with motion-distortion interaction. Magn Reson Imaging 2007;25:1376-84. [Crossref] [PubMed]
- Amaro E Jr, Barker GJ. Study design in fMRI: basic principles. Brain Cognition 2006;60:220-32. [Crossref] [PubMed]
- Eklund A, Andersson M, Josephson C, Johannesson M, Knutsson H. Does parametric fMRI analysis with SPM yield valid results? An empirical study of 1484 rest datasets. Neuroimage 2012;61:565-78. [Crossref] [PubMed]
- Haase L, Cerf-Ducastel B, Murphy C. The effect of stimulus delivery technique on perceived intensity functions for taste stimuli: Implications for fMRI studies. Atten Percept Psychophys 2009;71:1167-73. [Crossref] [PubMed]
- Huettel SA, Obembe OO, Song AW, Woldorff MG. The BOLD fMRI refractory effect is specific to stimulus attributes: evidence from a visual motion paradigm. Neuroimage 2004;23:402-8. [Crossref] [PubMed]
- Bonakdarpour B, Parrish TB, Thompson CK. Hemodynamic response function in patients with stroke-induced aphasia: Implications for fMRI data analysis. Neuroimage 2007;36:322-31. [Crossref] [PubMed]
- Glover GH, Mueller BA, Turner JA, van Erp TG, Liu TT, Greve DN, Voyvodic JT, Rasmussen J, Brown GG, Keator DB, Calhoun VD, Lee HJ, Ford JM, Mathalon DH, Diaz M, O'Leary DS, Gadde S, Preda A, Lim KO, Wible CG, Stern HS, Belger A, McCarthy G, Ozyurt B, Potkin SG. Function biomedical informatics research network recommendations for prospective multicenter functional MRI studies. J Magn Reson Imaging 2012;36:39-54. [Crossref] [PubMed]
- Yang S, Ross TJ, Zhang Y, Stein EA, Yang Y. Head motion suppression using real-time feedback of motion information and its effects on task performance in fMRI. Neuroimage 2005;27:153-62. [Crossref] [PubMed]
- Smyser C, Grabowski TJ, Frank RJ, Haller JW, Bolinger L. Real-time multiple linear regression for fMRI supported by time-aware acquisition and processing. Magn Reson Med 2001;45:289-98. [Crossref] [PubMed]
- Weiskopf N, Sitaram R, Josephs O, Veit R, Scharnowski F, Goebel R, Birbaumer N, Deichmann R, Mathiak K. Real-time functional magnetic resonance imaging: methods and applications. Magn Reson Imaging 2007;25:989-1003. [Crossref] [PubMed]
- Voyvodic JT, Glover GH, Greve D, Gadde S. FBIRN. Automated Real-Time Behavioral and Physiological Data Acquisition and Display Integrated with Stimulus Presentation for fMRI. Front Neuroinform 2011;5:27. [PubMed]
- Geissler A, Gartus A, Foki T, Tahamtan AR, Beisteiner R, Barth M. Contrast-to-noise ratio (CNR) as a quality parameter in fMRI. J Magn Reson Imaging 2007;25:1263-70. [Crossref] [PubMed]
- Yan CG, Craddock RC, He Y, Milham MP. Addressing head motion dependencies for small-world topologies in functional connectomics. Front Hum Neurosci 2013;7:910. [Crossref] [PubMed]
- Jenkinson M, Bannister P, Brady M, Smith S. Improved optimization for the robust and accurate linear registration and motion correction of brain images. Neuroimage 2002;17:825-41. [Crossref] [PubMed]
- Ashburner J. SPM: a history. Neuroimage 2012;62-248:791-800.
- Yan CG, Craddock RC, Zuo XN, Zang YF, Milham MP. Standardizing the intrinsic brain: towards robust measurement of inter-individual variation in 1000 functional connectomes. Neuroimage 2013;80:246-62. [Crossref] [PubMed]
- Yeung AWK. An Updated Survey on Statistical Thresholding and Sample Size of fMRI Studies. Front Hum Neurosci 2018;12:16. [Crossref] [PubMed]
- Gold S, Christian B, Arndt S, Zeien G, Cizadlo T, Johnson DL, Flaum M, Andreasen NC. Functional MRI statistical software packages: a comparative analysis. Hum Brain Mapp 1998;6:73-84. [Crossref] [PubMed]
- Qiu Y, Kwok WE, Hornak JP. A method of switching the signal in an MRI phantom based on trace ion currents. J Magn Reson 2014;245:171-6. [Crossref] [PubMed]
- Friedman L, Glover GH, Consortium F. Reducing interscanner variability of activation in a multicenter fMRI study: controlling for signal-to-fluctuation-noise -ratio (SFNR) differences. Neuroimage 2006;33:471-81. [Crossref] [PubMed]
- Triantafyllou C, Hoge RD, Krueger G, Wiggins CJ, Potthast A, Wiggins GC, Wald LL. Comparison of physiological noise at 1.5 T, 3 T and 7 T and optimization of fMRI acquisition parameters. Neuroimage 2005;26:243-50. [Crossref] [PubMed]
- Krüger G, Kastrup A, Glover GH. Neuroimaging at 1.5 T and 3.0 T: comparison of oxygenation-sensitive magnetic resonance imaging. Magn Reson Med 2001;45:595-604. [Crossref] [PubMed]
- Cohen MS. Real-time functional magnetic resonance imaging. Methods 2001;25:201-20. [Crossref] [PubMed]
- Sorenson JA, Wang X. ROC methods for evaluation of fMRI techniques. Magn Reson Med 1996;36:737-44. [Crossref] [PubMed]
- deCharms RC. Applications of real-time fMRI. Nat Rev Neurosci 2008;9:720-9. [Crossref] [PubMed]
- Power JD, Schlaggar BL, Petersen SE. Recent progress and outstanding issues in motion correction in resting state fMRI. Neuroimage 2015;105:536-51. [Crossref] [PubMed]
- Chow LS, Paramesran R. Review of medical image quality assessment. Biomed Signal Process Control 2016;27:145-54. [Crossref]
- Van Dijk KR, Sabuncu MR, Buckner RL. The influence of head motion on intrinsic functional connectivity MRI. Neuroimage 2012;59:431-8. [Crossref] [PubMed]
- Afyouni S, Nichols TE. Insight and inference for DVARS. Neuroimage 2018;172:291-312. [Crossref] [PubMed]
- Darki F, Oghabian MA. False positive control of activated voxels in single fMRI analysis using bootstrap resampling in comparison to spatial smoothing. Magn Reson Imaging 2013;31:1331-7. [Crossref] [PubMed]
- Op de Beeck HP. Against hyperacuity in brain reading: spatial smoothing does not hurt multivariate fMRI analyses? Neuroimage 2010;49:1943-8. [Crossref] [PubMed]
- Molloy EK, Meyerand ME, Birn RM. The influence of spatial resolution and smoothing on the detectability of resting-state and task fMRI. Neuroimage 2014;86:221-30. [Crossref] [PubMed]
- Malhi GS, Lagopoulos J, Ward PB, Kumari V, Mitchell PB, Parker GB, Ivanovski B, Sachdev P. Cognitive generation of affect in bipolar depression: an fMRI study. Eur J Neurosci 2004;19:741-54. [Crossref] [PubMed]
- Li H, Nickerson LD, Xiong J, Zou Q, Fan Y, Ma Y, Shi T, Ge J, Gao JH. A high performance 3D cluster-based test of unsmoothed fMRI data. Neuroimage 2014;98:537-46. [Crossref] [PubMed]
- McKeown MJ, Makeig S, Brown GG, Jung TP, Kindermann SS, Bell AJ, Sejnowski TJ. Analysis of fMRI data by blind separation into independent spatial components. Hum Brain Mapp 1998;6:160-88. [Crossref] [PubMed]
- Pruim RHR, Mennes M, van Rooij D, Llera A, Buitelaar JK, Beckmann CF. ICA-AROMA: A robust ICA-based strategy for removing motion artifacts from fMRI data. Neuroimage 2015;112:267-77. [Crossref] [PubMed]
- Pruim RHR, Mennes M, Buitelaar JK, Beckmann CF. Evaluation of ICA-AROMA and alternative strategies for motion artifact removal in resting state fMRI. Neuroimage 2015;112:278-87. [Crossref] [PubMed]
- Murphy K, Birn RM, Bandettini PA. Resting-state FMRI confounds and cleanup. Neuroimage 2013;80:349-59. [Crossref] [PubMed]
- Kundu P, Inati SJ, Evans JW, Luh WM, Bandettini PA. Differentiating BOLD and non-BOLD signals in fMRI time series using multi-echo EPI. Neuroimage 2012;60:1759-70. [Crossref] [PubMed]
- Parkes L, Fulcher B, Yücel M, Fornito A. An evaluation of the efficacy, reliability, and sensitivity of motion correction strategies for resting-state functional MRI. Neuroimage 2018;171:415-36. [Crossref] [PubMed]
- Shinagawa H, Honda E, Ono T, Kurabayashi T, Ohyama K. Comparison of fMRI data analysis by SPM99 on different operating systems. J Med Dent Sci 2004;51:147-54. [PubMed]
- Button KS, Ioannidis JP, Mokrysz C, Nosek BA, Flint J, Robinson ES, Munafò MR. Power failure: why small sample size undermines the reliability of neuroscience. Nat Rev Neurosci 2013;14:365-76. [Crossref] [PubMed]
- Desmond JE, Glover GH. Estimating sample size in functional MRI (fMRI) neuroimaging studies: statistical power analyses. J. Neurosci Methods 2002;118:115-28. [Crossref] [PubMed]
- Beckmann CF, Smith SM. Probabilistic independent component analysis for functional magnetic resonance imaging. IEEE Trans Med Imaging 2004;23:137-52. [Crossref] [PubMed]
- Zhang J, Liang L, Anderson JR, Gatewood L, Rottenberg DA, Strother SC. Evaluation and comparison of GLM- and CVA-based fMRI processing pipelines with Java-based fMRI processing pipeline evaluation system. Neuroimage 2008;41:1242-52. [Crossref] [PubMed]
- Liou M, Su HR, Lee JD, Aston JA, Tsai AC, Cheng PE. A method for generating reproducible evidence in fMRI studies. Neuroimage 2006;29:383-95. [Crossref] [PubMed]
- Della-Maggiore V, Chau W, Peres-Neto PR, McIntosh AR. An empirical comparison of SPM preprocessing parameters to the analysis of fMRI data. Neuroimage 2002;17:19-28. [Crossref] [PubMed]
- Plichta MM, Schwarz AJ, Grimm O, Morgen K, Mier D, Haddad L, Gerdes AB, Sauer C, Tost H, Esslinger C, Colman P, Wilson F, Kirsch P, Meyer-Lindenberg A. Test-retest reliability of evoked BOLD signals from a cognitive-emotive fMRI test battery. Neuroimage 2012;60:1746-58. [Crossref] [PubMed]
- Gorgolewski KJ, Storkey AJ, Bastin ME, Whittle I, Pernet C. Single subject fMRI test-retest reliability metrics and confounding factors. Neuroimage 2013;69:231-43. [Crossref] [PubMed]
- Zuo XN, Xing XX. Test-retest reliabilities of resting-state FMRI measurements in human brain functional connectomics: A systems neuroscience perspective. Neurosci Biobehav Rev 2014;45:100-18. [Crossref] [PubMed]
- Guo CC, Kurth F, Zhou J, Mayer EA, Eickhoff SB, Kramer JH, Seeley WW. One-year test-retest reliability of intrinsic connectivity network fMRI in older adults. Neuroimage 2012;61:1471-83. [Crossref] [PubMed]
- Felblinger J, Müri RM, Ozdoba C, Schroth G, Hess CW, Boesch C. Recordings of eye movements for stimulus control during fMRI by means of electro-oculographic methods. Magn Reson Med 1996;36:410-4. [Crossref] [PubMed]
- Hollmann M, Mönch T, Mulla-Osman S, Tempelmann C, Stadler J, Bernarding J. A new concept of a unified parameter management, experiment control, and data analysis in fMRI: application to real-time fMRI at 3T and 7T. J Neurosci Methods 2008;175:154-62. [Crossref] [PubMed]
- Weiskopf N, Mathiak K, Bock SW, Scharnowski F, Veit R, Grodd W, Goebel R, Birbaumer N. Principles of a brain-computer interface (BCI) based on real-time functional magnetic resonance imaging (fMRI). IEEE Trans Biomed Eng 2004;51:966-70. [Crossref] [PubMed]
- Keator DB, van Erp TGM, Turner JA, Glover GH, Mueller BA, Liu TT, Voyvodic JT, Rasmussen J, Calhoun VD, Lee HJ, Toga AW, McEwen S, Ford JM, Mathalon DH, Diaz M, O'Leary DS, Jeremy Bockholt H, Gadde S, Preda A, Wible CG, Stern HS, Belger A, McCarthy G, Ozyurt B, Potkin SG. FBIRN. The Function Biomedical Informatics Research Network Data Repository. Neuroimage 2016;124:1074-9. [Crossref] [PubMed]
- Bennett CM, Miller MB. fMRI reliability: influences of task and experimental design. Cogn Affect Behav Neurosci 2013;13:690-702. [Crossref] [PubMed]
- Morrison MA, Churchill NW, Cusimano MD, Schweizer TA, Das S, Graham SJ. Reliability of Task-Based fMRI for Preoperative Planning: A Test-Retest Study in Brain Tumor Patients and Healthy Controls. Plos One 2016;11:e0149547. [Crossref] [PubMed]

