

Reproducibility and non-redundancy of radiomic features extracted from arterial phase CT scans in hepatocellular carcinoma patients: impact of tumor segmentation variability
Introduction
Hepatocellular carcinoma (HCC) is one of the most prevalent cancers in the world and has a poor prognosis (1). It is the leading cause of cancer death in men before the age of 60, followed by lung and stomach cancer, which are the dominant types of cancer with respect to the number of cases and deaths between the ages of 60 to 74 years in China (2).
As a fundamental component of clinical oncology, medical imaging plays a pivotal role in cancer staging, treatment planning, and treatment response monitoring, especially in radiotherapy (3-5). Due to the emergence of personalized medicine and targeted therapy, the need for quantitative image analysis has increased with the explosion of standard medical data. A series of publications have reported a strong relationship between medical imaging features and the underlying tumor genetics, which may provide a biological basis for clinical applications of quantitative imaging (6-8). Moreover, technological progress in computational imaging, data mining and predictive analysis broaden the scope of imaging in clinical oncology (9). In recent years, a technique for converting medical images into minable data by extracting a large number of quantitative imaging features, termed “radiomics”, has become an emerging field in quantitative imaging using advanced methods (10). Due to advances in the acquisition and analysis of medical imaging, it is currently possible to objectively and quantitatively describe tumor phenotypes (11,12). Furthermore, by utilizing quantitative imaging features as predictors of cancer genetics and clinical outcomes, quantitative imaging biomarkers (i.e., radiomics) may have important applications in personalized tumor therapy (12).
However, before radiomic features can be applied in clinical practice, several challenges, including the standardization and robustness of selected features, must be addressed (11,13). One of the main challenges of radiomics is the reproducibility of quantitative imaging features (9,14,15). Not all radiomic features are recommended for use due to a lack of stability. For instance, if the effect of tumor segmentation variability (attributable to differences in segmentation results obtained via manual delineation and semi-automated approaches) on radiomic features is unknown, tumor phenotypes may not be characterized accurately, and study findings may not be reproducible. Therefore, to provide robust and non-biased descriptors, it is essential to objectively and reproducibly quantify various imaging features. Potential image feature redundancy is another main challenge in radiomics (16,17). The radiomic approach generates hundreds of parameters, many of which may be redundant (18). Redundant features may add complexity to a radiomic study. A non-redundant set of radiomic biomarkers must be obtained to minimize overweighting of redundant imaging features.
With respect to tumor segmentation methods, few studies have evaluated the reproducibility of quantitative computed tomography (CT)-based imaging features in HCC. In this work, we present an experimental study of the robustness and reproducibility of radiomic features from arterial phase CT scan in HCC patients in terms of tumor segmentation variability. A hierarchical clustering method (19,20) was performed to reduce the redundancy of reproducible radiomic features. Our study may provide useful guidelines for selecting reasonable radiomic features in clinical practice for the design of HCC radiomic studies. This research may also be beneficial for radiomic investigations involving standardization of the quantification and predictive values of radiomic features. The workflow of this study is depicted in Figure 1.

Methods
Patient CT images
A total of 106 patients at Shandong Cancer Hospital Affiliated to Shandong University between December 2015 and October 2017 were randomly enrolled in this research. As a training data set, 26 HCC patients were used to calculate the features’ reproducibility and redundancy. Another data set (55 HCC patients and 25 healthy volunteers) was used for classification. All patients underwent liver CT scan (Phillips Medical Systems, Netherlands, CT Lightspeed 16) in the arterial phase of enhancement. The matrix size was 512 × 512 with a pixel spacing of 0.97 × 0.97 × 3.0 mm3 in the left–right, antero-posterior and cranio-caudal directions, respectively. This work was approved by the ethics committee of Shandong Cancer Hospital Affiliated to Shandong University (No. 201704088). The need for informed consent was waived by the Medical Ethics Committee because the study was an observational, retrospective study using a database from which the patients’ identifying information had been removed.
Tumor and healthy liver segmentation
Since many tumors have indistinct borders, segmentation is the most critical, challenging, and contentious component of radiomics (21). In this paper, manual delineations and two semi-automatic segmentation methods were applied to identify the differences in reproducibility of radiomic features resulting from the impact of segmentation methods.
- The gross tumor volume (GTV) of the primary tumor on the CT scans (window width 200 HU; window level 40 HU) for each patient was manually contoured independently by five specialized abdominal radiation oncologists. None of the radiation oncologists had access to clinical patient information other than the CT scans.
- For semi-automatic segmentation, the GrowCut algorithm and GraphCut algorithm were implemented separately in 3D-Slicer software (www.slicer.org). Then, two experienced abdominal radiation oncologists independently modified the semi-automatic segmentation results using the 3D-Slicer software.
- For healthy liver segmentation, 3 cylindrical volumes of interest (VOIs) with diameter approximate 30 mm and height 9 mm were randomly defined from parenchyma while avoiding the vessels.
Moreover, to assess the accordance of the manual delineation results and the semi-automatic segmentation results, the Hausdorff distance (HD) and the Dice’s similarity coefficient (DSC) were calculated in this study.
Radiomic features extraction
All radiomic feature calculations were performed using Imaging Biomarker Explorer (IBEX) software (MD Anderson Cancer Center, TX, USA), which is an open infrastructure software platform that streamlines common radiomic workflow tasks (22). In total, we extracted 71 quantitative image features (comprising 17 features describing tumor intensity, 16 shape features and 38 textural features), which were divided into 5 groups according to the feature calculation method: intensity histogram (17 features), co-occurrence matrix (22 features), neighbor gray-tone difference matrix (5 features), gray-level run-length matrix (11 features), and geometric shape (16 features). The definitions and interpretation of these features have been described previously (7,9).
Reproducibility of radiomic features
To quantify the feature reproducibility, the intra-class correlation coefficient (ICC) was employed. The ICC is an inferential statistic that describes how strongly units in the same group resemble each other. The ICC ranges from 0 to 1, where 0 indicates null and 1 indicates perfect reproducibility. The ICC was calculated as follows (23):
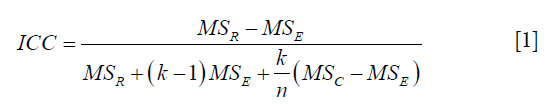
where MSR = mean square for rows (observations, fixed factor), MSE = mean square error, MSC = mean square for columns (observers, random factor), k = number of observers involved, and n = number of subjects.
We adopted Cicchetti’s quoted guidelines for interpretation for the ICC inter-rater agreement measures (24):
- Less than 0.40—poor;
- Between 0.40 and 0.59—fair;
- Between 0.60 and 0.74—good;
- Between 0.75 and 1.00—excellent.
In this study, we defined ICC≥0.75 as high reproducibility.
Non-redundancy of obtained radiomic biomarkers
In our experiment, hierarchical clustering was used to acquire the non-redundant imaging biomarkers based on the radiomic features with excellent reproducibility. We first computed the similarity measurement between all pairs of input features to be clustered (25). Two of the most similar clusters were combined into one cluster in the first step. The final result of the cluster was one individual radiomic feature or several radiomic features. Second, we built the relationship between the similarity threshold and the number of non-redundant clusters. After the similar clusters were generated, the redundant radiomic features within each cluster were combined into a new radiomic feature. The value of the new radiomic feature was the average value of the radiomic features in the cluster (20). To generate the number of non-correlated subgroups, R2 statistic method was used. A detailed description of R2 can be found in Supplementary Method.
In order to evaluate the utility of non-redundant feature extraction by hierarchical clustering, we performed an experiment to classify healthy liver tissue and HCC utilizing original radiomic features and cluster features. In this process, a supervised machine learning algorithm named support vector machine (SVM) was used. First, we trained the classification model based on 55 radiomic features including 17 intensity features and 38 textural features. Second, classification model trained with 6 non-redundant cluster features were calculated for comparison. Classification models were trained using the repeated (3 repeat iterations) 10-fold cross validation of training data, and the predictive performance was evaluated using area under curve (AUC) of receiver operating characteristic (ROC).
Due to the different value ranges of various radiomic features, z-score normalization was used to standardize all radiomic feature values before the cluster was finalized (20). Z-score normalization was performed as follows:
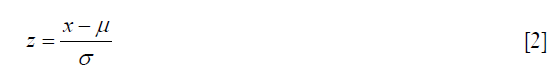
where µ is the mean value of the radiomic feature and σ is the standard deviation of the radiomic feature. All radiomic features were then scaled to a normalized value range.
Results
Segmentation results
The median (range) tumor volumes obtained by manual delineation, GrowCut segmentation and GraphCut segmentation were 21 (4.3–183.4) cm3, 16 (4.4–173.7) cm3 and 15 (4.7–159.5) cm3, respectively. The mean HD and mean DSC achieved 33.8 voxel and 0.842 respectively, between manual delineation results and GrowCut segmentation results. For manual delineation results and GraphCut segmentation results, the mean HD and the mean DSC were 31.3 voxel and 0.816 respectively. Volume variance may suffer from high uncertainty caused by segmentation methods. In addition, the value of the extracted radiomic features may differ due to variances in tumor segmentations uncertainty. Thus, it is important to identify whether the features extracted from the two types of semiautomatic segmentations capture the same tumor image properties as manual delineation. Therefore, we normalized every feature value with respect to the three segmentation methods. Figure 2 presents the normalized feature range between the manual and semi-automatic segmentations. The normalized value of the extracted radiomic features based on semi-automatic segmentations presented a smaller range compared with manual delineation. Furthermore, as shown in Figure 2, the GrowCut algorithm exhibited greater stability than the GraphCut algorithm in terms of the value of the extracted radiomic features.

Reproducibility of radiomic features on multiple segmentation methods
To quantitatively compare the reproducibility of the radiomic features for HCC for the three segmentation methods, we divided the ICC value into four groups: poor (less than 0.40), fair (between 0.40 and 0.59), good (between 0.60 and 0.74) and excellent (between 0.75 and 1.00). Figure 3 presents the percentage of ICC values for the three segmentation methods. The radiomic features extracted from the semi-automatic segmentation methods had higher reproducibility than the features extracted from the manual segmentation. Notably, the excellent reproducibility percentage in the GrowCut algorithm group was higher than that in the GraphCut algorithm group (79% vs. 73%). The percentage of excellent-reproducibility features describing tumor intensity in the manual delineation group, GraphCut algorithm group, and GrowCut algorithm group was 65% (11 features), 58% (10 features) and 76% (13 features), respectively. The percentage of excellent-reproducibility features describing shape features in the manual delineation group, GraphCut algorithm group, and GrowCut algorithm group was 69% (11 features), 69% (11 features), and 63% (10 features), respectively. The percentage of excellent-reproducibility features describing textural features in the manual delineation group, GraphCut algorithm group, and GrowCut algorithm group was 71% (27 features), 82% (31 features), and 87% (33 features), respectively. In addition, the ICC value was over 0.75 for all segmentation methods for approximately 65% (46 features) of the features.

Feature redundancy reduction
Figure 4 depicts the hierarchical cluster tree and the relationship between the similarity threshold and the number of clusters for the excellent-reproducibility radiomic features in the three segmentation methods. As shown in Figure 4A,B,C, several redundant radiomic features were clustered into the same subgroup because of very similar values (Z-scores). The R2 value was calculated at similarity threshold intervals of 0.05 (Figure 4D). The R2 value was discrepant in partial areas for the different segmentation methods. On the basis of the observed results, the suitable number of non-correlated subgroups were selected as shown in Figure 4E. The optimal number was 9, 13 and 11 for manual delineation, GraphCut segmentation and GrowCut segmentation, respectively. However, if we applied the same reproducibility features (all ICC values between 0.75 and 1.00) to the cluster for the three segmentations, different results were obtained for the hierarchical cluster tree and the relationship between the similarity threshold and the number of clusters (Figure 5). As shown in Figure 5D, the optimal number of non-correlated subgroups was 6 in all cases. The clustered 6 non-redundant feature groups and the features in each group are summarized in Table 1. Additionally, significant difference was observed in clusters 1 to 5 (Figure S1). Figure 6 depicts the ROC plots of the two classification models for healthy liver tissue and HCC. ROC analysis showed that the AUC value was 0.857, with 0.866 sensitivity and 0.840 specificity in the classification with feature reduction. However, the AUC value was only 0.721, with 0.889 sensitivity and 0.640 specificity in the classification without feature reduction. A detailed description can be found in Supplementary Results.


Full table


Discussion
Many studies have demonstrated that radiomic features are related to tumor histology (26), tumor stage (27), patient survival (28), metabolism (29), and several additional clinical outcomes (30-32). Recently, a group of experts assembled from Cancer Research UK (CRUK) and the European Organization for Research and Treatment of Cancer (EORTC) produced 14 key recommendations for accelerating the clinical translation of radiomics (33). Two of the recommendations were imaging biomarker standardization and continual revisiting of imaging biomarker precision (33). Research on the reproducibility and non-redundancy of radiomic features is therefore essential to promote standardization and improve the precision of data from multi-modality medical images across institutions. Tumor segmentation is the most critical and contentious component of radiomics because the analysis of subsequent feature data rely on the tumor segmentation results (11,34). As the routine method of segmentation in the clinic, manual delineation is time-consuming and prone to high variability due to the indistinct borders of many tumors. Semi-automatic approaches are fast and can reduce the inter-observer variability (9,34). Furthermore, for a specific cancer and imaging modality, it is essential to identify the data variability with respect to the tumor segmentation process. Few studies have evaluated the reproducibility and the non-redundancy of radiomic features in HCC CT scans. Here, we explore this question with the aim of providing fundamental data and obtaining the most reliable and non-redundant radiomic features of HCC. In addition, we intend to promote standardization and improve precision in the context of HCC radiomics study.
In this report, we present an experimental study of the reproducibility and non-redundancy of radiomic features in HCC CT scans. Consistent with the overwhelming evidence in the literature (9), we observed that the semi-automation of the GTV of the primary tumor provides a better alternative to manual delineation for feature quantification by yielding more reproducible imaging descriptors. However, we also found that the results may be influenced by the semi-automated algorithm. The number of high-reproducibility features generated in the GrowCut algorithm group was greater than that generated in the GraphCut algorithm group. The number of non-redundant feature groups for the excellent-reproducibility radiomic features may also be influenced by the segmentation method. Nevertheless, the variability can be reduced by selecting the collectively high-reproducibility features for clustering. Because of imaging changes in cancer tissue are due to changes at the cellular level, a significant difference of clustered features may be observed in healthy and abnormal tissue. The classification results also showed that radiomic features with redundant reduction were more effective in identifying healthy liver and HCC. Therefore, the non-redundant features have strong discriminative power. This can be explained by the fact that redundant features do not increase the information of the data, but rather that the complexity of the model increased, and the correlation of redundant features were not processed when model training.
To ensure the reliability of the radiomic features, accurate and robust tumor contouring is essential. Semi-automatic segmentation of the primary tumor on CT demonstrated high agreement with manual delineation, and strong correlation with the macroscopic diameter is considered the ‘‘gold standard’’ (35). However, not all semi-automatic algorithms are appropriate for HCC delineation. GrowCut is an interactive region-growing segmentation strategy. The algorithm uses a competitive region-growing approach and is considered to provide good accuracy and speed for both two- and three-dimensional image segmentation (34). GraphCut is also an interactive segmentation strategy that is often used to find the globally optimal segmentation of the N-dimensional image (36). Each semi-automated algorithm may have specific applications, especially in medical images, due to distinctions in capturing tumor boundaries and/or the characteristics of tumor anatomical morphology.
As a rule of thumb, to examine the prognostic power of radiomic features and reduce the false discovery rate, datasets consisting of 10–15 patients per feature evaluated have been recommended (37). Hence, 26 patients with HCC were enrolled when assessing the reproducibility and redundancy in this study. Based on the results presented here, we anticipate that semi-automatic segmentation is likely to improve the reproducibility of imaging markers. Furthermore, to improve accuracy and maximally eliminate segmentation effects, a proper semi-automatic algorithm should be considered for various tumors with different imaging modalities. This study indicates that hierarchical clustering can provide robust radiomic feature clusters and reduce feature redundancy.
Because many radiomic features may be unreliable, reproducibility should be assessed early in radiomic signature development. Meanwhile, there is potential redundancy in hundreds of radiomics features which is extracted from defined regions of interest (ROIs). The redundant features may result in a complicated radiomic study. Moreover, it is essential that multicenter studies qualify radiomic features for clinical use due to the involvement of different research institutions, which usually utilize different tumor delineation methods. Our research identified the most reliable and uniform radiomic features that were independent of the tumor segmentation. These findings may be beneficial for multicenter trials focused on the clinical use of radiomics.
In cancer research, intrinsic intratumor heterogeneity should be fully captured in medical images (38). To investigate hypermetabolism, the necrotic area and hypoxic area of the tumor must be identified. In future work, intratumor segmentation will be used to identify subregions of HCC based on functional imaging. In turn, the radiomic features of these HCC subregions will be further studied. Due to the size of the present cohort, we were unable to associate these image descriptors with patient outcome. In future research, we will reveal useful prognostic imaging biomarkers and explore the correlation between radiomic features and clinical data. Moreover, molecular biology experiments should reveal the mechanisms responsible for the ability of quantitative features to predict clinical prognosis.
Conclusions
Our study reveals that variations exist in the reproducibility of quantitative imaging features extracted from tumor regions segmented using different methods. The reproducibility and non-redundancy of the radiomic features rely greatly on the tumor segmentation in HCC CT images. Our study shows that semi-automatic segmentation is likely to improve the reproducibility of imaging markers and hierarchical clustering can provide robust radiomic feature clusters and reduce feature redundancy. Furthermore, to guarantee the segmentation precision and maximally eliminate segmentation effects, a proper semi-automatic algorithm should be considered for various tumors with different imaging modalities. We recommend that the most reliable and uniform radiomic features should be selected in the clinical use of radiomics.
Supplementary method
In order to determine the optimal number of clusters in hierarchical clustering trees, The R2 statistic method was used. It was defined as follows:
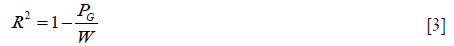
Where PG= sum of squared deviation within clusters, W= sums of squared deviation for total.
The detailed calculating process was as follows:
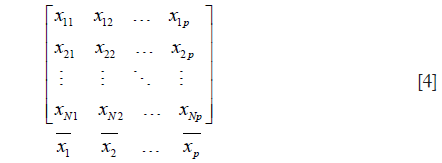
- The matrix M contains N variables which were arranged in rows.
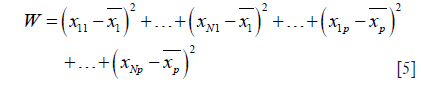
- Calculate the sum of squared deviation for total W:
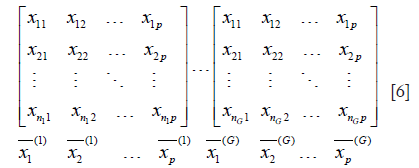
- If M was divided into G groups, then becomes matrix below:
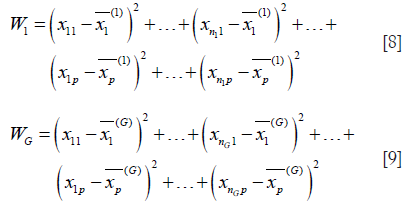
- Calculate the sum of squared deviation within clusters PG:
- Then the Eq. [3] was used to calculate R2.
Where n1+n2+…+nG = N.

Where W1, W2,…,WG = sum of squared deviation for total in each cluster.
In this study, a high threshold resulted in fewer subgroups, whereas a low threshold resulted in a large number of groups. The suitable number of non-redundant subgroups was based on the condition of a sufficiently large value of R2; however, the number of subgroups was comparatively small and the value of R2 did not observably increase.
The steps are as follows:
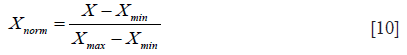
- First, we normalized the original data of each feature in cluster 1, 2, .., using Min–Max Normalization; the formula is as follows:
- Secondly, we calculated the mean value of each cluster for the HCC and healthy group (Tables S1,S2);
- Finally, a Wilcoxon test was used for each cluster to compared the difference between the two groups (Figure S1). P<0.05 was considered statistically significant.

Full table

Full table
Supplementary results
Detailed results and descriptions of machine learning based classification:
- Classification method name: support vector machine (SVM), a supervised machine learning algorithm.
- A total of 106 sets of arterial CT images, including 26 HCC patients (for reproducibility and redundancy assessment), 55 HCC patients and 25 healthy patients (for classification).
- Modeling data composition (Table S3).

Full table
All feature values were normalized into range [0, 1], and each feature in the above table was the average value of six feature groups. All the feature was normalized using Z-score normalization: in response, 1 for HCC and 0 for healthy.
- Parameters:
- SVM, with Gaussian kernel function was implemented in MATLAB R2014a.
- Classification models were trained using the repeated (3 repeat iterations) 10-fold cross validation of training data and their predictive performance was evaluated using area under ROC curve (AUC).
- 10-fold cross validation: it partitioned all the data into 10 individual subsets randomly with equal sized patients. A single subset is retained as validation data for testing the SVM classifier which is trained by other 9 subsets.
- Inputs and AUC of SVM models (Table S4).
- ROC curve (Figures S2,S3).

Full table


Acknowledgements
The authors would like to thank Dr. Lifei Zhang from the University of Texas MD Anderson Cancer Center for assistance in our experiments.
Funding: This research was supported by the Shandong Natural Science Foundation (Grant No. ZR2017PH071), the WBE Liver Fibrosis Foundation (Grant No. CFHPC2019027), the National Key Research and Development Program of China (Grant No. 2017YFC0113202), the National Nature Science Foundation of China (Grant No. 81472811 and 81671785), and the Key Research and Development Program of Shandong Province (Grant No. 2018GSF118006).
Footnote
Conflicts of Interest: The authors have no conflicts of interest to declare.
Ethical Statement: This work was approved by the ethics committee of Shandong Cancer Hospital Affiliated to Shandong University (No. 201704088). The need for informed consent was waived by the Medical Ethics Committee because the study was an observational, retrospective study using a database from which the patients’ identifying information had been removed.
References
- Siegel RL. Miller KDJemal A. Cancer statistics, 2016. CA Cancer J Clin 2016;66:7-30. [Crossref] [PubMed]
- Chen W, Zheng R, Baade PD, Zhang S, Zeng H, Bray F, Jemal A, Yu XQ, He J. Cancer statistics in China, 2015. CA Cancer J Clin 2016;66:115-32. [Crossref] [PubMed]
- Fass L. Imaging and cancer: a review. Mol Oncol 2008;2:115-52. [Crossref] [PubMed]
- Torigian DA, Huang SS, Houseni M, Alavi A. Functional Imaging of Cancer with Emphasis on Molecular Techniques. CA Cancer J Clin 2007;57:206-24. [Crossref] [PubMed]
- Hou Z, Yang Y, Li S, Yan J, Ren W, Liu J, Wang K, Liu B, Wan S. Radiomic analysis using contrast-enhanced CT: predict treatment response to pulsed low dose rate radiotherapy in gastric carcinoma with abdominal cavity metastasis. Quant Imaging Med Surg 2018;8:410-20. [Crossref] [PubMed]
- Segal E, Sirlin CB, Ooi C, Adler AS, Gollub J, Chen X, Chan BK, Matcuk GR, Barry CT, Chang HY. Decoding global gene expression programs in liver cancer by noninvasive imaging. Nat Biotechnol 2007;25:675-80. [Crossref] [PubMed]
- Aerts HJ, Velazquez ER, Leijenaar RT, Parmar C, Grossmann P, Cavalho S, Bussink J, Monshouwer R, Haibe-Kains B, Rietveld D. Decoding tumour phenotype by noninvasive imaging using a quantitative radiomics approach. Nat Commun 2014;5:4006. [Crossref] [PubMed]
- Panth KM, Leijenaar RT, Carvalho S, Lieuwes NG, Yaromina A, Dubois L, Lambin P. Is there a causal relationship between genetic changes and radiomics-based image features? An in vivo preclinical experiment with doxycycline inducible GADD34 tumor cells. Radiother Oncol 2015;116:462-6. [Crossref] [PubMed]
- Parmar C, Velazquez ER, Leijenaar R, Jermoumi M, Carvalho S, Mak RH, Mitra S, Shankar BU. Kikinis RHaibe-Kains B. Robust radiomics feature quantification using semiautomatic volumetric segmentation. PLoS one 2014;9:e102107. [Crossref] [PubMed]
- Lambin P, Rios-Velazquez E, Leijenaar R, Carvalho S, van Stiphout RG, Granton P, Zegers CM, Gillies R, Boellard R, Dekker A. Radiomics: extracting more information from medical images using advanced feature analysis. Eur J Cancer 2012;48:441-6. [Crossref] [PubMed]
- Yip SS, Aerts H. Applications and limitations of radiomics. Phys Med Biol 2016;61:R150-66. [Crossref] [PubMed]
- Lambin P, Zindler J, Vanneste BG, Van De Voorde L, Eekers D, Compter I, Panth KM, Peerlings J, Larue RT, Deist TM. Decision support systems for personalized and participative radiation oncology. Adv Drug Deliv Rev 2017;109:131-53. [Crossref] [PubMed]
- Leijenaar RT, Nalbantov G, Carvalho S, Van Elmpt WJ, Troost EG, Boellaard R, Aerts HJ, Gillies RJ, Lambin P. The effect of SUV discretization in quantitative FDG-PET Radiomics: the need for standardized methodology in tumor texture analysis. Sci Rep 2015;5:11075. [Crossref] [PubMed]
- Hu P, Wang J, Zhong H, Zhou Z, Shen L, Hu W, Zhang Z. Reproducibility with repeat CT in radiomics study for rectal cancer. Oncotarget 2016;7:71440. [Crossref] [PubMed]
- Zhao B, Tan Y, Tsai WY, Qi J, Xie C, Lu L, Schwartz LH. Reproducibility of radiomics for deciphering tumor phenotype with imaging. Sci Rep 2016;6:23428. [Crossref] [PubMed]
- Parmar C, Leijenaar RT, Grossmann P, Velazquez ER, Bussink J, Rietveld D, Rietbergen MM, Haibe-Kains B, Lambin P, Aerts HJ. Radiomic feature clusters and prognostic signatures specific for lung and head & neck cancer. Sci Rep 2015;5:srep11044.
- Lopez CJ, Nagornaya N, Parra NA, Kwon D, Ishkanian F, Markoe AM, Maudsley A, Stoyanova R. Association of radiomics and metabolic tumor volumes in radiation treatment of glioblastoma multiforme. Int J Radiat Oncol Biol Phys 2017;97:586-95. [Crossref] [PubMed]
- Balagurunathan Y, Gu Y, Wang H, Kumar V, Grove O, Hawkins S, Kim J, Goldgof DB, Hall LO, Gatenby RA. Reproducibility and prognosis of quantitative features extracted from CT images. Transl Oncol 2014;7:72-87. [Crossref] [PubMed]
- Hunter LA, Krafft S, Stingo F, Choi H, Martel MK, Kry SF, Court LE. High quality machine-robust image features: Identification in nonsmall cell lung cancer computed tomography images. Med Phys 2013;40:121916. [Crossref] [PubMed]
- Lu L, Ehmke RC, Schwartz LH, Zhao B. Assessing agreement between radiomic features computed for multiple CT imaging settings. PLoS One 2016;11:e0166550. [Crossref] [PubMed]
- Gillies RJ, Kinahan PE, Hricak H. Radiomics: images are more than pictures, they are data. Radiology 2016;278:563-77. [Crossref] [PubMed]
- Zhang L, Fried DV, Fave XJ, Hunter LA, Yang J, Court LE. IBEX: an open infrastructure software platform to facilitate collaborative work in radiomics. Med Phys 2015;42:1341-53. [Crossref] [PubMed]
- Leijenaar RT, Carvalho S, Velazquez ER, Van Elmpt WJ, Parmar C, Hoekstra OS, Hoekstra CJ, Boellaard R, Dekker AL, Gillies RJ. Stability of FDG-PET Radiomics features: an integrated analysis of test-retest and inter-observer variability. Acta Oncol 2013;52:1391-7. [Crossref] [PubMed]
- Cicchetti DV. Guidelines, criteria, and rules of thumb for evaluating normed and standardized assessment instruments in psychology. Psychol Assess 1994;6:284. [Crossref]
- Bar-Joseph Z, Gifford DK, Jaakkola TS. Fast optimal leaf ordering for hierarchical clustering. Bioinformatics 2001;17:S22-9. [Crossref] [PubMed]
- Yokoo T, Wolfson T, Iwaisako K, Peterson MR, Mani H, Goodman Z, Changchien C, Middleton MS, Gamst AC, Mazhar SM, Kono Y, Ho SB, Sirlin CB. Evaluation of Liver Fibrosis Using Texture Analysis on Combined-Contrast-Enhanced Magnetic Resonance Images at 3.0T. Biomed Res Int 2015;2015:387653. [Crossref] [PubMed]
- Mu W, Chen Z, Liang Y, Shen W, Yang F, Dai R, Wu N, Tian J. Staging of cervical cancer based on tumor heterogeneity characterized by texture features on 18F-FDG PET images. Phys Med Biol 2015;60:5123-39. [Crossref] [PubMed]
- Cook GJ, Yip C, Siddique M, Goh V, Chicklore S, Roy A, Marsden P, Ahmad S, Landau D. Are pretreatment 18F-FDG PET tumor textural features in non–small cell lung cancer associated with response and survival after chemoradiotherapy? J Nucl Med 2013;54:19-26. [Crossref] [PubMed]
- Cui Y, Tha KK, Terasaka S, Yamaguchi S, Wang J, Kudo K, Xing L, Shirato H, Li R. Prognostic imaging biomarkers in glioblastoma: development and independent validation on the basis of multiregion and quantitative analysis of MR images. Radiology 2016;278:546-53. [Crossref] [PubMed]
- Huynh E, Coroller TP, Narayan V, Agrawal V, Romano J, Franco I, Parmar C, Hou Y, Mak RH, Aerts HJ. Associations of radiomic data extracted from static and respiratory-gated CT scans with disease recurrence in lung cancer patients treated with SBRT. PLoS One 2017;12:e0169172. [Crossref] [PubMed]
- Coroller TP, Grossmann P, Hou Y, Velazquez ER, Leijenaar RT, Hermann G, Lambin P, Haibe-Kains B, Mak RH, Aerts HJ. CT-based radiomic signature predicts distant metastasis in lung adenocarcinoma. Radiother Oncol 2015;114:345-50. [Crossref] [PubMed]
- Mazzei MA, Nardone V, Di Giacomo L, Bagnacci G, Gentili F, Tini P, Marrelli D. The role of delta radiomics in gastric cancer. Quant Imaging Med Surg 2018;8:719-21. [Crossref] [PubMed]
- O’Connor JP, Aboagye EO, Adams JE, Aerts HJ, Barrington SF, Beer AJ, Boellaard R, Bohndiek SE, Brady M, Brown G. Imaging biomarker roadmap for cancer studies. Nat Rev Clin Oncol 2017;14:169-86. [Crossref] [PubMed]
- Velazquez ER, Parmar C, Jermoumi M, Mak RH, Van Baardwijk A, Fennessy FM, Lewis JH, De Ruysscher D, Kikinis R, Lambin P. Volumetric CT-based segmentation of NSCLC using 3D-Slicer. Sci Rep 2013;3:3529. [Crossref] [PubMed]
- Rios Velazquez E, Aerts HJ, Gu Y, Goldgof DB, De Ruysscher D, Dekker A, Korn R, Gillies RJ, Lambin P. A semiautomatic CT-based ensemble segmentation of lung tumors: Comparison with oncologists’ delineations and with the surgical specimen. Radiother Oncol 2012;105:167-73. [Crossref] [PubMed]
- Boykov YY, Jolly MP. Interactive graph cuts for optimal boundary & region segmentation of objects in ND images. Computer Vision, 2001. ICCV 2001. Proceedings. Eighth IEEE International Conference on, IEEE.
- Chalkidou A, O’Doherty MJ, Marsden PK. False discovery rates in PET and CT studies with texture features: a systematic review. PLoS One 2015;10:e0124165. [Crossref] [PubMed]
- Sottoriva A, Spiteri I, Piccirillo SG, Touloumis A, Collins VP, Marioni JC, Curtis C, Watts C, Tavaré S. Intratumor heterogeneity in human glioblastoma reflects cancer evolutionary dynamics. Proc Natl Acad Sci U S A 2013;110:4009-14. [Crossref] [PubMed]

