

Intravoxel incoherent motion derived liver perfusion/diffusion readouts can be reliable biomarker for the detection of viral hepatitis B induced liver fibrosis
Introduction
Chronic liver disease is a major public health problem worldwide, accounted for approximately 1.3 million deaths worldwide in 2015 (1). Viral hepatitis is the most common blood-borne infection globally. The end result of untreated chronic liver disease is inflammation, loss of liver parenchyma, and healing by fibrosis and regeneration. The response of hepatocytes to inflammation plays a decisive role in the physiopathology of hepatic fibrosis, which involves the recruitment of both pro- and anti-inflammatory cells such as monocytes and macrophages. These processes amplify the response throughout the production of other cytokines and chemokines, which increase the stimulus of hepatic stellate cells by activating proinflammatory cells. Fibrogenic cytokines, such as transforming growth factor beta (TGF-β), activated by macrophages facilitate the trans-differentiation of stellate cells to myofibroblasts, which are the main source of production of extracellular matrix. Originally considered to be irreversible, hepatic fibrosis is now regarded as a dynamic process with the potential for regression. Earlier stage liver fibrosis is more amenable to therapeutic intervention. In the early stages of fibrosis when the cause has been treated (e.g., hepatitis B or C), regression occurs in at least 70% of patients with the right antiviral management (2,3). The regression of liver fibrosis can be complete in early stages, whereas partial and prolonged recovery occurs in late or advanced stages (4). Treatment with combined therapies on underline etiology and fibrosis simultaneously might expedite the regression of liver fibrosis and promote liver regeneration. Early detection of liver fibrosis is important for early institution of treatment and assessing potential for regression and prognosis.
Currently there is no established non-invasive diagnostic method to detect and grade early stage liver fibrosis (5). The reference standard for detection and staging of liver fibrosis remains being biopsy; however, it is invasive and frequently causes pain and discomfort, with risk of bleeding and hospitalization and also not suitable for longitudinal monitoring. The most clinically used imaging technique for evaluation of liver fibrosis is ultrasound elastography, while the investigational technique of MR elastography has undergone many promising clinical trials. The requirement for an external driver is considered a disadvantage for MR elastography. As intravoxel incoherent motion (IVIM) imaging sequence is widely available in clinical MR scanners and there is no need for external device, it represents a convenient alternative to existing techniques for liver fibrosis evaluation. It is well accepted that liver fibrosis is associated with reduced liver perfusion (6-9), and progressive loss of endothelial fenestration and deposition of collagen in the space of Disse. These processes reduce the rate of blood flow and prolong its transit time. Recently there has been a great interest of using IVIM technique to study diffused liver diseases such as liver fibrosis (10).
Recently we published two small cohort studies (11,12), our results suggested that liver IVIM analysis completely separated healthy volunteers and viral hepatitis B (VHB) induced liver fibrosis patients. Interestingly, the IVIM measurements of four VHB patients who showed no liver fibrosis by biopsy resembled those of healthy volunteers (12). Moreover, the signal difference between b =0 s/mm2 image and very low b value image (such as b =1 or 2 s/mm2) can be very substantial, the vessels (including small vessels) particularly show high signal without diffusion gradient while showing dark signal when the diffusion gradient is on even at b =1 s/mm2; thus if the diffusion image signal decay is computed starting from b =0 s/mm2 image and then increasingly higher b values, then this decay process may not follow a biexponential model for region of interest (ROI) based analysis (13). In our two published studies we dealt this difficulty by ignoring the b =0 images, and take the assumption that the remaining signal vs. b value relationship follows a bi-exponential decay (11,13). This simplistic approach seems worked well in our published cases. However, in our two last studies, the starting b value for bi-exponential decay analysis was b =10 s/mm2 and b =15 s/mm2 respectively, thus very low b values were not available for computing IVIM parameters. This study has two primary aims. The first is to further confirm the diagnostic value of IVIM in detecting liver fibrosis. The second is to test whether by sampling very low b value densely, then b =0 s/mm2 image could be included to improve IVIM’s diagnostic performance for liver fibrosis detection.
Methods
This was a prospective study with MRI data acquired at the Third Xiangya Hospital of Central South University, Changsha, China. The study was approved by the institutional ethical committee of the Third Xiangya Hospital, and the informed consent was obtained for all the study subjects. Twenty-four healthy volunteers and 28 consecutive patients suspected of VHB induced liver fibrosis with liver biopsy results (pa1–pa20, and pb1–pb8), as well as 13 consecutive hepatocellular carcinoma (HCC) patients scheduled for surgery (pc1–pc13), were recruited. All the hepatocellular carcinoma patients had liver fibrosis. The biopsy and histology results of eight patients (pb1–pb8) was evaluated at the Second Xiangya Hospital of Central South University, while all other patients were evaluated at the Third Xiangya Hospital. For patients with chronic VHB, biopsy samples of ≥1.5 cm in length were taken from liver right lobe using 18-G sized needles under CT-guidance. For HCC patients, liver tissue adjacent to the resected tumor was processed for staging fibrosis and inflammation. The histology diagnosis and grading for liver fibrosis and inflammation was based on the widely accepted standard (METAVIR score for fibrosis) (14,15).
Magnetic resonance imaging (MRI) and liver biopsy or surgery were performed with less than 1-month interval. MRI was performed with a 3-T magnet with 32-channel abdominal phased-array coil (Ingenia, Philips Healthcare, Best, The Netherlands). In addition to standard clinical sequences, IVIM diffusion imaging was based on a single-shot spin-echo type echo-planar sequence, with 16 b values of 0, 2, 5, 10, 15, 20, 25, 30, 40, 60, 80, 100, 150, 200, 400, and 600 s/mm2. Number of excitations (NEX) was 1 for b values of 0–150 s/mm2, and NEX was 2 for 400 and 600 s/mm2. SPIR technique (Spectral Pre-saturation with Inversion-Recovery) was used for fat suppression. Respiratory-gating was applied and resulted in an average TR of 871 ms, and the TE was 57 ms. Other parameters included matrix =116×119, field of view =350×372, slice thickness =6 mm, inter-slice gap =1.5 mm, number of slices =23. The data acquisition period was December 22, 2017 to December 13, 2018.
After MRI data acquisition, we performed a data quality assessment prior to IVIM analysis as described in our reports (12,16). Due to the factor that the balloon used for respiratory gating was found to be leaky when the study started, images of the initial three patients (pa1–pa3) and three of initial five volunteers (v1, v4, v5) were of insufficient image quality and thus excluded (Figure S1). During the remaining study period, one volunteer (v20) and four HCC patients were considered to have insufficient imaging quality (pc3, pc11–pc13), and two liver fibrosis patients had insufficient curve fitting quality (pa16, pb8) (Figure S2), resulting in a success rate of 95% (20/21) for volunteers and 84% (32/38) for patients.


After the exclusions described above, there were 20 healthy volunteers (10 males, 10 females; mean age: 28.3 years; range, 24–58 years), 4 patients had chronic VHB but biopsy did not show liver fibrosis (group-1, all with inflammation grade-1), 11 patients had stage-1 liver fibrosis (group-2), 10 patients had stage-2 liver fibrosis (group-3), and 2 and 5 patients respectively had stage-3 and stage-4 liver fibrosis (group-4). In the patient group, there were 24 males and 8 females, the mean age was 42.1 years (range, 21–65 years). In the liver fibrosis patients, 1 case had inflammation grade-0, 19 cases had inflammation grade-1, and 8 cases had inflammation grade-2. Overall, the correlation between fibrosis grading and inflammation grading was weakly positive (Figure S3).

All the study subjects’ results were processed once by a trained reader (N Che-Nordin). For IVIM image processing, ROIs were placed to cover a large portion of right liver parenchyma while avoiding large vessels on b =2 s/mm2 image (or on b =0 s/mm2 image, or b =5 s/mm2 image/b =10 s/mm2 image, see paragraphs below) of the selected b value image series, with large vessels locations checked on b =0 s/mm2 image. With the consideration of respiration induced position shift of the same slice data acquisition during different b values, sufficient margins were allowed between the ROIs and the liver borders, large vessels and artifacts. ROIs were then copied and pasted on each corresponding image of each b values. For ROI analysis, the IVIM parameters were calculated based on the mean signal intensity of the whole ROIs, which offers better estimation than pixel-wise fitting when the signal-to-noise ratio (SNR) of images is low (17,18). The mean signal intensity of each ROI was weighted by the number of pixels included in each ROI, then the average of the weighted mean signal intensity of individual slice’s ROIs was calculated to obtain the average signal value of the liver.
Curve-fitting algorithms were implemented in a custom program developed on MATLAB (Mathworks, Natick, MA, USA). Based on our recent experiences (11-13), the analysis was performed with b =2 s/mm2 image as the starting point, and segmented fitting with a threshold-b (Shb) of 60 s/mm2 was selected. The signal value at each b value was normalized by attributing a value of 100 at b =2 s/mm2 [Snorm = (SI/SI2) ×100, where Snorm is the normalized signal, SI = signal at a given b value, and SI2 = signal at b =2 s/mm2]. For bi-compartmental model, the signal attenuation was modeled according to Eq. [1]:
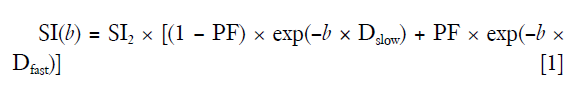
where SI(b) and SI2 denote the signal intensity acquired with the b-factor value of b and b =2 s/mm2, respectively (13).
For segmented fitting, the estimation of Dslow was obtained by a least-square linear fitting of the logarithmized image intensity at Shb-values greater than 60 s/mm2 to a linear equation. The fitted line was then extrapolated to obtain an intercept at b =2 s/mm2, and the ratio between this intercept and SI2 gave an estimate of PF. Finally, the obtained Dslow and PF were substituted into Eq. [1] and non-linear least-square fitted against all b values to estimate Dfast using Trust-Region algorithm (Figure 1).

As noted above, in this study the reference results were the results computed using segmented fitting with Shb =60 s/mm2 and starting from b =2 s/mm2 (Analysis-1). These results were then compared with results of: (I) using segmented fitting with Shb =40 s/mm2 and starting from 2 s/mm2 (Analysis-2); (II) full fitting started from b =2 s/mm2 (Analysis-3); (III) using segmented fitting with Shb =60 s/mm2 and starting from b =0 s/mm2 (Analysis-4); (IV) using segmented fitting with Shb =40 s/mm2 and starting from b =0 s/mm2 (Analysis-5); (V) using segmented fitting with Shb =60 s/mm2 and starting from b =5 s/mm2 (excluding b =0 and 2 s/mm2) (Analysis-6); (VI) using segmented fitting with Shb =60 and starting from b =10 s/mm2 (excluding b =0, 2 and =5 s/mm2) (Analysis-7). For the analysis starting from b =0, 5 s/mm2, the ROIs drawn on b =2 s/mm2 images were saved and reloaded for processing. For the analysis starting from b =10 s/mm2, new ROIs were also drawn based on b =10 s/mm2 images, and the IVIM parameter results based on the new ROIs and results based on ROIs of b =2 s/mm2 was compared and found they were broadly similar. Results based on the new ROIs on b =10 s/mm2 images were used to compare with other methods’ results.
For IVIM analysis methods comparison, two aspects were considered: (I) standard deviation and coefficient of variation (CoV) for healthy volunteers, and (II) the mean measurement for a patient group divided by the mean measurement for healthy volunteers [denoted as patient/volunteer (pt/vol) ratio in this study]. Taking the assumption that IVIM measurement variations among the healthy volunteers are more likely due to measurement imprecision rather than genuine physiological difference among the volunteers, then the computing method resulting in a smaller CoV is favored. The smaller the pt/vol ratio, the bigger the difference between the measurements for patients’ value and healthy volunteers’ value (if there is no difference between the mean value of healthy subjects and mean value of patients, then pt/vol ratio is 1); therefore, the computing approach resulting in a smaller pt/vol ratio is favored. In addition, among the three IVIM parameters, smallest pt/vol ratio and smallest CoV for PF will be favored, as PF offers the best diagnostic value for separating healthy volunteers and patients. The separations of healthy subjects and patient subjects were also visually assessed by a 3D tool. This 3D tool was programed using IBM SPSS 23 for Windows (SPSS Inc., Chicago, IL, USA), and the measurements of Dslow, PF, and Dfast were placed along the x-axis, y-axis, and z-axis (11). While the pt/vol ratio provide the mean separation between two groups, the 3D tool provided assessment for extreme values and outliers.
To investigate the potential correlation between IVIM readouts and liver function, three IVIM parameters derived from Analyses-1–7 were plotted against serum liver function biomarkers of total protein, albumin, alanine transaminase (ALT), aspartate transaminase (AST), total bilirubin and direct bilirubin. As this part of analysis was not statistically planned, emphasis was focused on the visual inspection of the graphs for potential correlation. Serum liver function biomarkers were not available for the healthy volunteers.
To assess the inter-reader ROI-based measurement’s reproducibility, 14 randomly selected patients (5 VHB patients and 9 HCC patients) were measured independently again by a radiology trainee (SW Qiu) who received a short period of training on how to draw ROI on liver parenchyma.
Results
The intraclass correlation coefficient (ICC) for inter-reader measurement reproducibility was 0.969, 0.95, and 0.83, for PF, Dfast and Dslow respectively, thus indicating good measurement reproducibility (Table S1).

Full table
The comparison of the seven analysis methods for healthy volunteers is shown in Table 1. As expected, Shb =40 s/mm2 was associated with slightly higher Dslow value compared with values computed with Shb =60 s/mm2. The smaller starting b values for bi-exponential analysis, and more so for b =0 s/mm2, were associated with larger PF and Dfast values. Among the seven analysis methods, Analysis-1 showed the smallest CoV for all PF, Dfast, and Dslow, thus the healthy volunteers data favored Analysis-1. The comparison of the seven analysis methods for three groups of patients is shown in Table 2. Analysis-1 showed the smallest pt/vol ratio for PF of F2 group and F3–4 group, smallest pt/vol for all three groups’ Dslow, smallest CoV for F2 group’s PF, and second smallest CoV for F1 group’s PF. Analysis-7 showed the smallest pt/vol ratio for F1 group’s PF, and the second smallest Dfast pt/vol for F1 group and the smallest Dfast pt/vol for F2 group. However, Analysis-7 was associated with relatively large CoVs. Thus, the following analyses were primarily performed using Analysis-1 data, and assisted by Analysis-7 when Analysis-7 showed advantages.

Full table

Full table
Using Analysis-1, the individual volunteers’ and patients’ data are shown in Tables 3,S2,S3 and graphically in Figure 2. The IVIM measures of four patients without liver fibrosis resembled those of healthy subjects. PF offered the best diagnostic value for separating healthy livers and fibrotic livers, and a threshold of 0.1406 separated all fibrotic livers and healthy livers with an exception of patient-C1 (a HCC patient with fibrosis grade-2/inflammation grade-2). C1’s PF, Dfast, and Dslow were 0.199, 47.5, and 1.01 respectively, all well within the range of healthy livers (Table 3). Figure 2 shows that there was no notable difference in the means of (all) PF, Dslow, and Dfast among the three fibrotic liver groups. Dfast offered little value in separating healthy livers from fibrotic livers, though the mean Dfast of F3–4 group was smaller than the other four groups. Figure 2D shows the Dfast values when Analysis-7 was applied, with a weak trend of more severe liver fibrosis associated with lower Dfast. Figure 3 shows, compared with fibrotic livers with inflammation grade-1, fibrotic livers with inflammation grade-2 showed a trend of higher Dfast.

Full table

Full table

Full table


Figure 4 shows 3D display of healthy volunteer group (green dots), patients without liver fibrosis group (yellow dots), liver fibrosis patient group (red dots). The differentiation of volunteers group and liver fibrosis patient group can be visualized by rotating in 3D space (dotted yellow line). The distribution of patients without liver fibrosis resembled healthy volunteers. Patient-C1 was in the healthy volunteer cluster.

Figure 5 shows potential correlation between PF/Dfast and serum liver function biomarkers. Weak correlation is shown with lower PF and lower Dfast associated with lower total protein, lower albumin; higher ALT, higher AST; higher total bilirubin, and higher direct bilirubin. No correlation was noted with Dslow and serum liver function biomarkers. Visual inspection showed, as compared with Analyses-2–6, the correlations between PF/Dfast and serum liver function biomarkers were better demonstrated with Analysis-1 or Analysis-7.

Discussion
IVIM diffusion imaging has the promise of obtaining in-vivo tissue perfusion/diffusion (PD) information non-invasively. However, its clinical diagnostic application at individual patient’s level has been challenging (10). In this study, the reference method was to compute IVIM results using segmented-fitting with Shb =60 s/mm2 and starting from b =2 s/mm2 (Analysis-1), and this method was compared with six other analysis methods (Analyses-2–7), representing our efforts to test and fine-tune data acquisition and data-post processing so to optimize these procedures. It can be expected that the experiences learned for liver fibrosis evaluation can also be useful for IVIM analysis of other pathologies and other organs, particularly perfusion-rich tissues. We recently argued that the commonly used IVIM analysis, where the diffusion image signal decay is computed starting from b =0 s/mm2 image and then increasingly higher b values using a bi-exponential decay model, may not be valid as this decay process may not follow a bi-exponential model for ROI-based analysis (13). A simplistic approach ignoring b=0 s/mm2 image seems worked well in our published series (11,12). The current study further confirmed that data analysis without b =0 s/mm2, particularly starting from b =2 s/mm2, outperformed data analysis where b =0 s/mm2 was included (Analyses-4 & 5). Since in our last two reports we used 10 and 15 s/mm2 as the starting lowest b value for bi-exponential analysis, in this study we tested if the addition of b =2 s/mm2 and b =5 s/mm2 would improve the diagnostic performance. This study indeed suggests that addition of b =2 s/mm2 and b =5 s/mm2 has improved the diagnostic performance compared with analysis using b =10 s/mm2 as the lowest b value for analysis.
This study shows that, overall, IVIM results using segmented-fitting with Shb =60 s/mm2 and starting from b =2 s/mm2 (Analysis-1) presented the best results compared with the other six methods; while Analysis-7, segmented-fitting starting from b =10 s/mm2, showed some advantages in computing Dfast (Figures 2D,5). We argued that the selection of signal decay model and fitting model may depend on the pathologies to be studied, multiple model analyses can be applied for the same pathology (19). We have shown that Shb =60 s/mm2 maximizes the distance between healthy livers data cluster and fibrotic livers cluster (20). While the difference between data computed with Shb =40, 60, or 80 s/mm2 was not big, the difference between data computed with Shb =60 and 200 s/mm2 was substantial (20). We also reported better scan-rescan repeatability and scan-rescan reproducibility for both PF and Dslow when Shb =50 or 80 s/mm2 as compared with when Shb =200 s/mm2 (16). Our more recent study also confirmed that Shb =60 s/mm2 outperforms Shb =200 s/mm2 for separating healthy livers and fibrotic livers (12). However, the lowest starting b value for IVIM analysis in those two studies was 10 and 15 s/mm2 respectively (11,12). Since in the current study lower b values of 2 and 5 s/mm2 were sampled, it would be theoretically possible a Shb lower than 60 s/mm2 might work better for separating healthy livers and fibrotic livers. However, this study shows that, when the lowest b value for analysis was 2 s/mm2, Shb =60 s/mm2 remained performing better than Shb =40 s/mm2. The limitations of full-fitting method have been previously noted. Park et al. (21) showed that full-fitting, particularly when used without constrains, may result in a large measurement error and a poor reliability of IVIM parameters when the image SNR is low. As the full-fitting method simultaneously fits all three parameters using a nonlinear least-square fitting algorithm, bad data points due to image noise may have led to erroneous fitting results, particularly when used without constrains, which can be exacerbated in low SNR settings. The segmented-fitting method, which estimates each IVIM parameter step-by-step, improves the reliability of IVIM parameters. Park et al. (21) suggested that for diffusion image data with a limited number of b values and a low SNR, segmented fitting methods should be preferred over full-fitting methods.
The same as our previous studies (11,12), this study shows, among the three IVIM parameters, PF showed the best diagnostic performance. However, the Dfast value calculated with analysis-1 did not meet our pre-study expectation. Despite we added very low b =2, 5 s/mm2, the diagnostic performance of Dfast was not good in this study (Figure 2C). This is likely due to the inclusion of these very low b values lead to the inclusion of the initial very fast decay for analysis; however, to quantify the initial very fast decay, very low b values remained insufficient even after b =2, 5 s/mm2 were added, thus Dfast’s variation among individuals increased. Even more very low b values may be required to reduce errors in Dfast estimation (22). Analysis-7 with fitting starting from b =10 s/mm2 showed a weak trend that the mean value of Dfast is lower in advanced fibrosis than milder fibrosis (Figure 2D). Analysis-7 also showed some advantages for correlations with serum liver function biomarkers (Figure 5). Though for the fibrotic livers of the current study, PF alone provides sufficient separation between healthy subjects and patients, it is expected analysis incorporating all three IVIM parameters would be useful for marginal cases (11).
Fibrosis, regenerative nodule formation, and intrahepatic vasoconstriction are classical mechanisms that account for increased intrahepatic vascular resistance in cirrhosis. Mechanisms responsible for the increase in sinusoid resistance include a mechanic factor which is a direct consequence of fibrosis deposition and a dynamic component related to endothelial dysfunction, deficient intrahepatic nitric oxide production, increased vasoconstrictor production, and other factors that promote the increased contraction of hepatic stellate cells (23-25). The results of our three studies, including this study and two recently reported studies (11,12), and numerous previous group-wise reports suggest the majority of fibrotic livers have decreased PD (10). This study showed four chronic VHB patients without fibrosis had IVIM measures resembled those of healthy volunteers, which supports our recent report that patients of chronic VHB without fibrosis could have normal liver PD (12). However, there was one apparent patient outlier, i.e., patient-C1 (fibrosis stage-2/inflammation stage-2) in this study. The image quality and fitting curve of this patient were quite acceptable (Figure S4). We additionally performed a preliminary analysis of the liver parenchyma signal difference between sb0 (signal at b =0 image) and sb2 (signal at b =2 image). This patient had (sb0 − sb2)/ROIarea =65.4 and (sb0 − sb2)/sb2 =0.29, indicating rich blood vessel density of liver parenchyma (13). IVIM measures the PD status of liver, rather than the histological structure and collagen deposition of fibrotic liver, it is not really unusual that some livers with fibrosis may have PD measures in normal range, particularly if apparent inflammation is present.

Though our results suggest IVIM results alone can contribute to a very large extent in separating healthy livers and fibrotic livers, and advanced stage liver fibrosis shows more disturbed PD than early stage liver fibrosis, IVIM has not been good at separating fibrotic livers into different severity groups defined by histopathological grading. This can be partially due to the imprecision of liver IVIM measurement and partially due to the tissue sampling bias and subjectivity of histopathological assessment. It is also highly probable that IVIM measures do not necessarily agree with histopathological grading at one-to-one individual patients’ level. This point has been suggested by previous CT perfusion studies (8,26,27). Thaiss et al. (26) reported portal-venous perfusion measured by CT was higher in liver fibrosis than in complete liver cirrhosis; however, they did not found correlation between perfusion CT parameters and Child-Pugh score or the clinical laboratory values. With perfusion CT, Ronot et al. (27) demonstrated that, compared with those with minimal fibrosis (F1), patients with intermediate fibrosis (F2 and F3) had decreased portal venous perfusion and total liver perfusion, while the mean transit time increased. Multivariate analysis showed only mean transit time was an independent factor; however, mean transit time allowed discrimination between minimal and intermediate fibrosis with a sensitivity of only 71% and a specificity of only 65%. Van Beers et al. (8) reported that perfusion CT demonstrated liver perfusion was decreased and mean transit time was increased in patients with cirrhosis; however, there were substantial overlaps among control subjects, patients with noncirrhotic chronic liver disease, and patients with liver cirrhosis. The correlation between severity of liver disease categorized in five classes (normal, noncirrhotic chronic liver disease, liver cirrhosis Child A, liver cirrhosis Child B, liver cirrhosis Child C) and perfusion CT parameters was only modest (8).
Previous studies showed that the presence of interface hepatitis in initial biopsies from patients with chronic viral hepatitis C correlates with subsequent development of cirrhosis; and an association between the severities of necroinflammatory activity in an initial biopsy and the development of fibrosis or cirrhosis in follow up biopsies (14). As expected, a weak positive association was noted between fibrosis grading and inflammation grading (Figure S3). In addition to fibrosis, the coexisting inflammation is likely to also influence liver PD.
This study shows a trend that, grade-2 inflammation might be associated with higher liver perfusion as compared with grade-1 inflammation (Figure 3). In interpreting Figure 3, it should be noted that, since higher grade of inflammation is (weakly) associated higher grade of fibrosis and liver fibrosis is associated with a decrease of PF, Dfast and Dslow (10,11), then if inflammation does not influence PD, grade-2 inflammation livers would demonstrate lower IVIM parameters. For example, since Figure 3 shows grade-1 inflammation livers and grade-2 inflammation livers had similar mean PF values, it is likely that inflammation might have already promoted higher PF. The interplay between fibrosis and inflammation might have complicated the relation between fibrosis severity and the amount of Dfast decrease.
The correlation between IVIM readouts of PF and Dfast and serum liver function biomarkers was noted in this study; however, these correlations were neither strong nor “clean”. Both IVIM readouts and liver function biomarkers have the measurement imprecision issue. In one study, Lazo et al. (28) reported that elevated AST, ALT, or bilirubin levels were reclassified as normal in more than 30% of retested individuals. γ-glutamyltransferase and alkaline phosphatase had approximately 15% of adults being reclassified as having normal levels after initially abnormal test results. On the other hand, these results could be unchanged, even after alcohol use, hepatitis infection status, and use of medications known to be hepatotoxic were taken into account. Fasting time can induce another variable for liver function serum biomarkers (29). Note patients with liver fibrosis do not necessarily demonstrate abnormal serum liver function biomarkers. In our study, serum liver function biomarkers were still in normal range for >50% of the patients. Therefore, it is not surprising that the correlation between IVIM readouts of PF and Dfast and serum liver function biomarkers were weak in this study. This study did not show correlation between Dslow and serum liver function biomarkers.
The correlation between IVIM readouts of PF and Dfast and liver fibrosis staging should also be viewed with the consideration that liver biopsy is an imperfect method to diagnose liver fibrosis. Needle liver biopsy has been shown to have a high rate of sampling error in patients with diffused parenchymal liver diseases. A liver biopsy samples only 1/50,000th of the liver parenchyma, as such the sample of liver tissue may not necessarily reflect the true degree of inflammation, fibrosis, or cirrhosis (30). Sampling errors even occur despite an adequate sample size and a satisfactory number of portal tracts. Regev et al. (31) reported a comparison between the right and left lobes yielded a difference of at least one stage of fibrosis in as many as 33.1% of viral hepatitis C patients, although differences greater than one stage or grade were uncommon. In addition, interpretation of cirrhosis was given in one lobe but not in the other in 14.5% cases. When grades of necroinflammatory activity were compared, a difference of at least one grade between the right and left lobes was found in 24.2% of the patients. Poynard et al. once proposed this question: Is there a true gold standard for liver fibrosis (32,33)? Non-invasive imaging has the advantage that it can potentially examine the whole liver with good spatial resolution.
This study has several limitations. All our patients had liver fibrosis due to VHB, whether results of our study can be generalized to liver fibrosis of other causes remains to be validated. Chronic liver disease causes include chronic viral hepatitis, alcohol, non-alcoholic fatty liver disease (NAFLD), hemochromatosis, alpha-1 antitrypsin deficiency, and cholestatic and autoimmune diseases. NAFLD is expected to rise with the high prevalence of obesity and type-2 diabetes worldwide (34). The detection of liver fibrosis in NAFLD is of high clinical importance as liver fibrosis is the single most important factor that determines long-term outcome in NAFLD patients (35). Since this study shows the addition of very low b values improved the diagnostic performance of liver IVIM, we assume there is still room for improvement with the b values used in this study; for example, we may include more very low b values such as 2, 3, 5, 8, 10 s/mm2 for future studies. This may be important as in this study Dfast alone performed poorly in separating healthy livers and fibrotic livers. When this study was started, the radiographers at the Changsha site were not experienced in performing IVIM data acquisition, so that the images of the first three patients and three of the first five volunteers were of all insufficient quality. Excluding the initial three volunteers and three patients, 95% (20/21) of volunteers and 84% (32/38) of patients had sufficient IVIM image quality for analysis. This success rate is similar to our recent experience (12). We expect as the radiographers gain experiences in acquiring IVIM images, the success rate is likely to increase. Moreover, the TR (=871 ms) used for IVIM was quite short in this study, so that the image quality as assessed subjectively was generally inferior to our previous studies performed in Shenzhen (TR =1,600 ms) and Nanjing (TR =2,149 ms) (11,12,16). The slice thickness (=6 mm) used in this study was also slightly thinner than our previous studies (Shenzhen, =7 mm). As this study was planned to be exploratory, we did not emphasize the statistics, instead we paid more attentions to the trends demonstrated in the results. We may leave the statistics to the final large-scale study or meta-analysis. Another limitation of this study is that our volunteers were younger than the patients. Lastly, as post-meal and fasted status may influence blood flow to the liver, it can be recommended in the future that all patients should fast for 6 hours before the MRI procedure (36).
In conclusion, we compared seven IVIM data analysis methods, and the results suggest that segmented-fitting with Shb =60 s/mm2 and starting from non-zero very low b value (b =2 s/mm2 in this study) outperformed other methods. Since our b value distribution might not have offered most reliable Dfast estimation, this study also showed segmented-fitting starting from a low b value of 10 s/mm2 was useful in some circumstances. This study further confirms the practical appropriateness of excluding b =0 s/mm2 for bi-exponential decay analysis, even two very low b values (b =2 and 5 s/mm2) were sampled in this study. This study demonstrates that IVIM has high sensitivity in detecting liver fibrosis, and PF and Dfast have potential correlation with serum liver function biomarkers. However, IVIM measures and liver fibrosis grading are not in a linear relationship, and this may also be complicated by that higher-grade liver inflammation might be associated with higher Dfast measure. In combination of our recent two studies, our data suggest that IVIM measures can be independent biomarkers for evaluating liver pathophysiology (37). In the meantime, we acknowledge that the liver IVIM data acquisition and post-processing methods remain to be further optimized.
Acknowledgements
Funding: This work was partially supported by grants from the National Natural Sciences Foundation of China (No. 81471715 and 81771827), Natural Sciences Foundation of Hunan province (No. 2017JJ2369), and a grant from the Research Grants Council of Hong Kong SAR (Project No. 2141061).
Footnote
Conflicts of Interest: The authors have no conflicts of interest to declare.
Ethical Statement: The study was approved by the institutional ethical committee of the Third Xiangya Hospital, and the informed consent was obtained for all the study subjects.
References
- GBD 2015 Mortality and Causes of Death Collaborators. Global, regional, and national life expectancy, all-cause mortality, and cause-specific mortality for 249 causes of death, 1980-2015: a systematic analysis for the Global Burden of Disease Study 2015. Lancet 2016;388:1459-544. [Crossref] [PubMed]
- Marcellin P, Gane E, Buti M, Afdhal N, Sievert W, Jacobson IM, Washington MK, Germanidis G, Flaherty JF, Aguilar Schall R, Bornstein JD, Kitrinos KM, Subramanian GM, McHutchison JG, Heathcote EJ. Regression of cirrhosis during treatment with tenofovir disoproxil fumarate for chronic hepatitis B: a 5-year open-label follow-up study. Lancet 2013;381:468-75. [Crossref] [PubMed]
- D'Ambrosio R, Aghemo A, Rumi MG, Ronchi G, Donato MF, Paradis V, Colombo M, Bedossa P. A morphometric and immunohistochemical study to assess the benefit of a sustained virological response in hepatitis C virus patients with cirrhosis. Hepatology 2012;56:532-43. [Crossref] [PubMed]
- Campana L, Iredale JP. Regression of liver fibrosis. Semin Liver Dis 2017;37:1-10. [Crossref] [PubMed]
- Patel K, Shackel NA. Current Status of Fibrosis Markers. Curr Opin Gastroenterol 2014;30:253-9. [Crossref] [PubMed]
- Moreno AH, Burchell AR, Rousselot LM, Panke WF, Slafsky F, Burke JH. Portal Blood Flow in Cirrhosis of the Liver. J Clin Invest 1967;46:436-45. [Crossref] [PubMed]
- Iwakiri Y, Groszmann RJ. The Hyperdynamic Circulation of Chronic Liver Diseases: from the Patient to the Molecule. Hepatology 2006;43:S121-S131. [Crossref] [PubMed]
- Van Beers BE, Leconte I, Materne R, Smith AM, Jamart J, Horsmans Y. Hepatic Perfusion Parameters in Chronic Liver Disease: Dynamic CT Measurements Correlated with Disease Severity. AJR Am J Roentgenol 2001;176:667-73. [Crossref] [PubMed]
- Blendis L, Wong F. The Hyperdynamic Circulation in Cirrhosis: An Overview. Pharmacol Ther 2001;89:221-31. [Crossref] [PubMed]
- Li YT, Cercueil JP, Yuan J, Chen W, Loffroy R, Wáng YX. Liver intravoxel incoherent motion (IVIM) magnetic resonance imaging: a comprehensive review of published data on normal values and applications for fibrosis and tumor evaluation. Quant Imaging Med Surg 2017;7:59-78. [Crossref] [PubMed]
- Wáng YX, Deng M, Li YT, Huang H, Leung JCS, Chen W, Lu PX. A Combined Use of Intravoxel Incoherent Motion MRI Parameters Can Differentiate Early-Stage Hepatitis-b Fibrotic Livers from Healthy Livers. SLAS Technol 2018;23:259-68. [Crossref] [PubMed]
- Huang H, Che-Nordin N, Wang LF, Xiao BH, Chevallier O, Yun YX, Guo SW, Wáng YX. High performance of intravoxel incoherent motion diffusion MRI in detecting viral hepatitis-b induced liver fibrosis. Ann Transl Med 2019;7:39. [Crossref] [PubMed]
- Wang YX. Living tissue intravoxel incoherent motion (IVIM) diffusion MR analysis without b=0 image: an example for liver fibrosis evaluation. Quant Imaging Med Surg 2019;9:127-33. [Crossref]
- Shiha G, Zalata K. Chapter 10: Ishak versus METAVIR: Terminology, Convertibility and Correlation with Laboratory Changes in Chronic Hepatitis C (page 155-170). In: Takahashi H. editor. Liver Biopsy. Rijeka (Croatia): InTech, 2011:155-70.
- Bedossa P, Poynard T. An Algorithm for the Grading of Activity in Chronic Hepatitis C. The METAVIR Cooperative Study Group. Hepatology 1996;24:289-93. [Crossref] [PubMed]
- Chevallier O, Zhou N, He J, Loffroy R, Wáng YX. Removal of evidential motion-contaminated and poorly fitted image data improves IVIM diffusion MRI parameter scan-rescan reproducibility. Acta Radiol 2018;59:1157-67. [Crossref] [PubMed]
- Yuan J, Wong OL, Lo GG, Chan HH, Wong TT, Cheung PS. Statistical assessment of bi-exponential diffusion weighted imaging signal characteristics induced by intravoxel incoherent motion in malignant breast tumors. Quant Imaging Med Surg 2016;6:418-29. [Crossref] [PubMed]
- Li YT, Huang H, Zhuo Z, Lu PX. Chen W1, Wáng YX. Bi-phase age-related brain gray matter magnetic resonance T1r relaxation time change in adults. Magn Reson Imaging 2017;39:200-5. [Crossref] [PubMed]
- Chevallier O, Zhou N, Cercueil JP, He J, Loffroy R, Wang YX. Comparison of tri-exponential decay vs. bi-exponential decay and full fitting vs. segmented fitting for modeling liver intravoxel incoherent motion diffusion MRI. bioRxiv 2018. Available online: http://dx.doi.org/ [Crossref]
- Wáng YX, Li YT, Chevallier O, Huang H, Leung JCS, Chen W, Lu PX. Dependence of intravoxel incoherent motion diffusion MR threshold b-value selection for separating perfusion and diffusion compartments and liver fibrosis diagnostic performance. Acta Radiol 2019;60:3-12. [Crossref] [PubMed]
- Park HJ, Sung YS, Lee SS, Lee Y, Cheong H, Kim YJ, Lee MG. Intravoxel incoherent motion diffusion-weighted MRI of the abdomen: The effect of fitting algorithms on the accuracy and reliability of the parameters. J Magn Reson Imaging 2017;45:1637-47. [Crossref] [PubMed]
- Zhang Q, Wang YX, Ma HT, Yuan J. Cramér-Rao bound for Intravoxel Incoherent Motion Diffusion Weighted Imaging Fitting. Conf Proc IEEE Eng Med Biol Soc 2013;2013:511-4. [PubMed]
- Thabut D, Shah V. Intrahepatic angiogenesis and sinusoidal remodeling in chronic liver disease: new targets for the treatment of portal hypertension? J Hepatol 2010;53:976-80. [Crossref] [PubMed]
- Rockey DC, Shah V. Nitric oxide biology and the liver: report of an AASLD research workshop. Hepatology 2004;39:250-7. [Crossref] [PubMed]
- Kawada N, Klein H, Decker K. Eicosanoid-mediated contractility of hepatic stellate cells. Biochem J 1992;285:367-71. [Crossref] [PubMed]
- Thaiss WM, Sannwald L, Kloth C, Ekert K, Hepp T, Bösmüller H, Klag T, Nikolaou K, Horger M, Kaufmann S. Quantification of Hemodynamic Changes in Chronic Liver Disease: Correlation of Perfusion-CT Data with Histopathologic Staging of Fibrosis. Acad Radiol 2018. Epub ahead of print. [Crossref] [PubMed]
- Ronot M, Asselah T, Paradis V, Michoux N, Dorvillius M, Baron G, Marcellin P, Van Beers BE, Vilgrain V. Liver fibrosis in chronic hepatitis C virus infection: differentiating minimal from intermediate fibrosis with perfusion CT. Radiology 2010;256:135-42. [Crossref] [PubMed]
- Lazo M, Selvin E, Clark JM. Brief communication: clinical implications of short-term variability in liver function test results. Ann Intern Med 2008;148:348-52. [Crossref] [PubMed]
- Lima-Oliveira G, Salvagno GL, Lippi G, Gelati M, Montagnana M, Danese E, Picheth G, Guidi GC. Influence of a regular, standardized meal on clinical chemistry analytes. Ann Lab Med 2012;32:250-6. [Crossref] [PubMed]
- Nord HJ. Biopsy diagnosis of cirrhosis: blind percutaneous versus guided direct vision techniques--a review. Gastrointest Endosc 1982;28:102-4. [Crossref] [PubMed]
- Regev A, Berho M, Jeffers LJ, Milikowski C, Molina EG, Pyrsopoulos NT, Feng ZZ, Reddy KR, Schiff ER. Sampling error and intraobserver variation in liver biopsy in patients with chronic HCV infection. Am J Gastroenterol 2002;97:2614-8. [Crossref] [PubMed]
- Poynard T, Munteanu M, Imbert-Bismut F, Charlotte F, Thabut D, Le Calvez S, Messous D, Thibault V, Benhamou Y, Moussalli J, Ratziu V. Prospective analysis of discordant results between biochemical markers and biopsy in patients with chronic hepatitis C. Clin Chem 2004;50:1344-55. [Crossref] [PubMed]
- Afdhal NH. Biopsy or biomarkers: is there a gold standard for diagnosis of liver fibrosis? Clin Chem 2004;50:1299-300. [Crossref] [PubMed]
- Younossi ZM, Koenig AB, Abdelatif D, Fazel Y, Henry L, Wymer M. Global epidemiology of nonalcoholic fatty liver disease: metanalytic assessment of prevalence, incidence, and outcomes. Hepatology 2016;64:73-84. [Crossref] [PubMed]
- Angulo P, Kleiner DE, Dam-Larsen S, Adams LA, Bjornsson ES, Charatcharoenwitthaya P, Mills PR, Keach JC, Lafferty HD, Stahler A, Haflidadottir S, Bendtsen F. Liver fibrosis, but no other histologic features, is associated with long-term outcomes of patients with nonalcoholic fatty liver disease. Gastroenterology 2015;149:389-97.e10. [Crossref] [PubMed]
- Regini F, Colagrande S, Mazzoni LN, Busoni S, Matteuzzi B, Santini P, Wyttenbach R. Assessment of Liver Perfusion by IntraVoxel Incoherent Motion (IVIM) Magnetic Resonance-Diffusion-Weighted Imaging: Correlation With Phase-Contrast Portal Venous Flow Measurements. J Comput Assist Tomogr 2015;39:365-72. [PubMed]
- Wang YX. Medical imaging in pharmaceutical clinical trials: what radiologists should know. Clin Radiol 2005;60:1051-7. [Crossref] [PubMed]

