

Effect of segmentation from different diffusive metric maps on diffusion tensor imaging analysis of the cervical spinal cord
Introduction
Diffusion tensor imaging (DTI) has become a favorite technique in studies of the cervical spinal cord (1-5), due to its characteristics to detect the microstructure changes of nerve tissues (4,6,7). For DTI analysis, one crucial and necessary step is the segmentation of the whole spinal cord or more specific tissues like gray and white matters (8). The segmentation can help extract diffusive features to describe the status of the cervical spinal cord; also, it makes these diffusive features comparable among different subjects or patients without complicated image registration operation. The way for extraction of diffusive features may be different in different studies; one common way is to calculate the average value across the region of interest (ROI) defined by the segmentation (9-11). Compared with the whole spinal cord, the segmentation of tissues inside the spinal cord has attracted more and more attention in recent years; the more specific segmentation can extract more detailed diffusive features and provide a more comprehensive description of the cervical spinal cord. This kind of segmentation has already been used in several studies and achieved very promising findings, indicating its advantages over the whole-cord-based segmentation (8-16).
However, unlike the whole-cord-based segmentation, there are few methods for segmentation inside the spinal cord and the discussion on the segmentation is also limited (8). It is found that several different diffusive metric maps, e.g., B0, fractional anisotropy (FA) and axial diffusivity (AD), have been involved in the segmentation procedure in different studies (8-16). A question would be raised whether it maintains the consistent result if DTI analysis of the cervical spinal cord is performed based on segmentation from different diffusive metric maps. Different diffusive metric maps present different intensity distributions as they reflect different diffusive properties of the spinal cord tissues. The intensity distribution is an essential reference for segmentation, and the difference in intensity distribution may somehow affect the segmentation accuracy. An accurate segmentation can ensure the validity and effectiveness of the extracted diffusive features in DTI analysis; the knowledge on the effect can help researchers and clinicians choose a proper diffusive metric map for the segmentation in their studies.
Therefore, this study examined the effect of segmentation based on different diffusive metric maps for DTI analysis of the cervical spinal cord. The examination was performed in two aspects: one was to evaluate the accuracy of the segmentation results, and the other was to assess the diversity of the extracted diffusive features. The accuracy of the segmentation results can denote the validity of the extracted diffusive features, i.e., whether the diffusive features can correctly describe the diffusive properties of target tissues. The diversity of the extracted diffusive features can indicate their effectiveness. The effectiveness of these features will decrease if they are with a small variance; in that case, they can be replaced by the whole-cord-based features, which can be acquired with less time and efforts. The detailed examination methods would be introduced in the materials and methods section.
Methods
Subjects
Thirty healthy subjects and thirty patients with confirmed cervical spondylotic myelopathy (CSM) were recruited in this study. All healthy subjects were Chinese, with normal sensory and motor functions as well as full Japanese Orthopaedic Association (JOA) scores and negative Hoffman sign. Also, the subjects should not be with a past history of spinal cord injury, myelopathy as well as other neurological diseases. One subject was excluded due to poor image quality. CSM patients were also Chinese, and they were diagnosed based on the neurological signs and symptoms with compatible radiological findings of stenosis by a group of senior spine surgeons. The patients with prior neurological trauma/surgery, other co-existing neurological disorders or claustrophobia were excluded. The age of the healthy subjects ranged from 21 to 62 years old with an average value of 45.3±9.0 years old, and there were 13 males and 16 females; while, the age of CSM patients ranged from 43 to 86 years old with an average value 65.2±11.7 years old, and there were 20 males and 10 females. For healthy subjects, all cervical levels from C2 to C7/T1 were scanned and analyzed; while, for CSM patients, all cervical levels were scanned, but only one compressed level was selected for analysis. The compressed level was determined by neurological examination and the finding of spinal canal stenosis in diffusive metric maps. This study included subjects with different ages, and a previous study suggested that age-related changes could be neglected (9). All healthy subjects and CSM patients were informed before the experiments with an informed consent letter signed. This study was approved by the local institutional review board of research ethics.
DTI scanning
DTI scanning was performed by a 3T magnetic resonance scanner (Philips Achieva, The Netherland). The subject was placed supine with SENSE Neuro-Vascular ARRAY coil with 16 channels enclosing the cervical region. The pulse sequence used was single-shot spin-echo echo-planar imaging (SE-EPI). The diffusion encoding was in fifteen non-collinear and non-coplanar diffusion directions with b value =600 s/mm2. The imaging parameters were as follows: FOV =80×36 mm, acquisition matrix =80×28, reconstructed resolution =0.63×0.63 mm2, slice thickness =7 mm, fold-over direction = AP, number of excitation (NEX) =3, EPI factor =35, TE/TR =60 ms/5 heartbeats. Spectral presaturation with inversion recovery was applied to avoid water-fat-shift artifacts. Cardiac vectorcardiogram triggering was applied to minimize the pulsation artifact from cerebrospinal fluid. The image slice planning was to use 12 slices to cover cervical levels from C2 to C7/T1 in three stacks.
Diffusive metric calculation
Conventional diffusive metrics, e.g., FA, AD, radial diffusivity (RD) and mean diffusivity (MD), were calculated by DTI Studio software (version 2.4.01, 2003, John Hopkins University, Baltimore, MD, USA). The definitions of each diffusive metric were explained in the following.
After DTI scanning, B0 map and several diffusion-weighted images corresponding to different gradients were acquired. Notably, a diffusion-weighted image could be denoted by (17):
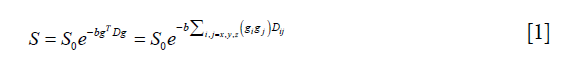
where S0 represents the B0 map, g is the diffusion gradient matrix, and b is a diffusion-weighting factor. D is the diffusion tensor and can be defined as:
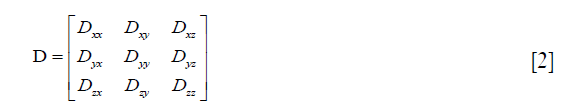
The diffusion tensor is symmetric, i.e., Dij=Dji with i,j=x,y,z, and it can be represented by a vector with six independent variables as follows:

Then, Eq. [1] was rewritten as:

where

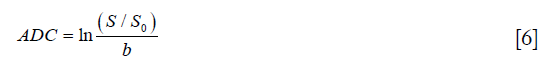
Moreover, ADC is known as the apparent diffusion constant, defined by:
Based on Eq. [4],  could be calculated via a least-squares problem, and in this study, it was calculated using singular value decomposition. When the tensor was obtained, its three eigenvalues, i.e., λ1, λ2 and λ3 (λ1≥λ2≥λ3), and corresponding eigenvectors, i.e., v1, v2 and v3, could be calculated. With the three eigenvalues, FA, AD, RD, and MD were respectively defined by:
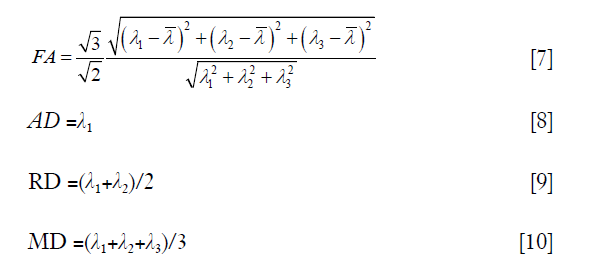
where  is the average value of λ1, λ2 and λ3.
Average image calculation
An average image was calculated as the reference to examine the accuracy of segmentation based on different diffusive metric maps. The average image was a combination of five commonly used diffusive metric maps, including B0, FA, AD, RD and MD maps. The calculation process was shown in Figure 1A. In this process, the manual segmentation of the whole spinal cord was performed on B0 map by an experienced neuroimage researcher. Image contrast adjustment was achieved by histogram equalization algorithm provided by the scikit-image package (18). Image intensity range normalization transformed image intensities to the range from 0 to 1, and then image intensity inverse operation was to use 1 minus the image intensity after normalization. Image intensity inverse operation was only performed for FA, AD and MD maps, to ensure that gray and white matters corresponded to high and low image intensities respectively. The averaging procedure was to calculate the mean values of five diffusive metric maps after image preprocessing.

Segmentation of gray and white matters
The segmentation of gray and white matters had been performed for B0 map, FA map, AD map, and the average image. The segmentation process was shown in Figure 1B. In this process, the manual segmentation of the whole spinal cord and image preprocessing procedures were the same as those for average image calculation. Image intensity inverse operation was only performed for FA and AD maps. The intensity-based segmentation algorithm was via voting of segmentation results of six common automatic thresholding algorithms, i.e., yen (19), otsu (20), isodata (21), mean (22), li (23) and triangle (24). The voting process was defined as:
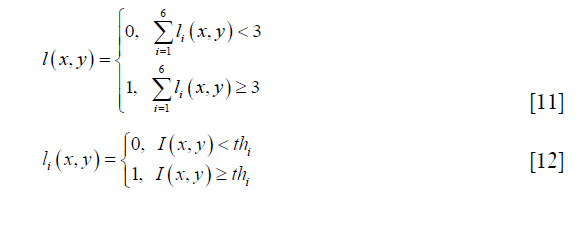
where 0 and 1 represent the white and gray matter respectively, ιi and thi are the segmentation result and the threshold acquired by a thresholding algorithm, and I (x,y) represents image intensity at the image pixel position (x,y).
Yen algorithm was performed by the function “skimage.filters.threshold_yen” in the scikit-image package (18). It is an entropy-based thresholding algorithm. It considers the foreground and background as two different signal sources and the threshold is supposed to be optimal if the sum of the two-class entropies reaches its maximum. Yen et al. defined the entropic correlation as:
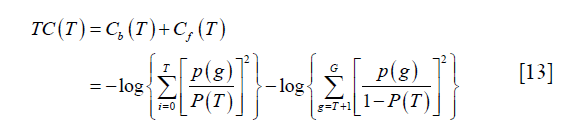
where p (g), g=0,..,G, represents the probability mass function (PMF) of the image and G is the maximum intensity value in the image, typically 255 if 8-bit quantization is assumed. T is the threshold and 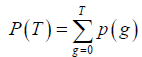 . The subscript “b” and “f” represent background and foreground respectively. Yen’s method was to find the threshold T to maximize TC (T).
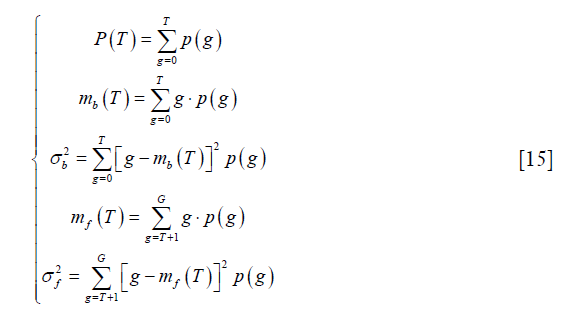
Otsu’s method was performed by the function “skimage.filters.threshold_otsu” in the scikit-image package (18). It tries to find the optimal threshold by minimizing the weighted sum of within-class variances of the two classes. Moreover, this minimizing process has been proved to be equal to a maximization of the inter-class variance. Thus, the threshold can be determined by solving the following optimization process:
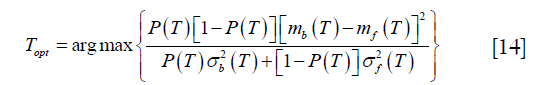
where T is the threshold, P (T) is the cumulative probability function, and mi (T) and  (i = b, f) represent mean and variance of background and foreground. P (T), mi (T) and are defined as:
where p (g), g and G have the same definition as those in Eq. [13].
Isodata algorithm was performed by the function “skimage.filters.threshold_isodata” in the scikit-image package (18). It is an iterative selection method. First, an initial threshold is set by:
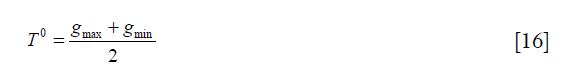
where gmax and gmin are the maximum and minimum intensities in the image respectively. Second, the image is segmented into background and foreground based on the current threshold, and the average intensities of background and foreground Ab and Af are calculated as:
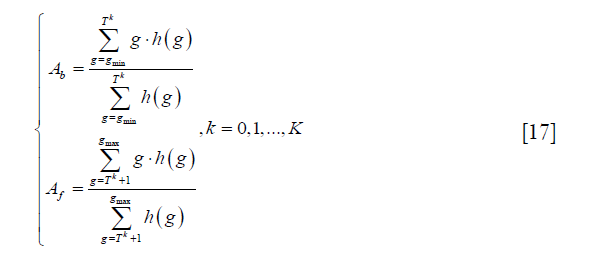
where h (g) represents the pixel number with intensity g, and K is the number of maximum iteration. Third, the threshold is recalculated as:
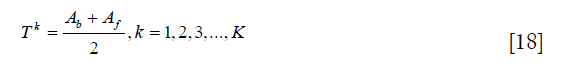
Then, repeat the second and third steps until TK = TK–1.
Mean algorithm was performed by the function “skimage.filters.threshold_mean” in the scikit-image package (18). It returns the average image intensity as the threshold.
Li’s method was performed by the function “skimage.filters.threshold_li” in the scikit-image package (18). It is to evaluate the Kullback-Leibler distance, defined as:
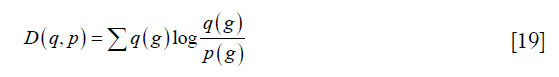
where p (g) and q (g) represent the probability function of the original image and the reconstructed image. Li’s method tries to minimize this distance by solving the optimization problem as:
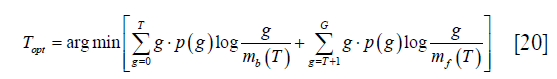
where mb (T) and mf (T) have the same meaning as those in Eq. [15].
Triangle algorithm was performed by the function “skimage.filters.threshold_triangle” in the scikit-image package (18). It is based on the intensity histogram. Notably, a line L was drawn between the highest and the lowest peaks in the histogram. The lowest peak should be significantly larger than zero. Then, the locations between the selected highest and lowest peaks are selected, and the distances from the corresponding peaks of these locations to line L are calculated. The peak acquiring the most substantial distance is finally selected, and the threshold is the adding between the peak’s location and a fixed offset.
Evaluation of the effect of segmentation in diffusive metric maps
Accuracy of segmentation
The accuracy of segmentation was examined via a comparison between segmentation results based on each single diffusive metric map and the reference, i.e., segmentation based on the average image. Mainly, the comparison was based on the intersection of the union (IOU). IOU is a commonly used evaluation metric to show the similarity between the two segmentation results. In this study, it was calculated by:
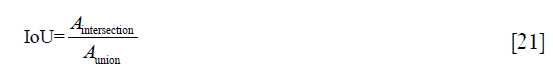
where Aintersection and Aunion represent areas of the intersection region and the union region of the two segmentation results respectively (Figure 2).

The diversity of extracted diffusive features among different ROIs
Based on the segmented gray and white matters, diffusive features were extracted by calculating the average diffusive metric values (FA, AD, RD, and MD) across the two ROIs. For a diffusive metric, the corresponding diffusive features will be with high diversity between the two ROIs if the diffusive metric values are similar in the same ROI and are different a lot in different ROIs (Figure 3). Meanwhile, if this condition is fulfilled, this diffusive metric can also perform well in the classification of image pixels of the two ROIs. Therefore, the evaluation of the diversity of extracted diffusive features is equivalent to the evaluation of the performance of the corresponding diffusive metric in the classification of the two ROIs. Mutual information (MI) and area under the curve (AUC) were calculated for each diffusive metric (FA, AD, RD, and MD) to evaluate the classification performance. Then, the mean MI and AUC values of FA, AD, RD, and MD were calculated respectively, to indicate the overall diversity of the extracted diffusive feature.

MI was defined as (25):
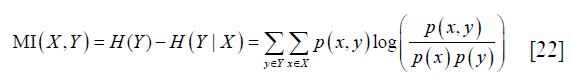
where X and Y represent the two random variables, p (x,y) represents the joint probability of X and Y, p (x) and p (y) represent the probability of X and Y respectively, H (Y) represents the entropy of Y, and H (Y|X) represents the conditional entropy. MI represents the mutual dependency between X and Y. In this study, X and Y were set as the label (gray or white matters) and feature (FA, AD, RD or MD value) of image pixels respectively, and their mutual dependency reflected the ability of the tested diffusive metric in the classification of the two ROIs.
AUC was calculated based on the receiver operating characteristic (ROC) curve, whose ordinate and abscissa were true positive rate and false positive rate respectively (26). AUC value would be subtracted by 1 if it was smaller than 0.5.
Statistical tests
One-way ANOVA analysis was performed based on 348 healthy cases (29 healthy subjects ×12 cervical levels), to examine the differences in IOU, MI and AUC values. Moreover, Bonferroni’s post hoc tests were performed if the main effect was significant. Significant level was set as 0.05. The same statistical tests were also performed for the CSM patient group, based on 30 non-healthy cases (30 CSM patients ×1 cervical compression level).
Results
Segmentation of gray and white matters
As shown in Figure 4, the original B0, FA and AD maps exhibited different image contrasts and image intensity ranges for both healthy and non-healthy cases. Moreover, in FA and AD maps, gray and white matters corresponded to low and high image intensities respectively. After image preprocessing, image contrasts and image intensity ranges of different diffusive metric maps became consistent; and, in all diffusive metric maps, gray and white matters corresponded to high and low image intensities. The gray and white matters had been revealed in the average image, and after image preprocessing, the average image shared the same image contrast and image intensity range with each single diffusive metric map. The segmentation could separate the high and low image intensities and extract different ROIs for gray and white matters.

Accuracy of segmentation
One-way ANOVA revealed that there were significant differences in IOU among B0, FA and AD maps for both healthy subjects (F =2,219.5, P<0.001 for gray matter and F =2,232.4, P<0.001 for white matter) and CSM patients (F =47.1, P=0.0014 for gray matter and F =66.2, P<0.001 for white matter). Bonferroni’s post hoc tests had been performed for further testing, and the results were exhibited in Figure 5. It is seen that the FA map achieved the best IOU value in both gray and white matters for both healthy subjects and CSM patients.

The diversity of extracted diffusive features
One-way ANOVA revealed that there were significant differences in MI and AUC among B0, FA and AD maps, and the specific testing results were shown in Table 1. Bonferroni’s post hoc tests had been performed for further testing, and the results of MI and AUC were exhibited in Figure 6. It is seen that different diffusive metric maps resulted in different MI and AUC values. FA map achieved the largest MI and AUC values in “mean value” for healthy subjects; while, for CSM patients, FA map only acquired the most substantial values in number, but statistical difference no longer existed between FA and AD maps.

Full table

Discussion
This study evaluated the effect of segmentation based on different diffusive metric maps for DTI analysis of the cervical spinal cord. The evaluation was performed from two aspects, i.e., the accuracy of segmentation and the diversity of extracted diffusive features. Different evaluation results had been observed for segmentation based on different diffusive metric maps, suggesting the necessity of selection of diffusive metric maps for segmentation in DTI analysis of the cervical spinal cord.
DTI is a favorite technique in studies of the cervical spinal cord. It can help understand the physiological and pathological changes in the cervical spinal cord and assist in the development of clinical diagnostic and prognostic tools (1-5). Segmentation of cervical spinal cord tissues is a crucial and necessary step in DTI analysis (8). Usually, the segmentation is for the whole spinal cord (4-6,27) and the methods for such kind of segmentation have been well discussed. Recently, some studies have suggested that segmentation of more specific tissues, e.g., the gray and white matters, may lead to more valuable diffusive features for DTI analysis (9-14); nevertheless, the related segmentation methods are not well developed, and there is still no uniform way for the segmentation (8). It was found that different diffusive metric maps had been involved in segmentation of specific spinal cord tissues (9-14). Different diffusive metric maps reflect different diffusive properties of the spinal cord tissues and maybe with different intensity distribution. Image intensity is an essential reference for segmentation; the difference in image intensity may affect the segmentation accuracy, and then affect the validity and effectiveness of extracted diffusive features. To know this kind of effect can help choose the most appropriate diffusive metric map for segmentation and extract valid and useful diffusive features for DTI analysis of the cervical spinal cord.
The effect of segmentation based on different diffusive metric maps was evaluated from two aspects: the accuracy of segmentation and the diversity of extracted diffusive features. The accuracy of segmentation determines the validity of extracted diffusive features. The diffusive feature is usually extracted via a combination of diffusive metric values of all image pixels inside an ROI, for example, the averaging. If a ROI contains tissues besides the target tissue, the value of extracted diffusive feature will inevitably be increased or decreased by the wrongly included tissues, and it can no longer correctly reflect the diffusive property of target tissue. The diversity of extracted diffusive features can indicate their effectiveness. Compared with whole-cord-based features, diffusive features extracted by more specific ROIs can provide a more comprehensive description of the cervical spinal cord. However, if these diffusive features are with a small variance, their values will be very close to the whole-cord-based feature, and it will be less meaningful to spend time and efforts on the segmentation inside the spinal cord.
The accuracy of segmentation was examined by comparing the segmentation results of each diffusive metric map with the segmentation based on the average image. The average image can be a good reference for the comparison, though it is not a 100% reflection of the tissue distribution. It combines different diffusive metrics, and its intensity distribution can be more consistent with the tissue distribution than each single diffusive metric map. The segmentation was performed using a semi-automatic method, including a manual segmentation of the whole spinal cord, an automatic image preprocessing procedure for image contrast and intensity range normalization, and automatic intensity-based segmentation of gray and white matters. Its reproducibility was determined by the manual procedure, which had once been validated by Chan et al. (9); the intra-observer and inter-observer reproducibility were 0.752 and 0.764 respectively, indicating excellent reproducibility (28,29). Also, the segmentation of gray and white matters was based on image intensities. The proposed segmentation method adopted a voting strategy, to combine results of a series of mature automatic thresholding algorithms. This method can help ensure the robustness of the segmentation. Moreover, the potential disturbance of image contrast and image intensity range to the intensity-based segmentation procedure was eliminated in the image preprocessing procedure. Hence, the proposed segmentation process could provide accurate and robust segmentation results for comparison.
The diversity of extracted diffusive features was examined via a classification problem. Their relationship was illustrated in Figure 3. If diffusive metric values are similar in the same ROI and are different among different ROIs, the extracted diffusive features are with large variance and the diffusive metric can perform well in the classification of image pixels of the different ROIs. Based on this correlation, the diversity of extracted diffusive features can be quantitatively evaluated by metrics to show the classification performance, e.g., MI and AUC.
In the testing, it was noticed that different diffusive metric maps had resulted in different evaluation results, suggesting that the selection of diffusive metric maps would affect DTI analysis of the cervical spinal cord. Among the three diffusive metric maps, FA performed the best in both the accuracy of the segmentation (Figure 5) and the diversity of extracted diffusive features (Figure 6) for both healthy subjects and CSM patients. FA describes the degree of diffusion anisotropy and is a relative value calculated by the three eigenvalues of the diffusion tensor [Eq. 7]; while B0 and AD maps are absolute values reflecting the tissues’ T1 or T2 value and the diffusion speed in the axial direction respectively. The absolute values may change a lot in different scanning and are easily affected by noises, biases and partial volume effect; while, relative value is usually more resistant to such kinds of interference. Also, FA is a comprehensive reflection of the axial and radial diffusion in tissues; it is expected to perform better than AD, which only contains information of diffusion in the axial direction.
Even though the evaluation in this study was based on a semi-automatic segmentation process, the findings can also be used in manual tracing based ROI analysis. The evaluation results inherently reflected the consistency between image intensity distribution and tissue distribution. The image intensity distribution is also an essential reference for manual tracing, and the manual tracing can be more accurate if it is performed on a diffusive metric map with a high degree of consistency to the tissue distribution. Also, the gray and white matters had been well segmented in the segmentation procedure. This segmentation procedure can also be applied for the brain, which is also made up of the gray and white matters; while, some modifications may be required in the preprocessing procedure as well as the set of parameters.
There are still some limitations. First, the sample size of the non-healthy group was small compared with the healthy group. For healthy subjects, all cervical levels could be used for evaluation; while, for CSM patients, only the compression level was meaningful in the evaluation. In this study, the healthy and non-healthy groups were analyzed independently, and the imbalanced sample size would not affect the evaluation results. However, the small sample size of the non-healthy group may affect the credibility of the findings to some degree. Second, the average image is an approximation of tissue distribution. Therefore, the accuracy of the segmentation is not the absolute accuracy but a relative accuracy.
In conclusion, this study evaluated the effect of segmentation in different diffusive metric maps, including B0, FA and AD maps. The evaluation was performed from two aspects: the accuracy of segmentation and the diversity of extracted diffusive features. Different diffusive metric maps resulted in different evaluation results, suggesting the necessity of selection of diffusive metric maps for segmentation in DTI analysis of the cervical spinal cord. Among the three diffusive metric maps, FA map performed the best in the testing and was suggested for segmentation in DTI analysis of the cervical spinal cord.
Acknowledgements
The authors thank Dr. Xiang Li and Mr. Chester Chan for their help in MRI scanning and image analysis. This work was supported by SK Yee Medical Foundation (No. 2161216).
Footnote
Conflicts of Interest: The authors have no conflicts of interest to declare.
Ethical Statement: This study was approved by the local institutional review board of research ethics (No. UW12-468).
References
- Van Hecke W, Leemans A, Sijbers J, Vandervliet E, Van Goethem J, Parizel PM. A tracking-based diffusion tensor imaging segmentation method for the detection of diffusion-related changes of the cervical spinal cord with aging. J Magn Reson Imaging 2008;27:978-91. [Crossref] [PubMed]
- Lee JW, Kim JH, Park JB, Park KW, Yeom JS, Lee GY, Kang HS. Diffusion tensor imaging and fiber tractography in cervical compressive myelopathy: preliminary results. Skeletal Radiol 2011;40:1543-51. [Crossref] [PubMed]
- Vedantam A, Rao A, Kurpad SN, Jirjis MB, Eckardt G, Schmit BD, Wang MC. Diffusion tensor imaging correlates with short-term myelopathy outcome in patients with cervical spondylotic myelopathy. World Neurosurg 2017;97:489-94. [Crossref] [PubMed]
- Cui JL, Wen CY, Hu Y, Li TH, Luk KD. Entropy-based analysis for diffusion anisotropy mapping of healthy and myelopathic spinal cord. Neuroimage 2011;54:2125-31. [Crossref] [PubMed]
- Wang SQ, Li X, Cui JL, Li HX, Luk KD, Hu Y. Prediction of myelopathic level in cervical spondylotic myelopathy using diffusion tensor imaging. J Magn Reson Imaging 2015;41:1682-8. [Crossref] [PubMed]
- Cui JL, Wen CY, Hu Y, Mak KC, Mak KH, Luk KD. Orientation entropy analysis of diffusion tensor in healthy and myelopathic spinal cord. Neuroimage 2011;58:1028-33. [Crossref] [PubMed]
- Ellingson BM, Salamon N, Holly LT. Advances in MR imaging for cervical spondylotic myelopathy. Eur Spine J 2015;24 Suppl 2:197-208. [Crossref] [PubMed]
- Dostál M, Keřkovský M, Korit Áková E, Němcová E, Stulík J, Staňková M, Bernard V. Analysis of diffusion tensor measurements of the human cervical spinal cord based on semiautomatic segmentation of the white and gray matter. J Magn Reson Imaging 2018;48:1217-27. [Crossref] [PubMed]
- Chan TY, Li X, Mak KC, Cheung JP, Luk DK, Hu Y. Normal values of cervical spinal cord diffusion tensor in young and middle-aged healthy Chinese. Eur Spine J 2015;24:2991-8. [Crossref] [PubMed]
- Wang K, Chen Z, Zhang F, Song Q, Hou C, Tang Y, Wang J, Chen S, Bian Y, Hao Q. Evaluation of DTI parameter ratios and diffusion tensor tractography grading in the diagnosis and prognosis prediction of cervical spondylotic myelopathy. Spine 2017;42:E202-10. [Crossref] [PubMed]
- Wang S, Hu Y, Shen Y, Li H. Classification of Diffusion Tensor Metrics for the Diagnosis of a Myelopathic Cord Using Machine Learning. Int J Neural Syst 2018;28:1750036. [Crossref] [PubMed]
- Onu M, Gervai P, Cohen-Adad J, Lawrence J, Kornelsen J, Tomanek B, Sboto-Frankenstein UN. Human cervical spinal cord funiculi: investigation with magnetic resonance diffusion tensor imaging. J Magn Reson Imaging 2010;31:829-37. [Crossref] [PubMed]
- Yoo WK, Kim TH, Hai DM, Sundaram S, Yang YM, Park MS, Kim YC, Kwak YH, Ohn SH, Kim SW. Correlation of magnetic resonance diffusion tensor imaging and clinical findings of cervical myelopathy. Spine J 2013;13:867-76. [Crossref] [PubMed]
- Thurnher MM, Law M. Diffusion-weighted imaging, diffusion-tensor imaging, and fiber tractography of the spinal cord. Magn Reson Imaging Clin N Am 2009;17:225-44. [Crossref] [PubMed]
- Naismith RT, Xu J, Klawiter EC, Lancia S, Tutlam NT, Wagner JM, Qian P, Trinkaus K, Song SK, Cross AH. Spinal cord tract diffusion tensor imaging reveals disability substrate in demyelinating disease. Neurology 2013;80:2201-9. [Crossref] [PubMed]
- Saksena S, Mohamed F, Middleton DM, Krisa L, Alizadeh M, Shahrampour S, Conklin CJ, Flanders A, Finsterbusch J, Mulcahey MJ, Faro SH. DTI Assessment of Regional White Matter Changes in the Cervical and Thoracic Spinal Cord in Pediatric Subjects. J Neurotrauma 2018. Epub ahead of print. [Crossref] [PubMed]
- Jiang H, van Zijl PC, Kim J, Pearlson GD, Mori S. DtiStudio: resource program for diffusion tensor computation and fiber bundle tracking. Comput Methods Programs Biomed 2006;81:106-16. [Crossref] [PubMed]
- van der Walt S, Schönberger JL, Nunez-Iglesias J, Boulogne F, Warner JD, Yager N, Gouillart E, Yu T. scikit-image contributors. scikit-image: image processing in Python. PeerJ 2014;2:e453. [Crossref] [PubMed]
- Yen JC, Chang FJ, Chang S. A new criterion for automatic multilevel thresholding. IEEE Trans Image Process 1995;4:370-8. [Crossref] [PubMed]
- Otsu N. A threshold selection method from gray-level histograms. IEEE Trans Syst Man Cybern 1979;9:62-6. [Crossref]
- Ridler T, Calvard S. Picture thresholding using an iterative selection method. IEEE trans syst Man Cybern 1978;8:630-2. [Crossref]
- Glasbey CA. An analysis of histogram-based thresholding algorithms. Comput Vis Graph Image Process 1993;55:532-7.
- Li CH, Lee C. Minimum cross entropy thresholding. Pattern Recognit 1993;26:617-25. [Crossref]
- Zack GW, Rogers WE, Latt SA. Automatic measurement of sister chromatid exchange frequency. J Histochem Cytochem 1977;25:741-53. [Crossref] [PubMed]
- Peng H, Long F, Ding C. Feature selection based on mutual information criteria of max-dependency, max-relevance, and min-redundancy. IEEE Trans Pattern Anal Mach Intell 2005;27:1226-38. [Crossref] [PubMed]
- Ling CX, Huang J, Zhang H. AUC: a statistically consistent and more discriminating measure than accuracy. Available online: https://cling.csd.uwo.ca/papers/ijcai03.pdf
- Li X, Cui JL, Mak KC, Luk KD, Hu Y. Potential use of diffusion tensor imaging in level diagnosis of multilevel cervical spondylotic myelopathy. Spine (Phila Pa 1976) 2014;39:E615-22. [Crossref] [PubMed]
- Cicchetti DV, Sparrow SA. Developing criteria for establishing interrater reliability of specific items: applications to assessment of adaptive behavior. Am J Ment Defic 1981;86:127-37. [PubMed]
- Fleiss JL, Levin B, Paik MC. Statistical methods for rates and proportions. Hoboken, New Jersey: John Wiley & Sons; 2003.

