

Effects of radiation dose levels and spectral iterative reconstruction levels on the accuracy of iodine quantification and virtual monochromatic CT numbers in dual-layer spectral detector CT: an iodine phantom study
Introduction
Recent investigations have shown that dual-energy computed tomography (DECT) allowed for a more accurate disease detection, diagnosis, tumor differentiation and quantitative assessment when it had been compared to the conventional CT (1-5). To improve the detectability of some abdomen lesions, an injection of iodine contrast agents is usually required to enhance the visualization of the abdominal vessels and tissues. With a conventional CT, lesions can only be assessed by measuring the Hounsfield units (HU) in grayscale mode. But with DECT technology, material decomposition and qualification can be performed to measure iodine concentration in blood vessels and tissues, which is helpful for the doctors to provide a more definitive diagnosis (3,5). For example, iodine quantification is useful for tumor vasculature characterization, tumor burden evaluation, therapeutic response assessment, and cancer classification (6-8). In addition, a virtual monochromatic image (VMI) of the specified energy level can be generated. Higher attenuation of iodine at low energy level (around 40–60 keV) is useful for better conspicuity of hypovascular lesions (9,10). Even with a reduced contrast agent dose, low energy VMI can provide better contrast enhancements and better image quality in CT angiography when compared to conventional CT images (11,12). At medium energy level (around 60–80 keV), VMI are similar in overall appearance to routine conventional 120 kVp images, which was reported to have an optimal peak contrast-to-noise ratio for soft tissue, as well as being suitable for the evaluation of hypervascular lesions (13-15). High energy level (above 80 keV) VMI enables the reduction of beam-hardening, metallic and calcium blooming artifacts, which can improve the accuracy of lesion boundary identification, vascular stenosis evaluation or calcification extent assessment (16,17).
The main technical approaches for DECT previously were dual-source CT (DSCT) and fast-kV switching CT (KVSCT) (18,19). DSCT obtains high and low energy data via two separate data acquisition systems (i.e., tube and detector) and performs material decomposition in image space. KVSCT acquires high and low energy data set via rapid tube voltage switch between 80 and 140 kVp and performs material decomposition in projection space. More recently, a dual-layer spectral CT (DLCT) has been introduced for clinical usage, representing an alternative approach for DECT. This system simultaneously acquires energy-sensitive data via the dual-layer detector; the upper layer absorbs lower energy photons and the lower layer absorbs higher energy photons simultaneously (20). The resulting datasets are spectral-base-images (SBI) reconstructed from the low and high energy data in projection space together with spectral iterative reconstruction (IR) algorithm. For a given tube voltage, seven levels of spectral IR settings (L0–L6) are provided which can achieve the noise reduction capability which is similar to the hybrid IR (iDose4, Philips Healthcare, Cleveland, OH, USA) level. The SBI contains the relevant information needed to generate the VMIs for the retrospective spectral analysis, without the need for an additional reconstruction or post-processing. This novel technique has a near-perfect spatial and temporal alignment, and allows material decomposition in projection space, resulting in a more accurate material qualification and beam-hardening reduction. Being retrospective in nature, these spectral reconstructions are always available on-demand, demonstrating the technology to have workflow benefits in a clinical setting (21).
For wide-scale adoption of DLCT technology in clinical practices, the prerequisite is the high accuracy and repeatability of iodine concentration and VMI CT numbers when performing quantitative analysis at different settings of tube voltage, tube current, and spectral IR level. So far, only a few studies have addressed these questions (22-25). In the present study, we used an iodine phantom to perform a DLCT quantitative experiment at different tube voltages, different computed tomography dose index volume (CTDIvol) dose levels, and different spectral IR levels to investigate the effects of these parameters on the accuracy of iodine quantification and VMI CT numbers.
Methods
Phantom description
A Gammex 472 phantom (QRM, GAMMEX, Inc. Middleton, WI, USA) was used in this study. The phantom is a solid water disk with a diameter of 33 cm, and thickness of 5 cm (an average size of pelvis). The phantom contains two concentric rings with eight holes in each concentric ring. Seven iodine inserts with different concentrations of iodine (2.0, 2.5, 5.0, 7.5, 10.0, 15.0, 20.0 mg/mL) were placed inside the inner ring holes. The left holes were filled with solid water inserts or soft tissue inserts whose density was close to water. All inserts were 2.8 cm in diameter and 7 cm in length (Figure 1).

Image acquisition
Images were acquired using a DLCT scanner (IQon spectral CT, Philips Healthcare, Cleveland, OH, USA) at five radiation dose levels: with CTDIvol of 25, 20, 15, 10, 5 mGy each at tube voltages of 120 and 140 kVp. For each tube voltage setting, the tube current-time product (mAs) was adjusted to attain a targeted CTDIvol. With a tube voltage of 120 kVp, the mAs values that were used were 204, 163, 122, 82 and 41 mAs, respectively. Correspondingly 142, 114, 85, 57 and 29 mAs, respectively with the use of 140 kVp. Other scanning and reconstruction parameters were fixed, such as the gantry rotation time of 0.75 seconds, pitch of 0.810, detector collimation of 16 mm × 0.625 mm, FOV of 350 mm, slice thickness of 3 mm, standard B kernel. Each acquisition was repeated five times. SBI was reconstructed with four different spectral levels (i.e., level 0, 2, 4, 6) for each acquisition.
Image analysis
All images were analyzed using a commercially available workstation (IntelliSpace Portal version 9.0.1.61510, Philips Healthcare). The iodine density map was generated from SBI for obtaining the Iodine concentration measurement. Likewise, VMI images of 50, 70 and 120 keV, representing low, medium and high energy images were generated for the CT value (HU) measurement. The iodine concentration and VMI CT numbers measurements were performed at three consecutive central axial images in the central slices of the phantom. Circular ROIs of approximately 350 mm2 area were manually placed at the center of each insert. The ROIs did not include the edge of the inserts to avoid the impact of partial volume effect.
Iodine quantification
In total, 1,400 measurements of iodine concentration obtained from the acquisitions and reconstructions using different parameters (120 & 140 kVp, five CTDIvol levels, four spectral IR levels) with five repeat scans and seven iodine concentrations were analyzed.
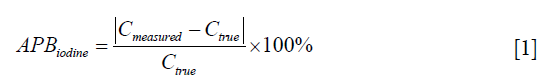
Iodine concentration bias between the measured iodine concentration (Cmeasured) and the true iodine concentration (Ctrue) of each iodine insert was calculated. The accuracy of the iodine quantification was defined as the absolute percentage bias (APBiodine), which was calculated according to the following equation:
VMI quantification
A total of 4,200 measurements from the VMI CT numbers were obtained from the acquisitions and reconstructions using different parameters (120 & 140 kVp, five CTDIvol levels, four spectral IR levels) with five repeat scans, of which three energy levels and seven iodine concentrations were analyzed.
Theoretical CT numbers at each energy level was calculated according to the chemical composition and density of each insert provided by the manufacturer.
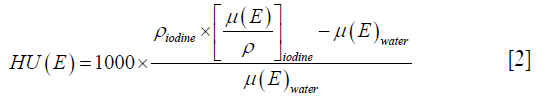
where ρiodine is the mass density of the iodine inserts,  is the mass attenuation coefficient of the insert at energy, and E, µ(E)water is the mass attenuation coefficient of water at energy E.
The mass attenuation coefficients were calculated from the National Institute of Standards and Technology (NIST) XCOM database (26). Theoretical CT numbers for each iodine insert at energy levels of 50, 70 and 120 keV are shown in Table 1.

Full table
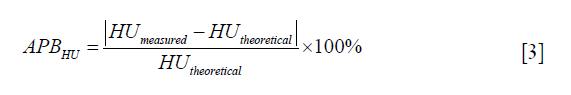
VMI CT number bias between the measured VMI CT numbers (HUmeasured) and theoretical VMI CT numbers (HUtheoretical) of each iodine insert was calculated. The accuracy of VMI CT numbers was defined as the absolute percentage bias (APBHU), which was calculated according to the following equation:
Statistical analysis
Statistical analyses were performed using the SPSS Statistics software (version 21.0, IBM). To assess the effects of the individual impacting parameter of CTDIvol, tube voltage (kVp), spectral IR on the overall quantification accuracy of iodine and VMI CT numbers. The measurement data was pooled, keeping one parameter fixed for separate analysis. In addition, the effects on quantification accuracy of five CTDIvol levels and two kVp combination settings were also analyzed, respectively. The Kruskal-Wallis test with the Bonferroni adjustment method was used to compare the mean APB of the accuracy of iodine quantification and VMI CT numbers between different the subgroups. The Mann-Whitney U-test was used to compare the two groups. A level of P<0.05 was considered to be statistically significant. The variability of iodine concentration and VMI CT numbers obtained from the five repeat scans was analyzed using the standard deviation. Box-Whisker-plots were used to show the statistical data. Values that exceeded 1.5 times interquartile range were marked as outliers.
Results
Iodine quantification accuracy
The range of overall iodine concentration bias using both kVps for all iodine inserts was −1.27 to 0.74 mg/mL, with the largest mean APBiodine of 3.21%.
Across both kVps, the CTDIvol levels of 25, 20, 15 and 10 mGy had no effect on iodine quantification accuracy. The mean APBiodine was 3.00%, 3.03%, 2.86% and 3.16%, respectively. At a CTDIvol level of 5 mGy, the accuracy of iodine quantification was the poorest, with a mean APBiodine of 4.33%. In addition, a significant difference in accuracy of iodine quantification between a CTDIvol level of 5 mGy and CTDIvol levels of 25, 20, 15 and 10 mGy was found (P<0.05) (Figure 2).

While evaluating the measurements between 120 and 140 kVp, the accuracy of iodine quantification was slightly (not significantly) higher in the 140 kVp compared to the 120 kVp (P=0.648), with the mean APBiodine of 3.01% and 3.42% for 140 and 120 kVp, respectively (Figure 3).

While assessing the iodine accuracy for each CTDIvol level and kVp combination setting, the poorest accuracy was found to be a low CTDIvol level of 5 mGy with the mean APBiodine of 5.11% at 120 kVp (P<0.05) and 3.72% at 140 kVp (P<0.05) (Figure 3). There were no significant differences of the iodine accuracy at 25, 20, 15 and 10 mGy for both 120 kVp and 140 kVp combination settings.
When the true iodine concentration was 7.5 and 10.0 mg/mL, the bias between the measured iodine concentration, and the true iodine concentration was the smallest at CTDIvol levels of 25, 20, 15, 10 mGy and both kVp combination settings. The highest accuracy was found for the true iodine concentration of 10 mg/mL with mean APBiodine of 0.31% at 25 mGy and 120 kVp combination setting. The true iodine concentration of 2.0 and 2.5 mg/mL showed a higher bias at all CTDIvol levels and kVp combination settings, and overall mean APBiodine was 8.33% (6.99–10.04%) for iodine concentration of 2.0 mg/mL and 5.56% (5.03–8.13%) for iodine concentration of 2.5 mg/mL (Figure 2).
The accuracy of iodine quantification was not influenced by different spectral IR levels. There was no significant difference in the accuracy of iodine quantification between the different spectral IR levels (P=0.998) (Figure 4).

Analysis of the variability (standard deviation) of all measurements obtained from five repeat scans showed that with the decrease in CTDIvol level, the standard deviation in measurement error increased, with the maximum standard deviation at CTDIvol level of 5 mGy. Moreover, with the increase in iodine concentration, the variability in measurement error was decreased, with the maximum standard deviation at iodine concentrations of 2.0 and 2.5 mg/mL. When iodine concentration was >5 mg/mL, the standard deviation was lower than 1% of all the studied CTDIvol levels, with the exception of CTDIvol level of 5 mGy (Figure 5).

VMI CT numbers quantification accuracy
The overall bias ranges of the VMI CT numbers of all iodine inserts at energy levels of 50, 70 and 120 keV was −34.4 to 28.9 HU, −18.8 to 5.3 HU and −9.6 to 17.9 HU, respectively, with the mean APBHU of 1.74%, 2.51% and 10.47%, respectively across both 120 and 140 kVp scans.
The CTDIvol levels had effects on the accuracy of VMI CT numbers at low, medium and high energy levels for both kVp settings. The accuracy was poorer at lower CTDIvol levels of 10 and 5 mGy compared to other CTDIvol levels (P<0.05). The mean APBHU over all measurements at 10 and 5 mGy was 1.82% and 2.03% for 50 keV, 3.52% and 5.16% for 70 keV, 11.79% and 13.40% for 120 keV, respectively. However, there was no significant difference in VMI CT numbers which were observed between CTDIvol levels of 25, 20 and 15 mGy (Figure 6).

To summarize the measurements between 120 and 140 kVp, tube voltage had different influences on the accuracy of the VMI CT numbers at the three energy levels. At energy level of 50 keV, the mean APBHU had no significant difference between 120 and 140 kVp (1.67% vs. 1.83%, P=0.125). At energy levels of 70 and 120 keV, 140 kVp produced a higher accuracy compared to 120 kVp, the mean APBHU of at 120 and 140 kVp being 3.62% vs. 2.99% for 70 keV (P<0.01), and 11.65% vs. 9.28% for 120 keV (P<0.01), respectively (Figure 7).

Analyzing the quantification accuracy of the VMI CT numbers at each CTDIvol level and kVp setting, we observed relatively poor accuracy at three energy levels at CTDIvol of 10 and 5 mGy for both kVp settings. However, there was no significant difference at the 140 kVp setting between 15 and 10 mGy both for 50 and 70 keV, and between 25, 20, 15 and 10 mGy for 120 keV, respectively.
The overall accuracy of the VMI CT number quantification for each of the true iodine concentration was different at low, medium, and high energy levels (Figure 6), with the accuracy being higher at true iodine concentrations larger than 5 mg/mL. The accuracy was degraded at iodine concentrations of 2.0 and 2.5 mg/mL, with the mean APBHU over all measurements of 3.09% and 2.16% for 50 keV, 6.28% and 6.41% for 70 keV, 28.12% and 24.84% for 120 keV, respectively.
The spectral IR levels used for reconstructions did not influence the accuracy of VMI CT numbers, with no significant differences observed in the quantification accuracy of VMI CT numbers among the different spectral IR levels (P=0.963) (Figure 8).

The pattern of changes in the standard deviation of the APBHU for the repeated scans at different CTDIvol levels for each iodine concentration was similar at the low, medium, and high energy levels. The standard deviation decreased with an increase in CTDIvol dose levels and iodine concentrations. At CTDIvol levels of 5 and 10 mGy, the standard deviation value was relatively high, especially at lower iodine concentrations of 2.0 and 2.5 mg/mL. For VMI energy level of 50 keV, the standard deviation of an iodine concentration of 2.0 mg/mL was nearly 5% at 5.0 mGy, while that of other iodine concentrations were below 2.5%. For VMI energy level of 70 keV, the standard deviation of iodine concentration of 2.0 mg/mL was >2% at 5 and 10 mGy, both greater than other iodine concentrations. For VMI energy level of 120 keV, the standard deviation of iodine concentrations of 2.0 and 2.5 mg/mL were greater than other iodine concentrations at all CTDIvol levels (Figure 9).

Discussion
In this study, we performed quantitative experiments on an iodine phantom using the DLCT technology which produced scans at different tube voltages, different CTDIvol dose levels, and spectral reconstructions using different spectral IR levels to investigate the effects of these parameters on the accuracy of iodine quantification and VMI CT numbers. Our results showed that the total iodine quantification bias ranged from −1.27 to 0.74 mg/mL, with the mean APB of 3.21%. The total VMI CT numbers bias ranged from the energy levels of 50, 70 and 120 keV was −34.4 to 28.9, −18.8 to 5.3 and −9.6 to 17.9 HU, respectively, with the mean APB of 1.74%, 2.51% and 10.47%, respectively across both tube voltages. Several iodine phantom quantitative studies have demonstrated the different levels of accuracy of DLCT-based iodine quantification and VMI CT numbers determination, all of which had showed a high accuracy. Duan et al. (27) have reported that a tube voltage of 120 kVp and CTDIvol level of 26.1 mGy, the bias range was −0.46 to 0.1 mg/mL with the percentage bias being −16% to 0.5% for iodine concentration and −17.7 to 55.7 HU for VMI CT numbers. Jacobsen et al. (28) have found that when true iodine concentrations were 2, 5 and 15 mg/mL, the mean iodine concentration bias was 1.03±0.07 and 1.12±0.31 mg/mL for 120 and 140 kVp, respectively.
There are very few investigations studying the effects of different radiation dose levels on the iodine quantification accuracy of DLCT. In the current study, radiation dose level at 10 mGy or higher had no effect on iodine quantification; when radiation dose level was reduced at 5 mGy, the accuracy of iodine quantification was significantly degraded. At energy levels of 50, 70 and 120 keV, the accuracy of VMI CT numbers was significantly degraded at radiation dosage of levels below 10 mGy. However, it must be stated that radiation dose levels of 5 mGy is well below what is normal for a standard clinical routine, especially for routine abdominal CT scans. When radiation dose levels of 5 mGy, a streaking artifact caused by X-ray photon starvation was observed. This could help explain the degradation of the accuracy of iodine quantification and VMI CT numbers at the 5 mGy radiation dose.
Our results showed that at low, medium and high energy levels, the accuracy of the VMI CT numbers determination was significantly degraded when the CTDIvol level was 10 mGy or lower; while the accuracy of the iodine quantification was significantly degraded when the CTDIvol level was 5 mGy or lower. Therefore, at a CTDIvol level of 10 mGy or lower, the quantification of VMI CT numbers tended to be affected by the radiation dose. Again, it must be emphasized that in clinical practice, a CTDIvol level of 10 mGy or lower is not commonly used for adult abdominal CT scans. In our medical institution, the CTDIvol level used for medium-sized adult abdomen scans is typically 15–20 mGy. Results from this study have shown that there is a possibility to further reduce the radiation dose in DLCT imaging without compromising the accuracy of iodine quantification and VMI CT number determination.
In this study, we observed that 140 kVp provided some improvements in the accuracy of iodine quantification when it was compared to 120 kVp (although not significant). At energy levels of 50, 70 and 120 keV, 120 and 140 kVp had different effects on the accuracy of VMI CT number determination. At the energy level of 50 keV, the two tube voltages had no effect on the accuracy of the VMI CT numbers. At energy levels of 70 and 120 keV, 140 kVp produced smaller bias of VMI CT numbers compared to 120 kVp. Similar findings about the effects of tube voltage on the accuracy of DLCT-based quantification were reported in other studies. A recent study measuring iodine concentration in Gammex phantom, using tube voltages of 120 and 140 kVp, radiation dose levels of 20 and 30 mGy, rotation times of 0.33 and 0.75 seconds, spectral IR levels of 0 and 3 demonstrated that the accuracy of iodine quantification was not highly sensitive to these parameters, indicating that stability in the accuracy of those measurements (23). In addition, the study also reported that there was no significant difference in the accuracy of iodine quantification between 140 and 120 kVp, and a higher tube voltage had produced a smaller iodine quantification bias. At higher tube voltages, DLCT makes for an improved method for allowing more high-energy photons to reach the lower layer of the detector, resulting in a greater spectral separation and more accurate quantitative data.
Compared with higher iodine concentrations, the accuracy of iodine quantification and VMI CT numbers at lower iodine concentrations of 2.0 and 2.5 mg/mL were relatively lower. However, while the APBs of iodine quantification at these iodine concentrations were 8.33% and 5.56%, the absolute bias was less than 0.2 mg/mL. This difference of iodine quantification is acceptable for clinical evaluation of lesions with iodine uptakes above 2 mg/mL (29). Similarly, for the assessment of accuracy of VMI CT number quantification of each true iodine concentration, of the measured values at 2.0 and 2.5 mg/mL showed relatively poor APB at 50, 70 and 120 keV, but the absolute bias from theoretical CT numbers was less than 5 HU for 50 and 70 keV, and about 6 HU for 120 keV. Therefore, when performing a VMI quantitative assessment of the CT numbers at three energy levels, the impact of such a difference is small. It must also be stated that the findings of the phantom study may somewhat differ from the in vivo measurements from the clinical patients. Our study used pure solid iodine in the phantom inserts, while the iodine quantification in DLCT is optimized for clinical applications with mixtures of iodine contrast agent with blood or tissue, and the quantitative values depend on the background material in which the iodine is embedded (24).
The results presented in this study show that the use of spectral IR did not affect the accuracy of iodine quantification and VMI CT numbers at different CTDIvol levels. Our findings are consistent with other DLCT-based works (22,23,30). This can be possibly explained by the energy spectral data acquisition process of the DLCT system, which first deals with the calculation of the spectral data and then performs the operation of IR, making the possibility of modification through IR quite limited (31). Several studies have shown that even at low energy levels, noise is still maintained at a very low level in DLCT (24,32). Sellerer et al. (33) have found that at energy level below 80 keV, image noise increases in DSCT and KVSCT, while DLCT exhibited no significant changes in the noise levels over the entire range of VMIs. The observed increase in image noise comparing the 40 keV to 140 keV was 14% for DLCT, compared to 265% using DSCT and 363% using KVSCT. In the DLCT system, the SBI is generated via projection space decomposition for low and high energy data to scatter-like (SC) and photoelectric-like (PE) data. The resulting noise for these two sets of data is anti-correlated, i.e., when the noise of SC component is high, then the corresponding noise of PE is low and vice-versa. This difference is suppressed by incorporating a statistical approach in the reconstructions of SC and PE images (31,32). Likewise, Sakabe et al. (34) investigated the image quality characteristics of VMI in DLCT by using the iodine phantom study. They reported that VMI images exhibit stable image noise over the entire energy spectrum, and the iodine VMI CT numbers for the iodinated enhancing materials were similar regardless of phantom size and acquisition method at each energy level. However, our study did not investigate the relationship between image noise and quantification indices, which will be addressed in future studies.
Consistent with the findings from other researchers, it is difficult to directly compare our results with those reported in other spectral CT studies, because various factors may affect the results. For example, different phantoms, scanning parameters, reconstruction algorithms, and scanners technology (27,35,36). Moreover, several phantom quantitative studies have been conducted on the comparison of different DECT scanners and different protocols (23,25,28,30,33). The phantom used in this experiment is made of uniform water-equivalent material. Moreover, this study did not take in consideration various factors from the heterogeneous environment of the real patients, especially without the inclusion of simulated osseous structures. Scholars have reported that at radiation levels of 20 and 30 mGy, the quantification error of iodine at 2.0 and 2.5 mg/mL was slightly increased (23). Another limitation is that we used a phantom that simulated an adult medium size. We did not evaluate scanners using different phantom sizes. Several studies have shown higher accuracy of iodine quantifications and VMI CT numbers determination in small-sized phantoms (22,33). The effects of the sizes of phantoms will be considered in future studies. The chemical composition of the phantom used in this study was provided by the manufacturer. Although the phantom itself has high precision, it is difficult to recalibrate it on the scanner, and from there, it remains unavoidable to not have a deviation between the calculated reference value and the true value. This study only evaluated the effects of a radiation dose and the IR on the accuracy of iodine quantification and VMI CT numbers determination. The effects of radiation dose and spectral IR on the objective and subjective indices of image quality will be investigated in future studies.
To conclude, DLCT-based accuracy of iodine quantification and VMI CT numbers determination are not affected by tube voltage and the use of spectral IR in protocols with radiation dose typically used in clinical routine. DLCT has the potential to further decrease radiation dose without losing the accuracy of energy spectrum quantification. Our experimental results provide valuable evidence for setting reasonable radiation dose levels for DLCT clinical applications.
Acknowledgements
None.
Footnote
Conflicts of Interest: Xingbiao Chen is employed by Philips Healthcare China, Inc., CT Clinical Science. Philips provided the iodine phantom for this study. The other authors have no conflicts of interest to declare.
References
- Goo HW, Goo JM, Dual-Energy CT. New horizon in medical imaging. Korean J Radiol 2017;18:555-69. [Crossref] [PubMed]
- Marin D, Boll DT, Mileto A, Nelson RC. State of the art: dual-energy CT of the abdomen. Radiology 2014;271:327-42. [Crossref] [PubMed]
- Fulton N, Rajiah P. Abdominal Applications of a novel detector-based spectral CT. Curr Probl Diagn Radiol 2018;47:110-8. [Crossref] [PubMed]
- Li L, Zhao Y, Luo D, Yang L, Hu L, Zhao X, Wang Y, Liu W. Diagnostic value of single-source dual-energy spectral computed tomography in differentiating parotid gland tumors: initial results. Quant Imaging Med Surg 2018;8:588-96. [Crossref] [PubMed]
- Marin D, Davis D, Roy Choudhury K, Patel B, Gupta RT, Mileto A, Nelson RC. Characterization of small focal renal lesions: diagnostic accuracy with single-phase contrast-enhanced dual-energy CT with material attenuation analysis compared with conventional attenuation measurements. Radiology 2017;284:737-47. [Crossref] [PubMed]
- Morgan DE. The role of dual-energy computed tomography in assessment of abdominal oncology and beyond. Radiol Clin North Am 2018;56:565-85. [Crossref] [PubMed]
- Thaiss WM, Haberland U, Kaufmann S, Spira D, Thomas C, Nikolaou K, Horger M, Sauter AW. Iodine concentration as a perfusion surrogate marker in oncology: Further elucidation of the underlying mechanism using volume perfusion CT with 80 kVp. Eur Radiol 2016;26:2929-36. [Crossref] [PubMed]
- Kawamoto S, Fuld MK, Laheru D, Huang P, Fishman EK. Assessment of iodine uptake by pancreatic cancer following chemotherapy using dual-energy CT. Abdom Radiol (NY) 2018;43:445-56. [Crossref] [PubMed]
- Patel BN, Thomas JV, Lockhart ME, Berland LL, Morgan DE. Single-source dual-energy spectral multidetector CT of pancreatic adenocarcinoma: optimization of energy level viewing significantly increases lesion contrast. Clin Radiol 2013;68:148-54. [Crossref] [PubMed]
- Cramer TW, Fletcher JG, Paden RG, Boltz TF 2nd, Stiles WL, Pavlicek W, Silva AC. A primer on the use of dual-energy CT in the evaluation of commonly encountered neoplasms. Abdom Radiol (NY) 2016;41:1618-31. [Crossref] [PubMed]
- Xin L, Yang X, Huang N, Du X, Zhang J, Wang Y, Hou L, Gao J. The initial experience of the upper abdominal CT angiography using low-concentration contrast medium on dual energy spectral CT. Abdom Imaging 2015;40:2894-9. [Crossref] [PubMed]
- Agrawal MD, Oliveira GR, Kalva SP, Pinho DF, Arellano RS, Sahani DV. Prospective comparison of reduced-iodine-dose virtual monochromatic imaging dataset from dual-energy CT angiography with standard-iodine-dose single-energy CT angiography for abdominal aortic aneurysm. AJR Am J Roentgenol 2016;207:W125-W132. [Crossref] [PubMed]
- Shuman WP, Green DE, Busey JM, Mitsumori LM, Choi E, Koprowicz KM, Kanal KM. Dual-energy liver CT: effect of monochromatic imaging on lesion detection, conspicuity, and contrast-to-noise ratio of hypervascular lesions on late arterial phase. AJR Am J Roentgenol 2014;203:601-6. [Crossref] [PubMed]
- Pomerantz SR, Kamalian S, Zhang D, Gupta R, Rapalino O, Sahani DV, Lev MH. Virtual monochromatic reconstruction of dual-energy unenhanced head CT at 65–75 keV maximizes image quality compared with conventional polychromatic CT. Radiology 2013;266:318-25. [Crossref] [PubMed]
- Agrawal MD, Pinho DF, Kulkarni NM, Hahn PF, Guimaraes AR, Sahani DV. Oncologic applications of dual-energy CT in the abdomen. Radiographics 2014;34:589-612. [Crossref] [PubMed]
- Yu L, Leng S, McCollough CH. Dual-energy CT-based monochromatic imaging. AJR Am J Roentgenol 2012;199:S9-15. [Crossref] [PubMed]
- Kim C, Kim D, Lee KY, Kim H, Cha J, Choo JY, Cho PK. The optimal energy level of virtual monochromatic images from spectral CT for reducing beam-hardening artifacts due to contrast media in the thorax. AJR Am J Roentgenol 2018;211:557-63. [Crossref] [PubMed]
- Johnson TR. Dual-energy CT: general principles. AJR Am J Roentgenol 2012;199:S3-8. [Crossref] [PubMed]
- Megibow AJ, Kambadakone A, Ananthakrishnan L. Dual-energy computed tomography: Image acquisition, processing, and workflow. Radiol Clin North Am 2018;56:507-20. [Crossref] [PubMed]
- Rassouli N, Etesami M, Dhanantwari A, Rajiah P. Detector-based spectral CT with a novel dual-layer technology: principles and applications. Insights Imaging 2017;8:589-98. [Crossref] [PubMed]
- Rajiah P, Rong R, Martinez-Rios C, Rassouli N, Landeras L. Benefit and clinical significance of retrospectively obtained spectral data with a novel detector-based spectral computed tomography - Initial experiences and results. Clin Imaging 2018;49:65-72. [Crossref] [PubMed]
- Pelgrim GJ, van Hamersvelt RW, Willemink MJ, Schmidt BT, Flohr T, Schilham A, Milles J, Oudkerk M, Leiner T, Vliegenthart R. Accuracy of iodine quantification using dual energy CT in latest generation dual source and dual layer CT. Eur Radiol 2017;27:3904-12. [Crossref] [PubMed]
- Hua CH, Shapira N, Merchant TE, Klahr P, Yagil Y. Accuracy of electron density, effective atomic number, and iodine concentration determination with a dual-layer dual-energy computed tomography system. Med Phys 2018;45:2486-97. [Crossref] [PubMed]
- Ehn S, Sellerer T, Muenzel D, Fingerle AA, Kopp F, Duda M, Mei K, Renger B, Herzen J, Dangelmaier J, Schwaiger BJ, Sauter A, Riederer I, Renz M, Braren R, Rummeny EJ, Pfeiffer F, Noël PB. Assessment of quantification accuracy and image quality of a full-body dual-layer spectral CT system. J Appl Clin Med Phys 2018;19:204-17. [Crossref] [PubMed]
- Kim H, Goo JM, Kang CK, Chae KJ, Park CM. Comparison of iodine density measurement among dual-energy computed tomography scanners from 3 vendors. Invest Radiol 2018;53:321-7. [Crossref] [PubMed]
- Berger M, Hubbell J, Seltzer S, Chang J, Coursey J, Sukumar R, Zucker D, Olsen K. XCOM: Photon Cross Section Database. National Institute of Standards and Technology. Available online: http://physics.nist.gov/PhysRefData/Xcom/html/xcom1.html. Published March 1998. Updated November 2010.
- Duan X, Arbique G, Guild J, Xi Y, Anderson J. Technical Note: Quantitative accuracy evaluation for spectral images from a detector-based spectral CT scanner using an iodine phantom. Med Phys 2018;45:2048-53. [Crossref] [PubMed]
- Jacobsen MC, Schellingerhout D, Wood CA, Tamm EP, Godoy MC, Sun J, Cody DD. Intermanufacturer comparison of dual-energy CT iodine quantification and monochromatic attenuation: a phantom study. Radiology 2018;287:224-34. [Crossref] [PubMed]
- Chang S, Hur J, Im DJ, Suh YJ, Hong YJ, Lee HJ, Kim YJ, Han K, Kim DJ, Lee CY, Shin HY, Choi BW. Volume-based quantification using dual-energy computed tomography in the differentiation of thymic epithelial tumours: an initial experience. Eur Radiol 2017;27:1992-2001. [Crossref] [PubMed]
- Sauter AP, Kopp FK, Münzel D, Dangelmaier J, Renz M, Renger B, Braren R, Fingerle AA, Rummeny EJ, Noël PB. Accuracy of iodine quantification in dual-layer spectral CT: Influence of iterative reconstruction, patient habitus and tube parameters. Eur J Radiol 2018;102:83-8. [Crossref] [PubMed]
- Philips Healthcare. A scientific review of dual-energy and spectral computed tomography imaging. Available online: http://clinical.netforum.healthcare.philips.com/us_en/Explore/White-Papers/CT/A-scientific-review-of-dual-energy-and-spectral-computed-tomography-imaging. Accessed Jun 4, 2018.
- Ozguner O, Dhanantwari A, Halliburton S, Wen G, Utrup S, Jordan D. Objective image characterization of a spectral CT scanner with dual-layer detector. Phys Med Biol 2018;63:025027. [Crossref] [PubMed]
- Sellerer T, Noël PB, Patino M, Parakh A, Ehn S, Zeiter S, Holz JA, Hammel J, Fingerle AA, Pfeiffer F, Maintz D, Rummeny EJ, Muenzel D, Sahani DV. Dual-energy CT: a phantom comparison of different platforms for abdominal imaging. Eur Radiol 2018;28:2745-55. [Crossref] [PubMed]
- Sakabe D, Funama Y, Taguchi K, Nakaura T, Utsunomiya D, Oda S, Kidoh M, Nagayama Y, Yamashita Y. Image quality characteristics for virtual monoenergetic images using dual-layer spectral detector CT: Comparison with conventional tube-voltage images. Phys Med 2018;49:5-10. [Crossref] [PubMed]
- Marin D, Pratts-Emanuelli JJ, Mileto A, Husarik DB, Bashir MR, Nelson RC, Boll DT. Interdependencies of acquisition, detection, and reconstruction techniques on the accuracy of iodine quantification in varying patient sizes employing dual-energy CT. Eur Radiol 2015;25:679-86. [Crossref] [PubMed]
- Nute JL, Jacobsen MC, Stefan W, Wei W, Cody DD. Development of a dual-energy computed tomography quality control program: Characterization of scanner response and definition of relevant parameters for a fast-kVp switching dual-energy computed tomography system. Med Phys 2018;45:1444-58. [Crossref] [PubMed]

