
Agreement between gamma passing rates using computed tomography in radiotherapy and secondary cancer risk prediction from more advanced dose calculated models
Introduction
The medulloblastoma, the most common central nervous system malignant tumor in children, requires cranial and spinal irradiations (1,2). The radiotherapy techniques for spinal region result in irradiation of large volumes of normal tissues to rather high doses (e.g., heart, lung and esophagus) (3). The routine evaluation of radiotherapy plans is performed by assessing physical parameters derived from dose volume histograms (DVH). In addition, based on DVH data, the radiobiological modelling allows to estimate the clinical outcomes of radiotherapy such as the tumor control probability (TCP) and the normal tissue complication probability (NTCP). Similarly, the secondary cancer risk (SCR) models in radiotherapy are also using the dosimetric data displayed on medical imaging to estimate this risk. Several approaches and models have been proposed for estimating the SCR (e.g., dose-responses relating to linear, linear-exponential, plateau and linear-quadratic models) (4-9). Estimating the SCR can be used as a strategy to rank and optimize the treatment plan in order to limit the dose to the organs. The goal of this study is to estimate quantitatively the potential impact of the lateral electron transports modeling on radiation-induced second cancers prediction.
Methods
Dose calculation using CT medical imaging and plan comparison
Clinical examples of treatment plan for pediatric cranio-spinal irradiation patients were used, as example, to evaluate the impact of dose calculation models on the SCR prediction for normal lungs. Thus, the study is based on the comparison between DVH from plans generated using two different dose calculation algorithms. The same prescribed dose to the target was considered in both plans resulting, however, in different number of monitor units (MUs) per field: the doses were calculated respectively using type ‘a’ and type ‘b’ algorithms. Typing ‘a’ algorithm as pencil beam convolution with modified Batho’s method does not consider change in lateral electron transport and only takes account of scattered dose. This algorithm type was only used to generate and quantify differences between the two predictions of SCR. The type ‘b’ algorithm considers approximately the lateral electron transport as well as the scattered dose to calculate the delivered dose, which is translated into MUs. The anisotropic analytical algorithm (AAA) is the used type ‘b’ algorithm. All treatment plans were generated using the Eclipse® treatment planning system (TPS), (Varian Medical Systems, Palo Alto, CA, USA) (10-13). The dose distribution in CT-images from both plans were analyzed using gamma (γ) index to calculate the percentage of pixels of γ passing rates (95% of pixels with γ ≤1) (14).
Application of cancer risk models to radiotherapy plans
The excess absolute risk (EAR) estimation for an organ is based on the use of the DVH from radiotherapy plan. This is similar to equivalent uniform dose (EUD) concept to estimate TCP and NTCP. Figure 1 shows the use of physical parameters from DVH metrics to estimate the radiotherapy outcomes including TCP, NTCP and SCR.

The use of physical parameters from cumulative dose volume histograms (cDVH), and differential dose volume histograms (dDVH) metrics, to estimate radiotherapy outcomes including toxicity and secondary cancer risk. EUD, equivalent uniform dose; OED, organ equivalent dose.
Modeling of SCR
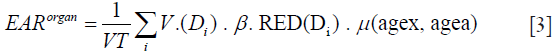
The EAR in a small volume of an organ is expressed by a dose dependent function with an initial slope β, the risk equivalent dose as RED(D) and the function µ describing the change in EAR with age at exposure (agex) and age attainted (agea) using age related parameters (15):

where RED is the dose-response relationship for radiation induced cancer in units of dose and β describes the slope of the dose response curve at low dose. The modifying function µ contains the population dependent variables, e.g., for age (not used for the present results):

where γe and γa are age modifying parameters.
Using the Eq. [2], the fit parameters are gender averaged and centered at an age at exposure of 30 years and an attained age of 70 years. The βEAR and the age modifying parameters for different sites can be taken from Preston et al. 2007 (16).
Estimating the SCR from dose distribution in CT-images
Using {vi, Di} from differential DVH, the EAR for a specific organ can be obtained as:
where VT is the total organ volume and the sum is taken over all bins of the DVH.
In this study, the risk estimates are applied to the same case, but using two DVHs from radiotherapy plans. Using the same parameters for the same patient (including gender, age at exposure and age attained), the EAR ratio for lung from both plans can be evaluated as:
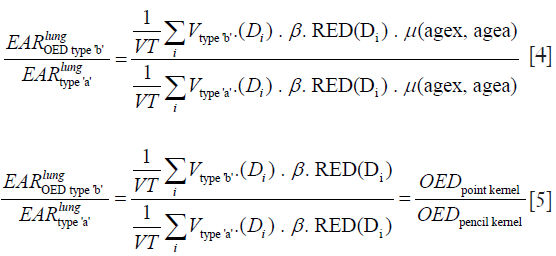
We can describe the risk ratio, EAR, from both treatment plans as the organ equivalent dose (OED) ratios. The OED can be determined on the basis of an organ specific dose response relationship (RED) and from the DVH. The OED values are independent of the β, and the function µ. Thus, the use of EAR ratio avoids the uncertainties in the parameters needed in the Eq. [1].
In this study, only the lungs as organs at risk were included. The OED for linear model, linear-exponential model and plateau model were calculated respectively as:
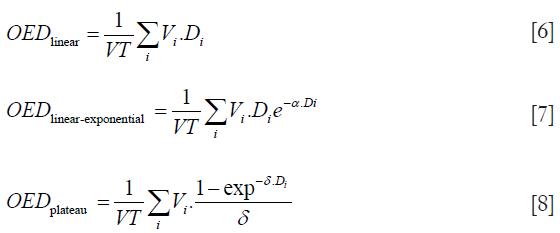
where α is a tissue specific parameter and δ is an organ specific dose response parameter. For lung the parameters were α =0.129 for linear exponential model and δ =0.139 for plateau model.
Results
The AAA showed more heterogeneous dose distribution compared to pencil beam method. Thus, the dose distribution for lungs were more heterogeneous using type ‘b’ algorithm compared to type ‘a’. In addition, the type ‘b’ predicted a significant dose difference to average lung dose by a factor of 1–1.1. Therefore, the OED was significantly increased predicting more risks. The Figure 2 shows dose distributions for the lungs in frontal plan using, respectively, types ‘a’ and ‘b’ algorithms. The lower panel in Figure 2 shows 2D γ-maps plotted in the frontal plan. It can be seen that electron transports goes deeper through the normal lung tissues with a distance to agreement (DTA) varying from 2 to 8 mm and dose differences (∆Dose) of about ±3%. The Figure 3 shows a comparison of OED values and EAR ratio given by the three SCR models. It can be seen that the shift on DVH bins, resulting from type ‘b’, has a considerable influence on the OED and EAR values.


Discussion
The risk of secondary cancer should be more properly estimated by using more advanced algorithms producing more accurate DVH. The results presented in this paper suggest that the contribution of lateral electron transport worth to be included for the risk estimation of secondary cancers. The modern algorithms in radiation oncology are thus expected to calculate more accurately the dose distribution around the lungs. Indeed, they were recommended to calculate DVH for better estimating TCP/NTCP (17-19). The γ-maps confirmed the observed results from dose distribution, showing more dose in the lungs using type ‘b’ algorithm. For example, it can be seen in the Figure 2 that the isodose curves were more extended in the lateral direction >1 mm, leading to more dose deposit in normal tissues.
However, regarding γ, it is interesting to note that there are also some other techniques to compare dose distributions more or less similarly to γ, such as delta envelope, chi-index. In this context, a caution should be done when comparing dose distribution with Monte Carlo (MC) to avoid the over/underestimated average γ-value due to the increase of the statistical noise level in the dose distributions (20-22).
Assuming that the DVH produced by type ‘b’ algorithm is the closest to the “real” situation, we note that the OEDs were significantly increased predicting more SCR compared with type ‘a’ algorithm. Consistently, the SCR models predict more EAR, about 1–1.2 times larger, than type ‘a’ algorithm. The predicted risk is low in terms of absolute value. However, for radiation protection purpose, the more trusted estimated risk with DVH including the contribution of electron transport is recommended, to rank and compare photon therapy plans or to compare with proton irradiation. Furthermore, attention should be paid to select the most appropriate SCR models.
Uncertainties of dose calculation algorithms and secondary cancer models
The use of dose calculation methods (type ‘a’) that compute the dose using only scattered dose would yield wrong results and somehow under estimate the SCR, in particular for lungs where the contribution of lateral electron transport in the dose distribution is significant. The delivered dose, to the isocentre from 3DRT irradiation technique, required more MUs (from 3% to 5%) using type ‘b’ taking account of lateral electron transport, as AAA algorithm, compared to former model as pencil beam (type ‘a’) when prescribing the same dose (23).
Nevertheless, the more recent algorithms, as type ‘c’, such as Acuros-XB is recommended to calculate the dose distribution (24). Thus, a more incertitude can be observed in the choice of dose calculation algorithms. The objective of this study is to assess the incertitude due to dose calculation algorithms types ‘a’ and ‘b’ as well as OED models. The much more modern engine, could be also used to compute DVH and OED, but it is also not near to reference standard dose calculation such as MC.
By principle, different dose distribution in an organ could yield the same OED, if they are able to cause the same radiation induced cancer incidence. Then, the EAR as a function of OED and other patient related parameters, as age parameters, can be estimated from radiotherapy plans. However, the uncertainties are still very high due to the unknown processes of the induction of secondary carcinoma and sarcoma. More recently, Nguyen et al. 2015, showed that the uncertainties in the dose response curves could exceed 100% for the prediction of second cancer risk. However, if the strategy is to compare treatment plans, the precision is around 10% (25). Thus, the accuracy and precision of the dose calculation, as well as more adapted parameters for OED and EAR are well in the scope of such a precision level, and should be recommended to better estimate the SCR.
Conclusions
The precision of secondary cancers prediction depends on the dose distribution using medical imaging and dose response models as well as epidemiological data. We advise to use the more advanced photon dose algorithms with 3D heterogeneity corrections as models including Grid-based Boltzmann Transport equation or MC algorithms. Present SCR models still have poor absolute capacities of prediction, however, ratio may be used with caution to rank radiotherapy plans.
Acknowledgements
This research is contributing to the ProtonShare project, and is partially supported by the French research funding agency, Agence Nationale de la Recherche, in the frame of the “Investments for the Future” under the reference: France HADRON, ANR-11-INBS-0007.
Footnote
Conflicts of Interest: The authors have no conflicts of interest to declare.
References
- Kortmann RD, Kuhl J, Timmermann B, Mittler U, Urban C, Budach V, Richter E, Willich N, Flentje M, Berthold F, Slavc F, Wolff J, Meisner C, Wiestler O, Sörensen N, Warmuth-Metz M, Bamberg M. Postoperative neoadjuvant chemotherapy before radiotherapy as compared to immediate radiotherapy followed by maintenance chemotherapy in the treatment of medulloblastoma in childhood: Results of the German prospective randomized trial HIT’91. Int J Radiat Oncol Biol Phys 2000;46:269-79. [Crossref] [PubMed]
- Zeltzer PM, Boyett JM, Finlay JL, Albright AL, Rorke LB, Milstein JM, Allen JC, Stevens KR, Stanley P, Li H, Wisoff JH, Geyer JR, McGuire-Cullen P, Stehbens JA, Shurin SB, Packer RJ. Metastasis stage, adjuvant treatment, and residual tumor are prognostic factors for medulloblastoma in children: Conclusions from the Children’s Cancer Group 921 randomized phase III study. J Clin Oncol 1999;17:832-45. [Crossref] [PubMed]
- Bindra RS, Wolden SL. Advances in Radiation Therapy in PediatricNeuro-oncology. J Child Neurol 2016;31:506-16. [Crossref] [PubMed]
- Daşu A, Toma-Dasu I, Olofsson J, Karlsson M. The use of risk estimation models for the induction of secondary cancers following radiotherapy. Acta Oncol 2005;44:339-47. [Crossref] [PubMed]
- Kry SF, Salehpour M, Followill DS, Stovall M, Kuban DA, White RA, Rosen II. The calculated risk of fatal secondary malignancies from intensity-modulated radiation therapy. Int J Radiat Oncol Biol Phys 2005;62:1195-203. [Crossref] [PubMed]
- Mu X, Bjork-Eriksson T, Nill S, Oelfke U, Johansson KA, Gagliardi G, Johansson L, Karlsson M, Zackrisso B. Does electron and proton therapy reduce the risk of radiation induced cancer after spinal irradiation for childhood medulloblastoma? A comparative treatment planning study. Acta Oncol 2005;44:554-62. [Crossref] [PubMed]
- Schneider U, Zwahlen D, Ross D, Kaser HB. Estimation of radiation-induced cancer from three-dimensional dose distributions: Concept of organ equivalent dose. Int J Radiat Oncol Biol Phys 2005;61:1510-5. [Crossref] [PubMed]
- Schneider U, Kaser HB. Radiation risk estimates after radiotherapy: Application of the organ equivalent dose concept to plateau dose-response relationships. Radiat Environ Biophys 2005;44:235-9. [Crossref] [PubMed]
- Schneider U, Lomax A, Timmermann B. Second cancers in children treated with modern radiotherapy techniques. Radiotherapy and Oncology 2008;89:135-40. [Crossref] [PubMed]
- El-Khatib E, Battista JJ. Improved lung dose calculation using tissue-maximum ratios in the Batho correction. Med Phys 1984;11:279-86. [Crossref] [PubMed]
- Thomas SJ. A modified power-law formula for inhomogeneity corrections in beams of high-energy x-rays. Med Phys 1991;18:719-23. [Crossref] [PubMed]
- Ulmer W, Harder D. A triple Gaussian pencil beam model for photon beam treatment planning. Med Phys 1995;5:25-30. [Crossref]
- Sievinen J, Ulmer W, Kaissl W. AAA photon dose calculation model in Eclipse. Palo Alto (CA): Varian Medical Systems 2005:1-18.
- Chaikh A, Balosso J. Quantitative comparison of dose distribution in radiotherapy plans using 2D gamma maps and X-ray computed tomography. Quant Imaging Med Surg 2016;6:243-9. [Crossref] [PubMed]
- Schneider U, Sumila M, Robotka J. Site-specific dose-response relationships for cancer induction from the combined Japanese A-bomb and Hodgkin cohorts for doses relevant to radiotherapy. Theor Biol Med Model 2011;8:27. [Crossref] [PubMed]
- Preston DL, Ron E, Tokuoka S, Funamoto S, Nishi N, Soda M, Mabuchi K, Kodama K. Solid cancer incidence in atomic bomb survivors: 1958-1998. Radiat Res 2007;168:1-64. [Crossref] [PubMed]
- Chaikh A, Balosso J. Assessing the shift of radiobiological metrics in lung radiotherapy plans using 2D gamma index. Transl Lung Cancer Res 2016;5:265-71. [Crossref] [PubMed]
- Chaikh A, Balosso J. NTCP variability in radiotherapy of lung cancer when changing the radiobiologic models and the photon dose calculation algorithms. J Cancer and Clin Oncol 2016;2.
- Chaikh A, Docquière N, Bondiau PY, Balosso J. Impact of dose calculation models on radiotherapy outcomes and quality adjusted life years for lung cancer treatment: do we need to measure radiotherapy outcomes to tune the radiobiological parameters of a normal tissue complication probability model? Transl Lung Cancer Res 2016;5:673-80. [Crossref] [PubMed]
- Blanpain B, David M. The delta envelope: A technique for dose distribution comparison. Medical Physics 2009;36:797-808. [Crossref] [PubMed]
- Bakai A, Alber M, Nusslin F. A revision of the gamma-evaluation concept for the comparison of dose distributions. Phys Med Biol 2003;48:3543-53. [Crossref] [PubMed]
- Graves YJ, Jia X, Jiang BS. Effect of statistical fluctuation in Monte Carlo based photon beam dose calculation on gamma index evaluation. Phys Med Biol 2013;58:1839-53. [Crossref] [PubMed]
- Chaikh A, Balosso J. Statistic and dosimetric criteria to assess the shift of the prescribed dose for lung radiotherapy plans when integrating point kernel models in medical physics: are we ready? Transl Lung Cancer Res 2016;5:681-7. [Crossref] [PubMed]
- Chaikh A, Khamphan C, Kumar T, Garcia R, Balosso J. What should we know about photon dose calculation algorithms used for radiotherapy? Their impact on dose distribution and medical decisions based on TCP/NTCP. Int J Cancer Ther Oncol 2016;4:4418.
- Nguyen J. Assessment of uncertainties in radiation-induced cancer risk predictions at clinically relevant doses. Med Phys 2015;42:81-9. [Crossref] [PubMed]

