
Evaluation of MR thermometry with proton resonance frequency method at 7T
Introduction
Non-invasive measurement and mapping of the spatiotemporal distribution of tissue temperature is very important for the development and application of novel thermotherapy techniques. Imaging of temperature changes is feasible with magnetic resonance imaging (MRI) techniques, and temperature maps can be acquired based on the proton resonance frequency (PRF) and phase measurements, the mapping of relaxation time T1, the apparent diffusion coefficient (D), or MR spectroscopic imaging (MRSI) of tissue water via chemical shift imaging (1-4). Among the various MRI techniques to measure temperature changes, PRF-based phase-shift imaging is the most used highly accurate method (5,6). This technique is relatively independent of tissue type and can provide useful information for thermal therapies in a variety of tissue organ sites ex vivo or in vivo (7-12). Therefore, it is extensively used to noninvasively monitor the evolution of tissue temperature heated by focused ultrasound (13,14) or laser (15), and is widely used to guide local thermal ablation treatment (15).
Currently, most MR-based temperature mapping during thermal therapy and ablation is performed on MRI scanners ≤3T. For example, Botnar et al. used the PRF technique to acquire and generate temperature maps after radio frequency (RF) ablation with an open 0.5T MRI system under ex vivo and in vivo conditions (16), and Kuroda et al. developed a self-reference thermometry technique using complex field estimation and optimized the technique for 0.5T (17). The developments and applications of temperature mapping have been mostly done at 1.5T and 3T (15,18-20). Typically, when using low field clinical scanners, the PRF shifts associated with the local tissue temperature changes are very small, and therefore, the sensitivity to temperature change (or temperature-to-noise ratio, TNR) generated by the phase shifts is low. Applications of MRI-based temperature mapping at higher field are just beginning to emerge in animal models, but already show great potential for improving diagnosis and therapy because higher temporal/spatial resolution as well as higher TNR could be achieved (21-24). Therefore, further work evaluating the sensitivity of MR-based temperature mapping at high MR fields is of particular interest.
In this study, we designed an easily-characterized and controlled gel phantom to calibrate the temperature coefficient via fitting a linear relationship between actual temperature and phase difference. The MR-based thermometry was then performed in both ex vivo and in vivo experiments to examine the temperature sensitivity at 7T using focused ultrasound heating.
Methods
The resonance frequency of water protons is affected by temperature and can be expressed as (13,25):
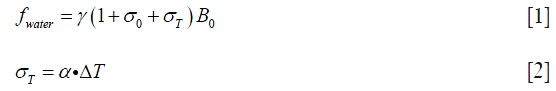
where σT and σ0 represent the local magnetic field changes caused by temperature and non-temperature factors, B0 is the static magnetic field strength and γ the gyromagnetic ratio, ∆T is the temperature change (°C), and α is the temperature dependent coefficient (ppm/°C). The resonance frequency change resulting from temperature can be written as:

Clearly at higher field strength B0, same temperature change ∆T would lead to greater ∆f, indicating higher temperature sensitivity (or TNR) can be achieved. For a given echo time (TE, unit: s), the accumulated phase variation (or phase difference) ∆ϕ(x,y) (unit: °) at position (x, y) during TE is (13,25):
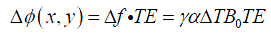
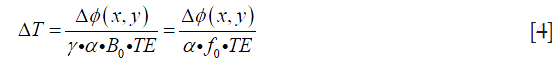
where f0 represents the resonance frequency (MHz). Eq. [4] suggests that temperature change could be estimated from phase difference image ∆ϕ(x,y) when α is known.
In this study, all the MR measurements were performed on a 7T animal scanner (Bruker, Ettlingen, Germany), with a bore diameter of 200 mm and a gradient coil capable of generating a maximum gradient amplitude of 400 mT/m. The pulse sequence for the MR thermometry was FLASH, with TR =100 ms, TE =2.6 ms, and Flip Angle =30°. Other imaging parameters included: image matrix size =128×128, FOV =3.5×3.5 cm2, slice thickness =2 mm, with 4 averages for each slice. Data acquisition consisted of 20 repetitions for phantom experiment and 16 repetitions for ex vivo and in vivo experiments. For each experiment, the first 6 repetitions were treated as baseline references, and the heating was applied at the 7th repetition. Data were acquired continuously and the total imaging time was about 17 minutes. After data acquisition, the phase images were reconstructed and unwrapped (with the tool provided by the scanner console) for further processing using custom MATLAB (The MathWorks, Inc.) programs, the phase difference ∆ϕ was obtained by subtracting the baseline phase from the rest of the phase images.
Phantom experiment
The phantom used to calculate the temperature coefficient consisted of an outer tube (inner diameter =2.7 cm) containing agarose gel (1.0%) sealed by wax to prevent water evaporation and a soft inner tube (inner diameter =0.5 cm), which heated the surrounding gel via hot water injection. Gel temperature was measured via an MR-compatible thermometer located adjacent to the soft tube. Figure 1 shows an axial section of the phantom.

To investigate the relationship between temperature and phase difference, the serial images after the peak temperature were utilized because the temperature changes over this period were slower and more stable. A region of interest (ROI) that corresponded to the position of the thermometer was extracted to calculate the phase differences which were further correlated with the temperatures recorded by the thermometer.
Ex vivo and in vivo evaluations
Following the phantom experiment, ex vivo and in vivo evaluations were performed using the temperature coefficient calculated from the phantom experiment. Focused ultrasound was used as the heating source because it is a unique and non-invasive technique able to deposit thermal energy locally inside the tissue (11). The ultrasound transducer (Boston Piezo-Optics Inc., USA) has an inner diameter of 4cm driven by AG 1020 Amplifier (T&C Power Conversion). Beef muscle tissues in ex vivo experiments were of ~10×10×10 cm3 in size.
The in vivo rat experiment was approved by the Animal Care and Use Committee (ACUC) of Wake Forest University. Two adult male Sprague-Dawley rats (300–350 g) underwent simultaneous imaging and heating experiments in which each rat was mounted on the animal bed in prone position, and was initially anesthetized with 3% isoflurane in O2 at a rate of 3 L/min via a face mask and was maintained at 1.5% isoflurane at 1 L/min during image acquisition. The rat’s hind leg was fixed and taped in a container filled with ultrasound gel for acoustic coupling. The hind leg was selected for the easy setup and also this region includes large and uniform thigh muscles to view the temperature changes. After experiments, rats were returned to their cage upon recovery from anaesthesia.
The ex vivo and in vivo data were processed offline: phase images were first reconstructed and unwrapped following the aforementioned approach, then the temperature maps were obtained using the phase difference and the temperature coefficient α (calculated from the phantom experiment).
Results
Table 1 lists the temperature values measured by the thermometer and the corresponding phase changes of the phantom experiment. Figure 2 shows the results of a linear regression applied to the data using the least squares method, the slight non-linearity between the temperature and phase difference could be due to the measurement error. From the slope of this line, the temperature coefficient in our experiment can be calculated as:

Full table

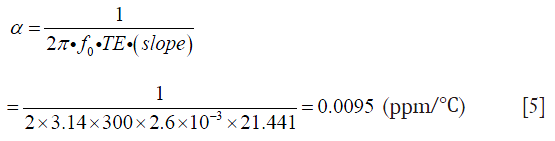
which is consistent with ~0.01 ppm/°C as reported in other literatures (7,26) and greater than the value (0.0085 ppm/°C) reported by Olsrud et al. using a 1.5T MRI scanner (27). Combined with the recorded real baseline temperature, the absolute temperature of the phantom at each stage can be obtained as shown in Figure 3. The temperatures of the baseline images (repetitions #1 to #6) were reasonably stable, while repetition #7 had flow artifacts due to the injection of the hot water. After hot water injection, it was evident that heat energy spreads outwards from the central inner tube, resulting eventually in a uniformly distributed temperature map with increased temperature due to the heat absorption. The estimated temperature sensitivity should be less than 1 °C based on the visual assessment on the color maps. These results indicate the high sensitivity of temperature mapping at 7T.

Figure 4 displays the temperature mapping in beef muscle with the ultrasound power of 6 w, exhibiting excellent target visualization and continuous temperature evolution. Similarly, Figure 5 shows the temperature mapping in a living rat’s hind leg (ultrasound power 7 w). The slight temperature variations in the unheated regions in Figures 4,5 might be attributed to field inhomogeneity. A rough spatial resolution, <1 mm, can be estimated from the temperature mapping, which supports the use of high spatial resolution temperature mapping to monitor temperature changes in vivo.


Discussion
In this study, the sensitivity of an MR-based temperature mapping was studied at 7T using PRF technique. An agarose gel phantom was designed to calculate the temperature coefficient. Through fitting the temperature vs. phase difference data, the calculated temperature coefficient is 0.0095 ppm/°C, in agreement with other measurements at lower fields (7,26-28). Both the ex vivo (beef muscle) and in vivo (rat) experiments showed clear localization of temperature changes.
The PRF scheme used in this paper for MR thermometry was based on phase difference, and therefore it is very sensitive to motion artifacts, such as those due to animal’s respiration, heartbeat, and organ motion/deformation. Some schemes called referenceless PRF thermometry, or self-reference methods have been devised and optimized to overcome this problem (17,29), in which the baseline phase of the heated ROI is estimated by extrapolating the phase in the surrounding tissue. Subtracting the estimated baseline phase from the actual phase under heated condition, the temperature distribution in the heated region can be obtained. As this technique does not need additional baseline scans prior to heating, it significantly reduces errors associated with motion and frequency drift during thermal ablation or treatment. However, this scheme might be only applicable to relatively uniform regions, such as muscles. In addition, the sizes of selected heated ROI and the surrounding region (to fit the baseline phase) can severely influence thermometry accuracy.
Phase unwrapping is another challenging problem for MR thermometry. Phase is calculated by the tangent inverse function that applies modulo 2π operation to the true phase, resulting in the calculated phase being limited to (−π, π), which causes different artificial discontinuities or jumps to appear in the phase function. Phase unwrapping algorithms aim to remove these artificial phase jumps, which can still be problematic when the image contains severe noise or deformation.
It should be noted that the PRF method may be only applicable to fat free (or very low fat) tissues. In adipose tissues, the temperature dependence is dominated by susceptibility in which the temperature sensitivity is usually several orders lower than for water and may not be detectable (12). Therefore, when MR thermometry is used in fat rich tissues, a fat suppression technique should be applied.
There were several limitations in this study. First, a very small number of rats were included and only a uniform region (thigh muscle) was examined. To obtain more reliable results, a larger sample size will have to be used. When applying this technique to other tissues, a strategy to overcome the possible motions of respiration, heartbeat, and/or organ movement must be established. Second, in the phantom calibration experiment, the temperature probe was placed touching but outside the inner tube. Clearly accuracy should be improved if the probe could be placed inside the inner tube to record the water temperature directly. And third, a relative simple focused ultrasound (limited power and size) was used in this study, to achieve higher sensitivity and flexibility, a better high intensity focused ultrasound (HIFU, with higher power, larger diameter, and adjustable focus depth) would be preferred. Fourth, the temporal resolution could be improved by utilizing other fast imaging sequences, such as gradient-echo echo planar imaging (EPI) technique (30). Finally, we employed FLASH sequence to acquire data and the parameters were optimized under the considerations of signal-to-noise ratio and scan time. However, TE may be further optimized in terms of the improvement of temperature sensitivity (12). Nevertheless, the results in this study demonstrate the sensitivity of MR thermometry using PRF technique at 7T in both ex vivo and in vivo experiments, which shows promise and great potential for future development and application of novel thermotherapy techniques at higher fields.
Acknowledgements
None.
Footnote
Conflicts of Interest: The study was performed at the Department of Radiation Oncology, Wake Forest University Health Sciences, Winston-Salem, NC, USA.
References
- De Poorter J, De Wagter C, De Deene Y, Thomsen C, Ståhlberg F, Achten E. Noninvasive MRI thermometry with the proton resonance frequency (PRF) method: in vivo results in human muscle. Magn Reson Med 1995;33:74-81. [Crossref] [PubMed]
- Bohris C, Schreiber WG, Jenne J, Simiantonakis I, Rastert R, Zabel HJ, Huber P, Bader R, Brix G. Quantitative MR temperature monitoring of high-intensity focused ultrasound therapy. Magn Reson Imaging 1999;17:603-10. [Crossref] [PubMed]
- Le Bihan D, Delannoy J, Levin RL. Temperature mapping with MR imaging of molecular diffusion: application to hyperthermia. Radiology 1989;171:853-7. [Crossref] [PubMed]
- Kuroda K, Suzuki Y, Ishihara Y, Okamoto K, Suzuki Y. Temperature mapping using water proton chemical shift obtained with 3D-MRSI: feasibility in vivo. Magn Reson Med 1996;35:20-9. [Crossref] [PubMed]
- Quesson B, de Zwart JA, Moonen CT. Magnetic resonance temperature imaging for guidance of thermotherapy. J Magn Reson Imaging 2000;12:525-33. [Crossref] [PubMed]
- Wlodarczyk W, Hentschel M, Wust P, Noeske R, Hosten N, Rinneberg H, Felix R. Comparison of four magnetic resonance methods for mapping small temperature changes. Phys Med Biol 1999;44:607-24. [Crossref] [PubMed]
- Peters RD, Hinks RS, Henkelman RM. Ex vivo tissue-type independence in proton-resonance frequency shift MR thermometry. Magn Reson Med 1998;40:454-9. [Crossref] [PubMed]
- Sherar MD, Moriarty JA, Kolios MC, Chen JC, Peters RD, Ang LC, Hinks RS, Henkelman RM, Bronskill MJ, Kucharcyk W. Comparison of thermal damage calculated using magnetic resonance thermometry, with magnetic resonance imaging post-treatment and histology, after interstitial microwave thermal therapy of rabbit brain. Phys Med Biol 2000;45:3563-76. [Crossref] [PubMed]
- Germain D, Chevallier P, Laurent A, Saint-Jalmes H. MR monitoring of tumour thermal therapy. MAGMA 2001;13:47-59. [Crossref] [PubMed]
- McDannold NJ, Jolesz FA. Magnetic resonance image-guided thermal ablations. Top Magn Reson Imaging 2000;11:191-202. [Crossref] [PubMed]
- de Senneville BD, Mougenot C, Moonen CT. Real-time adaptive methods for treatment of mobile organs by MRI-controlled high-intensity focused ultrasound. Magn Reson Med 2007;57:319-30. [Crossref] [PubMed]
- Yuan J, Mei CS, Panych LP, McDannold NJ, Madore B. Towards fast and accurate temperature mapping with proton resonance frequency-based MR thermometry. Quant Imaging Med Surg 2012;2:21-32. [PubMed]
- Denis de Senneville B, Quesson B, Moonen CT. Magnetic resonance temperature imaging. Int J Hyperthermia 2005;21:515-31. [Crossref] [PubMed]
- McDannold N, Tempany CM, Fennessy FM, So MJ, Rybicki FJ, Stewart EA, Jolesz FA, Hynynen K. Uterine leiomyomas: MR imaging-based thermometry and thermal dosimetry during focused ultrasound thermal ablation. Radiology 2006;240:263-72. [Crossref] [PubMed]
- Weidensteiner C, Quesson B, Caire-Gana B, Kerioui N, Rullier A, Trillaud H, Moonen CT. Real-time MR temperature mapping of rabbit liver in vivo during thermal ablation. Magn Reson Med 2003;50:322-30. [Crossref] [PubMed]
- Botnar RM, Steiner P, Dubno B, Erhart P, von Schulthess GK, Debatin JF. Temperature quantification using the proton frequency shift technique: In vitro and in vivo validation in an open 0.5 tesla interventional MR scanner during RF ablation. J Magn Reson Imaging 2001;13:437-44. [Crossref] [PubMed]
- Kuroda K, Kokuryo D, Kumamoto E, Suzuki K, Matsuoka Y, Keserci B. Optimization of self-reference thermometry using complex field estimation. Magn Reson Med 2006;56:835-43. [Crossref] [PubMed]
- Bertsch F, Mattner J, Stehling MK, Müller-Lisse U, Peller M, Loeffler R, Weber J, Messmer K, Wilmanns W, Issels R, Reiser M. Non-invasive temperature mapping using MRI: comparison of two methods based on chemical shift and T1-relaxation. Magn Reson Imaging 1998;16:393-404. [Crossref] [PubMed]
- Chen JC, Moriarty JA, Derbyshire JA, Peters RD, Trachtenberg J, Bell SD, Doyle J, Arrelano R, Wright GA, Henkelman RM, Hinks RS, Lok SY, Toi A, Kucharczyk W. Prostate cancer: MR imaging and thermometry during microwave thermal ablation-initial experience. Radiology 2000;214:290-7. [Crossref] [PubMed]
- Hey S, Cernicanu A, de Senneville BD, Roujol S, Ries M, Jaïs P, Moonen CT, Quesson B. Towards optimized MR thermometry of the human heart at 3T. NMR Biomed 2012;25:35-43. [Crossref] [PubMed]
- Burke A, Ding X, Singh R, Kraft RA, Levi-Polyachenko N, Rylander MN, Szot C, Buchanan C, Whitney J, Fisher J, Hatcher HC, D'Agostino R Jr, Kock ND, Ajayan PM, Carroll DL, Akman S, Torti FM, Torti SV. Long-term survival following a single treatment of kidney tumors with multiwalled carbon nanotubes and near-infrared radiation. Proc Natl Acad Sci U S A 2009;106:12897-902. [Crossref] [PubMed]
- Fite BZ, Liu Y, Kruse DE, Caskey CF, Walton JH, Lai CY, Mahakian LM, Larrat B, Dumont E, Ferrara KW. Magnetic resonance thermometry at 7T for real-time monitoring and correction of ultrasound induced mild hyperthermia. PLoS One 2012;7:e35509. [Crossref] [PubMed]
- Larrat B, Pernot M, Aubry JF, Dervishi E, Sinkus R, Seilhean D, Marie Y, Boch AL, Fink M, Tanter M. MR-guided transcranial brain HIFU in small animal models. Phys Med Biol 2010;55:365-88. [Crossref] [PubMed]
- Hoogenboom M, van Amerongen MJ, Eikelenboom DC, Wassink M, den Brok MH, Hulsbergen-van de Kaa C, Dumont E, Adema GJ, Heerschap A, Fütterer JJ. Development of a high-field MR-guided HIFU setup for thermal and mechanical ablation methods in small animals. J Ther Ultrasound 2015;3:14. [Crossref] [PubMed]
- Liu S, Zhou Y. MR temperature imaging using PRF phase difference and a geometric model-based fat suppression method. Technol Health Care 2015;23 Suppl 2:S587-92. [Crossref] [PubMed]
- Rieke V, Butts Pauly K. MR thermometry. J Magn Reson Imaging 2008;27:376-90. [Crossref] [PubMed]
- Olsrud J, Wirestam R, Brockstedt S, Nilsson AM, Tranberg KG, Ståhlberg F, Persson BR. MRI thermometry in phantoms by use of the proton resonance frequency shift method: application to interstitial laser thermotherapy. Phys Med Biol 1998;43:2597-613. [Crossref] [PubMed]
- Hindman JC. Proton resonance shift of water in the gas and liquid states. The Journal of Chemical Physics 1966;44:4582-92. [Crossref]
- Rieke V, Vigen KK, Sommer G, Daniel BL, Pauly JM, Butts K. Referenceless PRF shift thermometry. Magn Reson Med 2004;51:1223-31. [Crossref] [PubMed]
- Cernicanu A, Lepetit-Coiffe M, Roland J, Becker CD, Terraz S. Validation of fast MR thermometry at 1.5 T with gradient-echo echo planar imaging sequences: phantom and clinical feasibility studies. NMR Biomed 2008;21:849-58. [Crossref] [PubMed]

