
Black blood T1rho MR imaging may diagnose early stage liver fibrosis: a proof-of-principle study with rat biliary duct ligation model
Introduction
Liver fibrosis, a common feature of almost all chronic liver diseases, involves the accumulation of collagen, proteoglycans, and other macromolecules in the extracellular matrix (1). Clinically liver fibrosis usually has an insidious onset and progresses slowly over decades. To date, noninvasive diagnostic tests available from clinical practice are not sensitive or specific enough to detect occult liver injury at early stages (2). Liver biopsy is currently the standard of reference for the diagnosis and staging of liver fibrosis. However, it is an invasive procedure with possible complications (3). Histologic assessment of fibrosis is also an inherently subjective process, and subject to sampling variability (4). A noninvasive and quantitative technique for assessing liver fibrosis and monitoring disease progression or therapeutic intervention is highly desirable.
T1rho (T1ρ) relaxation time describes spin-lattice relaxation in the rotation frame at the presence of an external radiofrequency (RF) pulse in the transverse plane. T1ρ relaxation was first described in 1955 (5), but has only been applied in MRI in the late 1980’s, particularly in the musculoskeletal system (6). Despite the biophysical mechanism has not been fully illuminated, recently Wang et al. and Zhao et al. described the usefulness of T1ρ MR imaging for assessment in rat liver fibrosis models, with the increase of T1ρ value correlated severity of fibrosis. Studies in human subjects, both in healthy volunteers and liver fibrosis patients, soon followed (7-15). In a group of 25 healthy volunteers and 35 cirrhosis patients, Allkemper et al. (11) reported that T1ρ values did not correlate with necroinflammatory activity, degree of steatosis or presence of iron load, but it was significantly associated with the Child-Pugh staging of the patients. In patients with chronic liver diseases, Takayama et al. (14) demonstrated liver T1ρ values showed significant positive correlations with the serum levels of total bilirubin, direct bilirubin, and indocyanine green (ICG-R15), and significant negative correlations with the serum levels of albumin and γ-glutamyl transpeptidase.
Most of these previous reported methods were implemented with multiple breath-holds or respiratory gating, which is difficult to prevent small motion displacement between images acquired at different spin lock duration times (TSLs). These studies were also based on fast gradient echo acquisitions without suppression of blood signal, while blood vessels may contribute to elevating T1ρ measurement for normal parenchyma (11,13). The presence of bright blood signal also increases sensitivity of T1ρ quantification to motion. As discussed in literatures (13), even minor spatial misregistration between images acquired with different TSL can lead to artificially elevated T1ρ measurement for liver parenchyma. More recently Singh et al. (15) proposed a pulse sequence enabling acquisition of single slice 2D T1ρ MR imaging with four different TSLs in a single breath-hold of 12 second, and a small cohort study demonstrated the potential of detecting early stage liver fibrosis in patients. However, the longest TSL used in that study was 30 ms; therefore lower than the expected normal liver tissue T1ρ value.
The current study has two aims. The first was to validate a 2D black blood T1ρ MR relaxometry sequence for liver imaging, while inherent black blood effect of 2D fast spin echo (2DFSE) and double inversion recovery (DIR) were utilized to achieve blood signal suppression. Secondly, with rat biliary duct ligation (BDL) model we aim to investigate the earliest stage when liver fibrosis can be reliably differentiated from normal liver by black blood T1ρ MRI. Compared with other models, BDL model has the feature of high success rate and reproducible histologic change course of the liver, and therefore widely used in literatures, while the inflammatory reactions associated with this model is mild (16-18).
Methods
The protocols and procedures were approved by the Animal Experimentation Ethics Committee of local university. Thirty six male Sprague-Dawley rats with a weight of 200–250 g were used. The animals were housed on a 12-hour-light–12-hour-dark cycle in an air-conditioned room at 25 °C. Food and water were available ad libitum. Before the BDL experiment, scan-rescan repeatability was evaluated on five healthy rats with two consecutive examinations carried out without moving the position of the animals in RF coil and the magnet. In addition, eight healthy rats were examined twice with one week’s interval to test scan-rescan reproducibility.
For both MRI examinations and surgery, rats were anesthetized by using a combination of xylazine 10 mg per kilogram of body weight, and ketamine, 90 mg/kg. For BDL surgery procedures, using a sterile technique an upper abdominal incision was performed, the ventral side of the liver was lifted with a moistened (0.9% NaCl solution) cotton swab so that it could stick to the diaphragm and the hepatic hilum became clearly visible. The bile duct was exposed and separated carefully from the flanking portal vein and hepatic artery. Subsequently, a suture was placed around the bile duct and secured with a surgical knot. A second suture was placed in close proximity to the first suture and knotted around the bile duct. The suture was shortened and both abdominal layers were closed with separate running sutures.
MR imaging data acquisition was performed with a Philips Achieva TX 3.0 T scanner equipped with dual transmit (Philips Healthcare, Best, the Netherlands). After the animals being anesthetized, they were positioned supine, and an eight-channel human-wrist RF coil was used as the signal receiver; the body coil was used as the RF transmitter. An upper abdominal belt was used to minimize liver motion. Three axial sections were prescribed to cut through the liver for each examination. During the whole course of the study, eight rats died prior to the intended endpoints.
The pulse sequence scheme diagram used in this study is illustrated in Figure 1. A RF pulse cluster that can achieve simultaneous compensation of B1 RF and B0 field inhomogeneity was used for T1ρ preparation (19). The combination of DIR and 2DFSE was used to achieve black blood effect (20,21). The theory of designing pulse sequences to achieve black blood T1ρ MR relaxometry has been recently presented (22). The suppression of blood signal helps to mitigate quantification errors from vessels and motion displacement between data sets acquired at different TSL (11,13). In reference (22), imaging data sets were acquired with a single shot FSE sequence to achieve fast scan time within a single breathhold for human scan. In this work, a 2DFSE sequence is used to acquire imaging data under condition of free breathing in order to achieve high spatial resolution.

Imaging parameters were as follows: repetition time/echo time, 4,000 and 36 msec; flip angle, 90°; voxel size, 0.6×0.5×3.00 mm3; spin-lock frequency 500 Hz, echo train length 12, the spin-lock time 1, 10, 30, 50 ms (23). The inversion time for DIR was chosen so that the blood signal was zero at the beginning of T1ρ-prep. Spectral attenuated inversion recovery (SPAIR) was used for fat saturation and the fat signal was set to zero at the beginning of T1ρ-prep. The same fat saturation strategy has been reported in a number of literatures (24). Three axial slices were acquired per rat examination. The total data acquisition time was 2 minutes and 44 seconds.
All images were processed using Matlab R2015a (Mathworks, USA). T1ρ maps were computed by using a mono-exponential decay model, as described by the following equation: M (TSL) = A × exp(− TSL/T1ρ), where A is a constant scaling factor and TSL is the time of spin-lock. Non-linear least square fit with the Levenberg-Marquardt algorithm was applied.
With reference to T1ρ image at TSL at 1 ms and T1ρ map, region-of-interest (ROI) measurement of liver T1ρ value were performed. A radiologist experienced with pre-clinical studies performed the measurement. Four to sixe ROIs were placed on each axial section of the liver parenchymal region, avoiding potential artifacts as well as potential high value residual vessel signal. A total of approximately 15 ROIs were obtained each liver, and the mean value of these 15 ROIs was regarded as the value of the liver T1ρ. The inter- and intra- reader reproducibility for ROI placement has been shown to be excellent in past studies (7,8) [more details of the ROI placement are shown in supplement document of reference (7)].
For histopathologic examination, the animals were sacrificed on days 3 (n=6), 5 (n=11), 7 (n=5), and 10 (n=6) after surgery, respectively. Liver specimens were fixed in 4% phosphate-buffered formaldehyde and embedded in paraffin. Five micrometer-thick histologic cuts from the paraffin blocks were obtained and prepared with hematoxylin-eosin (HE) and picro-sirius staining. Slides were dewaxed in xylene and rehydrated in a series of ethanol. Histomorphometric analysis was performed with a computerized image analysis system comprised of a photomicroscope and digital camera (Nikon Ci-L microscope imaging system, Japan) and software (Image-Pro Plus 6.0, USA). The entire liver section on a slide was captured by consecutive fields with a magnification of ×100 and no overlapping. The mean of red-stained area (collagen) of all fields in each section was calculated. The percentage of fibrotic area per field was calculated for each liver section. Liver fibrosis was additionally graded by METAVIR grading by a physician with more than 10 years’ experience in animal pathology reading. Statistical analysis is described in the results section when the appropriate method was applied. The software package was SPSS v.18.0 (IBM Corp., Armonk, NY, USA), and P<0.05 was considered as statistically significant.
Results
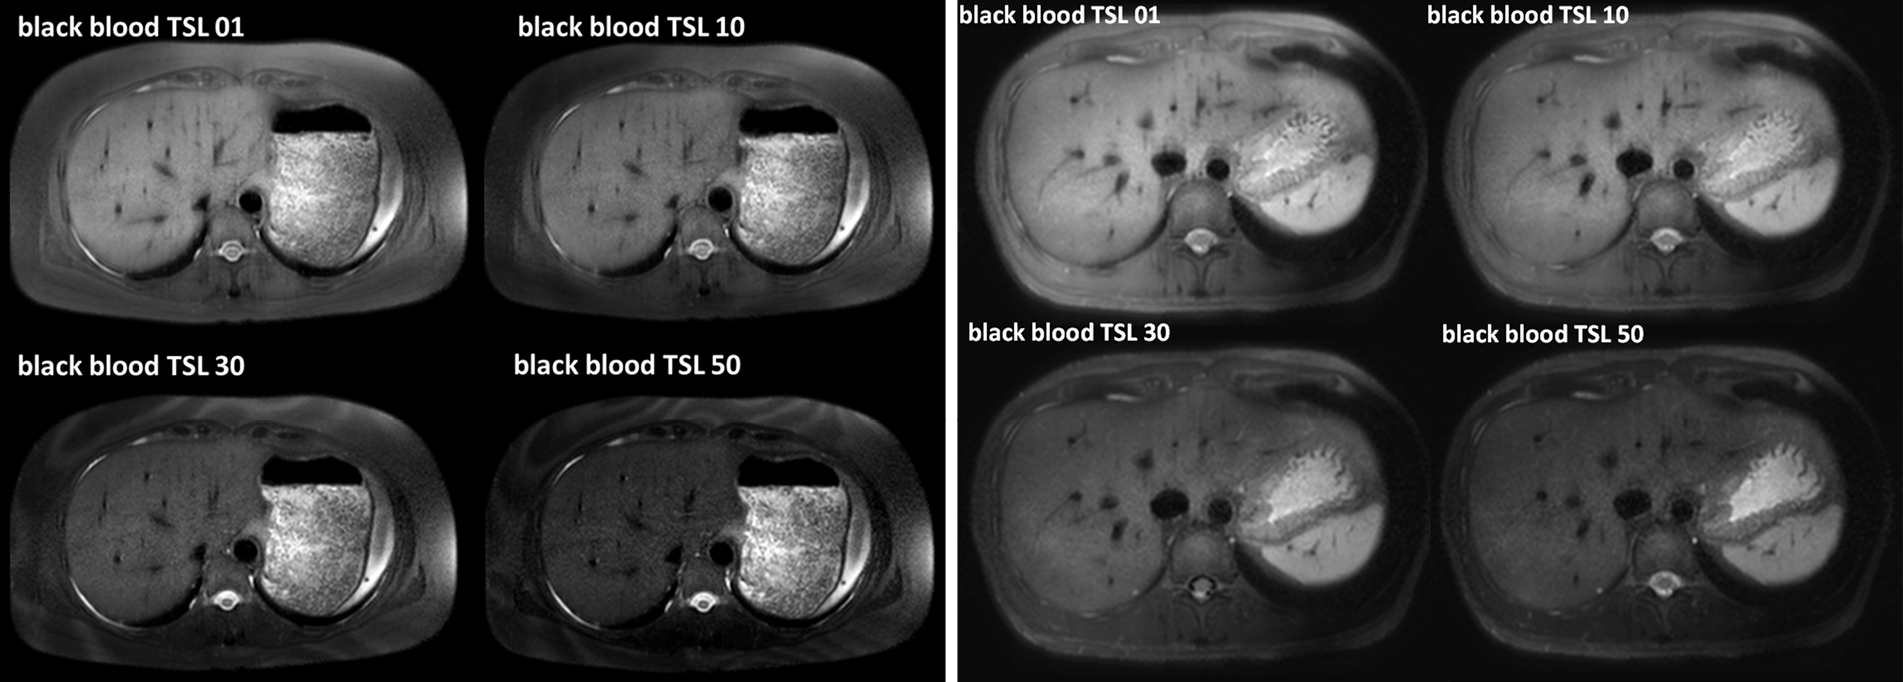
Typical T1ρ MR images of normal rat liver and rat day-10 after BDL surgery are shown in Figure 2. A comparison of black blood T1ρ MR imaging vs. previously obtained bright blood T1ρ MR Imaging is shown in Figure S1. Fat signal and large vessels were satisfactorily suppressed.


The liver scan-rescan measurement repeatability and reproducibility are shown in Tables 1,2, and Bland-Altman plots are shown in Figure 3. For scan-rescan repeatability, the mean difference was −0.8 ms and 95% limits of agreement was −2.33 to 0.67 ms. For scan-rescan reproducibility, the mean difference was 0.30 ms, and 95% limits of agreement was −4.32 to 4.91 ms. With 32 rat baseline scans, the coefficient of variation (CoV, standard deviation divided by mean) was 0.0399. Therefore this sequence demonstrated good measurement precision.

Full table

Full table

The time course of liver T1ρ measurement after BDL surgery is shown in Figure 4 and Table 3. The physiological liver T1ρ value before surgery was 38.38±1.53 msec (range, 36.05–41.53 msec). Liver T1ρ value elevated progressively after BDL surgery. In this study, at day-10 after BDL all experimental animals can be separated from normal liver based on T1ρ measurement, with the highest normal liver measurement being 41.53 msec and lowest day-10 BDL liver measurement being 42.82 msec. The statistical comparison with Mann Whitney U test result showed baseline T1ρ vs. day-3 T1ρ P=0.023, day-3 T1ρ vs. day-5 P=0.013, and day-5 T1ρ vs. day-7 P=0.043. Preliminary analysis using the area under a receiver operating characteristic (ROC) curve indicated likelihood of a high sensitivity and high specificity for T1ρ diagnosing liver fibrosis (see Supplementary Material) (25).


Full table
The sirius red stained histology is shown in Figure 5, and histomorphometry analysis result of Sirius red stained fibrous area in the liver is shown in Figure 6. BDL day-5 & 7 and day-10 rats demonstrated early stage liver fibrosis resembling METAVIR stage-F1 and stage-F2 respectively, with fibrous septa between portal areas partially developed for day-10 rats.


Discussion
BDL is a well established model for liver fibrosis research. Together with CCl4 chronic administration, it is one of the most commonly used animal models for liver fibrosis induction. The pathophysiology and time course of BDL has been extensively reported (17,18,26-28). Increased intraluminal pressure is a mechanism of initiating entry of biliary epithelial cells into the replicative cycle (28). Stellate cells are activated and transformed into myofibroblasts and thus fibrogenesis developed (29). An increase in the total number of biliary duct per portal field can be noticeable at 2 days. 48 hours after obstruction the number of neutrophils and macrophages doubles and remains constant thereafter. After 5 days obstruction there was bile duct proliferation, fibrosis was slight and limited to the regions of new bile duct formation. Portal tracts were not linked and the basic lobular architectural pattern remained intact. Mild inflammatory and edema reaction in portal areas can also be noted (30). With liver from day-7 BDL rat, the average cross-sectional area occupied by a biliary duct increases approximately threefold. After 10 days of bile duct obstruction, portal areas became expanded by fibrosis and bile duct proliferation, and linked to form a fibrous network (equals METAVIR stage-F2). Some ductular proliferation extended beyond the limits of the portal tracts to invade the liver parenchyma. Biliary obstruction for 15 days or more led to the development of cirrhosis. Biliary obstruction fibrous connective-tissue septa bridged portal areas and frequently extended into the lobules, and the normal lobular pattern starts to become disorganized (17). However, even at day-16 after BDL, infiltrate of inflammatory cells in portal spaces is mild (27). Our histology results agreed with these literatures.
The sequence in this study was programmed such that data sets with different TSL can be acquired within one single scan, which reduces its susceptibility to motion displacement occurred at different TSL (11,13). FSE acquisition in combination with DIR allows blood suppression (20-22). T1ρ-preparation is susceptible to the off-resonance effect, and therefore it is desirable to suppress fat signal. SPAIR was used in the pulse sequence which applies a 180 degree adiabatic inversion pulse tune to the fat resonance. The time delay of SPAIR was chosen such that fat signal is zero at the beginning of T1ρ-preparation (24). To improve the robustness of fat suppression under non-ideal imaging environment, gradient reversal technology can be employed in addition to SPAIR for fat suppression, where the polarity of the slice selective gradient of the refocusing RF pulses is reversed compared to that of the excitation RF pulse, and therefore fat is not refocused during FSE train (31). By using single shot fast spin echo (SSFSE), the pulse sequence in this study can be used to acquire 4 TSL in 10 seconds which will allow single-breath hold technique in human subjects (22).
In this study fat signal and large vessels were suppressed, though some small residual vessels could still be observed. The physiological T1ρ value of rat liver parenchyma was measured to be 38.38±1.53 ms, which was lower than the value obtained in reference (32) (45.21±2.15 ms) where no black-blood technique was applied. The CoV also compared with favorably the results in reference (32) (0.0399 vs. 0.0452). It is expected that lower physiological T1ρ value measurement and small CoV will increase the diagnostic confidence for liver fibrosis evaluation. This study also confirmed good scan-rescan repeatability and reproducibility of the sequence. While a number of papers have been published on T1ρ imaging of liver cirrhosis, currently it remains inconclusive how reliable T1ρ imaging can be used to detect early stage liver fibrosis. Importantly, this study showed the high sensitivity of T1ρ measurement allowed early stage liver fibrosis detection and progression monitoring. T1ρ measurement progressed from day-3 to day-5, and to day-7; however, with histomorphometry method used in this study, the fibrosis progression from day-3 to day-7 was minimal (Figure 6). Histomorphometry is usually considered as the reference standard; however, it suffers from sampling bias. This study showed the liver global assessment with T1ρ MRI may be potentially even more reliable and sensitive for fibrosis than histomorphometry method. This study showed T1ρ MRI can differentiate BDL day-10 animals, when liver fibrosis (METAVIR stage-2) started to develop, from normal liver (33,34). Both animal experiments and clinical studies have revealed that liver fibrosis, even early cirrhosis, is reversible, treatment with combined therapies on underline etiology and fibrosis simultaneously might expedite the regression of liver fibrosis and promote liver regeneration (35-37). Earlier stage liver fibrosis is more amenable to therapeutic intervention. Even when the underline etiology of liver fibrosis could not be eradicated, therapies on liver fibrosis might help restrict the disease progression to cirrhosis (37). Therefore early detection of liver fibrosis and treatment monitoring is of paramount importance.
There are a few limitation of this study. The first is that our technique did not completely suppression micro-vessel blood signal in rat liver. Additional respiration gating was not used in the study, however, as previous studies on rat liver T1ρ imaging (32) and rat liver CEST (38) showed this was not an important obstacle as in rats liver is tightly attached to the posterior wall of the abdominal cavity [for example, image 5 of reference (32), where free breathing is allowed while high quality T1ρ mapping was obtained]. It is highly possible that if respiration gating is applied and further technique improvement is used to fully suppress blood signal in liver, blood signal suppression can be more successful, then the normal liver T1ρ value range will be narrower, and the diagnosis of early liver fibrotic changes can be made with even more confidence. In fact, preliminary data showed this technique performs better in human subjects (22) (Figure S4), probably partially due to the breathhold approach (10 sec). Another limitation is that animal number at day-10 in this study is still small, further studies will more animals are desirable. However, the initial efforts of this study were more focused on earlier time points (i.e., day-5 and day-7). In addition, the MRI protocol in this study should be considered as working-in-progress, and it confirms the principle that early stage liver fibrosis could be diagnosed by T1ρ MR imaging. In this study T2 relaxation’s contamination to T1ρ elevation was not investigated, as it is known that rat BDL model is only associated with only mild inflammation in portal spaces (17,18,26-28). In addition, previous study on CCl4 induced liver fibrosis model development demonstrated T2 and T1ρ follow different time courses; therefore T2 lengthening will not considerably contribute to T1ρ lengthening in this study (39). Another limitation is that only one liver fibrosis model is used in this study. Diffused liver parenchyma lesions with different causal factors should be further investigated. Additionally, to further improve this black blood T1ρ relaxometry sequence, additional techniques can be incorporated, including more robust measurement (22,40-43) and faster data sampling and reconstruction (44). Recently, the feasibility of CEST (chemical exchange saturation transfer) technique for liver imaging has been demonstrated (38,45). MR Elastography technique has also been further validated for assessing diffused liver diseases (46,47). Along with technical improvements, integrated liver multi-parametric imaging will likely improve the sensitivity and specificity for early stage liver fibrosis characterization (48-52), or a combination of MR readout and serum fibrosis markers and the use of decision trees, such as Bayesian prediction, will allow high validity for a diagnostic approach (53,54).
In conclusion, this study validated the feasibility of black blood T1ρ imaging in a rat fibrosis experimental model. The black blood effect together with a multiple spin lock times in a single acquisition have the potential to mitigate potential quantification errors in liver due to motion in previous methods, and therefore improves the robustness of T1ρ imaging of liver. This study provides the proof-of-principle that T1ρ may be able to diagnose early stage liver fibrosis. Further technology progresses and development of user-friendly platform of T1ρ imaging will likely impact on early diagnosis of liver diseases in clinical practice.
Acknowledgements
The authors thank Dr. Min Deng for data acquisition.
Funding: This study was partially supported by grants from the Research Grants Council of the Hong Kong SAR (Project No. 476313 and Project No. SEG CUHK02).
Footnote
Conflicts of Interest: The authors have no conflicts of interest to declare.
Ethical Statement: The study was approved by the Animal Experimentation Ethics Committee of local university.
Supplementary
Area under a receiver operating characteristic (ROC) curve results:
- Baseline rats vs. day-10 rats: cut-point T1ρ value =42.173 msec, sensitivity =100% and specificity =100% (AUC =1);
- Baseline rats vs. day-7 & day-10 rats: cut-point T1ρ value =40.968 msec, sensitivity =92.9% and specificity =96.9% (AUC =0.987);
- Baseline rats vs. BDL rats at all post-surgery time points: cut-point T1ρ value =39.95 msec, sensitivity =73.7% and specificity =84.4% (AUC =0.868).
However, more data points should be desirable for accurate analysis of the diagnostic performance.
References
- Wallace K, Burt AD, Wright MC. Liver fibrosis. Biochem J 2008;411:1-18. [Crossref] [PubMed]
- Janes CH, Lindor KD. Outcome of patients hospitalized for complications after outpatient liver biopsy. Ann Intern Med 1993;118:96-8. [Crossref] [PubMed]
- Patel K, Shackel NA. Current status of fibrosis markers. Curr Opin Gastroenterol 2014;30:253-9. [Crossref] [PubMed]
- Bravo AA, Sheth SG, Chopra S. Liver biopsy. N Engl J Med 2001;344:495-500. [Crossref] [PubMed]
- Redfield AG. Nuclear magnetic resonance saturation and rotary saturation in solids. Phys Rev 1955;98:1787. [Crossref]
- Wáng YX, Zhang Q, Li X, Chen W, Ahuja A, Yuan J. T1ρ magnetic resonance: basic physics principles and applications in knee and intervertebral disc imaging. Quant Imaging Med Surg 2015;5:858-85. [PubMed]
- Deng M, Zhao F, Yuan J, Ahuja AT, Wang YX. Liver T1ρ MRI measurement in healthy human subjects at 3 T: a preliminary study with a two-dimensional fast-field echo sequence. Br J Radiol 2012;85:e590-5. [Crossref] [PubMed]
- Zhao F, Deng M, Yuan J, Teng GJ, Ahuja AT, Wang YX. Experimental evaluation of accelerated T1rho relaxation quantification in human liver using limited spin-lock times. Korean J Radiol 2012;13:736-42. [Crossref] [PubMed]
- Zhao F, Yuan J, Deng M, Lu PX, Ahuja AT, Wang YX. Further exploration of MRI techniques for liver T1rho quantification. Quant Imaging Med Surg 2013;3:308-15. [PubMed]
- Wang YX, Zhao F, Wong VW, Yuan J, Kwong KM, Chan LY. Liver MR T1rho measurement in liver cirrhosis patients: a preliminary study with a 2D fast field echo sequence at 3T. Paper presented in the 20th Annual Meeting & Exhibition of ISMRM, 2012:1289.
- Allkemper T, Sagmeister F, Cicinnati V, Beckebaum S, Kooijman H, Kanthak C, Stehling C, Heindel W. Evaluation of fibrotic liver disease with whole-liver T1ρ MR imaging: a feasibility study at 1.5 T. Radiology 2014;271:408-15. [Crossref] [PubMed]
- Rauscher I, Eiber M, Ganter C, Martirosian P, Safi W, Umgelter A, Rummeny EJ, Holzapfel K. Evaluation of T1ρ as a potential MR biomarker for liver cirrhosis: comparison of healthy control subjects and patients with liver cirrhosis. Eur J Radiol 2014;83:900-4. [Crossref] [PubMed]
- Wang YX, Yuan J. Evaluation of liver fibrosis with T1ρ MR imaging. Quant Imaging Med Surg 2014;4:152-5. [PubMed]
- Takayama Y, Nishie A, Asayama Y, Ushijima Y, Okamoto D, Fujita N, Morita K, Shirabe K, Kotoh K, Kubo Y, Okuaki T, Honda H. T1 ρ Relaxation of the liver: A potential biomarker of liver function. J Magn Reson Imaging 2015;42:188-95. [Crossref] [PubMed]
- Singh A, Reddy D, Haris M, Cai K, Rajender Reddy K, Hariharan H, Reddy R. T1ρ MRI of healthy and fibrotic human livers at 1.5 T. J Transl Med 2015;13:292. [Crossref] [PubMed]
- Rodríguez-Garay EA. Cholestasis: human disease and experimental animal models. Ann Hepatol 2003;2:150-8. [PubMed]
- Kountouras J, Billing BH, Scheuer PJ. Prolonged bile duct obstruction: a new experimental model for cirrhosis in the rat. Br J Exp Pathol 1984;65:305-11. [PubMed]
- Ni Y, Lukito G, Marchal G, Cresens E, Yu J, Petré C, Baert AL, Fevery J. Potential role of bile duct collaterals in the recovery of the biliary obstruction: experimental study in rats using microcholangiography, histology, serology and magnetic resonance imaging. Hepatology 1994;20:1557-66. [Crossref] [PubMed]
- Witschey WRT, Borthakur A, Elliott MA, Mellon E, Niyogi S, Wallman DJ, Wang C, Reddy R. Artifacts in T1p-weighted imaging: Compensation for B1 and B0 field imperfections. J Magn Reson 2007;186:75-85. [Crossref] [PubMed]
- Edelman RR, Chien D, Kim D. Fast selective black blood MR imaging. Radiology 1991;181:655-60. [Crossref] [PubMed]
- Kuribayashi H, Tessier JJ, Checkley DR, Wang YX, Hultin L, Waterton JC. Effective blood signal suppression using double inversion-recovery and slice reordering for multislice fast spin-echo MRI and its application in simultaneous proton density and T2 weighted imaging. J Magn Reson Imaging 2004;20:881-8. [Crossref] [PubMed]
- Chen W, Chan Q, Wáng YX. Breathhold black blood quantitative t1rho imaging of liver using single shot fast spin echo acquisition. Quant Imaging Med Surg 2016;6:168-77. [Crossref] [PubMed]
- Yuan J, Zhao F, Griffith JF, Chan Q, Wang YX. Optimized efficient liver T(1ρ) mapping using limited spin lock times. Phys Med Biol 2012;57:1631-40. [Crossref] [PubMed]
- Li X, Han ET, Busse RF, Majumdar S. In vivo T(1rho) mapping in cartilage using 3D magnetization-prepared angle-modulated partitioned k-space spoiled gradient echo snapshots (3D MAPSS). Magn Reson Med 2008;59:298-307. [Crossref] [PubMed]
- Hanley JA, McNeil BJ. The meaning and use of the area under a receiver operating characteristic (ROC) curve. Radiology 1982;143:29-36. [Crossref] [PubMed]
- Symeonidis A, Trams EG. Morphologic and functional changes in the livers of rats after ligation or excision of the common bile duct. Am J Path 1957;33:13-27. [PubMed]
- Aller MA, Lorente L, Alonso S, Arias J. A model of cholestasis in the rat, using a microsurgical technique. Scand J Gastroenterol 1993;28:10-4. [Crossref] [PubMed]
- Slott PA, Liu M, Tavoloni N. Origin, pattern and mechanism of bile duct proliferation following biliary obstruction in the rat. Gastroenterology 1990;99:466-77. [Crossref] [PubMed]
- Armendariz-Borunda J, Simkevich CP, Roy N, Raghow R, Kang AH, Seyer JM. Activation of Ito cells involves regulation of AP-1 binding proteins and induction of type I collagen gene expression. Biochem J 1994;304:817-24. [Crossref] [PubMed]
- Johnstone JM, Lee EG. A quantitative assessment of the structural changes the rat's liver following obstruction of the common bile duct. Br J Exp Pathol 1976;57:85-94. [PubMed]
- Park HW, Kim DJ, Cho ZH. Gradient reversal technique and its applications to chemical-shift-related NMR imaging. Magn Reson Med 1987;4:526-36. [Crossref] [PubMed]
- Wang YX, Yuan J, Chu ES, Go MY, Huang H, Ahuja AT, Sung JJ, Yu J. T1rho MR imaging is sensitive to evaluate liver fibrosis: an experimental study in a rat biliary duct ligation model. Radiology 2011;259:712-9. [Crossref] [PubMed]
- Bedossa P, Poynard T. The French METAVIR Cooperative Study Group. An algorithm for grading activity in chronic hepatitis C. Hepatology 1996;24:289-93. [Crossref] [PubMed]
- Goodman ZD. Grading and staging systems for inflammation and fibrosis in chronic liver diseases. J Hepatol. 2007;47:598-607. [Crossref] [PubMed]
- Friedman SL. Hepatic fibrosis: overview. Toxicology 2008;254:120-9. [Crossref] [PubMed]
- Gentile I, Scotto R, Zappulo E, Buonomo AR, Pinchera B, Borgia G. Investigational direct-acting antivirals in hepatitis C treatment: the latest drugs in clinical development. Expert Opin Investig Drugs 2016;25:557-72. [Crossref] [PubMed]
- Wang P, Koyama Y, Liu X, Xu J, Ma HY, Liang S, Kim IH, Brenner DA, Kisseleva T. Promising Therapy Candidates for Liver Fibrosis. Front Physiol 2016;7:47. [Crossref] [PubMed]
- Chen SZ, Yuan J, Deng M, Wei J, Zhou J, Wáng YX. Chemical exchange saturation transfer (CEST) MR technique for in-vivo liver imaging at 3.0 tesla. Eur Radiol 2016;26:1792-800. [Crossref] [PubMed]
- Zhao F, Wang YX, Yuan J, Deng M, Wong HL, Chu ES, Go MY, Teng GJ, Ahuja AT, Yu J. MR. T1ρ as an imaging biomarker for monitoring liver injury progression and regression: an experimental study in rats with carbon tetrachloride intoxication. Eur Radiol 2012;22:1709-16. [Crossref] [PubMed]
- Chen W. Errors in quantitative T1rho imaging and the correction methods. Quant Imaging Med Surg 2015;5:583-91. [PubMed]
- Yuan J, Li Y, Zhao F, Chan Q, Ahuja AT, Wang YX. Quantification of T(1ρ) relaxation by using rotary echo spin-lock pulses in the presence of B(0) inhomogeneity. Phys Med Biol 2012;57:5003-16. [Crossref] [PubMed]
- Li Y, Zhao F, Wang YX, Ahuja AT, Yuan J. Study of magnetization evolution by using composite spin-lock pulses for T1ρ imaging. Conf Proc IEEE Eng Med Biol Soc 2012;2012:408-11.
- Wu X, Schmitter S, Auerbach EJ, Uğurbil K, Van de Moortele PF. Mitigating transmit B1 inhomogeneity in the liver at 7T using multi-spoke parallel transmit RF pulse design. Quant Imaging Med Surg 2014;4:4-10. [PubMed]
- Zhu Y, Zhang Q, Liu Q, Wang YX, Liu X, Zheng H, Liang D, Yuan J. PANDA-T1ρ: Integrating principal component analysis and dictionary learning for fast T1ρ mapping. Magn Reson Med 2015;73:263-72. [Crossref] [PubMed]
- Deng M, Chen SZ, Yuan J, Chan Q, Zhou J, Wáng YX. Chemical Exchange Saturation Transfer (CEST) MR Technique for Liver Imaging at 3.0 Tesla: an Evaluation of Different Offset Number and an After-Meal and Over-Night-Fast Comparison. Mol Imaging Biol 2016;18:274-82. [Crossref] [PubMed]
- Loomba R, Cui J, Wolfson T, Haufe W, Hooker J, Szeverenyi N, Ang B, Bhatt A, Wang K, Aryafar H, Behling C, Valasek MA, Lin GY, Gamst A, Brenner DA, Yin M, Glaser KJ, Ehman RL, Sirlin CB. Novel 3D Magnetic Resonance Elastography for the Noninvasive Diagnosis of Advanced Fibrosis in NAFLD: A Prospective Study. Am J Gastroenterol 2016;111:986-94. [Crossref] [PubMed]
- Taouli B, Serfaty L. Magnetic Resonance Imaging/Elastography Is Superior to Transient Elastography for Detection of Liver Fibrosis and Fat in Nonalcoholic Fatty Liver Disease. Gastroenterology 2016;150:553-6. [Crossref] [PubMed]
- Xiao G, Sun PZ, Wu R. Fast simulation and optimization of pulse-train chemical exchange saturation transfer (CEST) imaging. Phys Med Biol 2015;60:4719-30. [Crossref] [PubMed]
- Yuan J, Zhou J, Ahuja AT, Wang YX. MR chemical exchange imaging with spin-lock technique (CESL): a theoretical analysis of the Z-spectrum using a two-pool R(1ρ) relaxation model beyond the fast-exchange limit. Phys Med Biol 2012;57:8185-200. [Crossref] [PubMed]
- Ligabue G, Besutti G, Scaglioni R, Stentarelli C, Guaraldi G. MR quantitative biomarkers of non-alcoholic fatty liver disease: technical evolutions and future trends. Quant Imaging Med Surg 2013;3:192-5. [PubMed]
- Sy S, Huang S, Wang YX, Yu J, Ahuja AT, Zhang YT, Pickwell-MacPherson E. Terahertz spectroscopy of liver cirrhosis: investigating the origin of contrast. Phys Med Biol 2010;55:7587-96. [Crossref] [PubMed]
- Mannelli L, Nougaret S, Vargas HA, Do RK. Advances in diffusion-weighted imaging. Radiol Clin North Am 2015;53:569-81. [Crossref] [PubMed]
- Castera L. Assessing liver fibrosis. Expert Rev Gastroenterol Hepatol 2008;2:541-52. [Crossref] [PubMed]
- Motosugi U, Ichikawa T, Araki T, Matsuda M, Fujii H, Enomoto N. Bayesian prediction for liver fibrosis staging: combined use of elastography and serum fibrosis markers. Hepatology 2013;58:450-1. [Crossref] [PubMed]

