
Statistical assessment of bi-exponential diffusion weighted imaging signal characteristics induced by intravoxel incoherent motion in malignant breast tumors
Introduction
Angiogenesis plays a vital role in tumor growth, and is an independent prognostic factor in breast cancer (1-5). New anti-angiogenetic therapy concepts for breast cancer treatment have being introduced (6,7). Dynamic-contrast enhanced (DCE) magnetic resonance imaging (MRI) is a valuable clinical tool to investigate angiogenesis of breast cancer in vivo (8-11). However, DCE-MRI requires contrast agent administration (12) and is associated with long-term risk of renal failure (13). As such, non-invasive assessment of breast cancer angiogenesis is desirable.
Intravoxel incoherent motion (IVIM) MRI (12) offers such a non-invasive means for simultaneous assessment of tumor diffusivity and vascularity in breast cancer (14,15). According to IVIM principle, diffusion weighted imaging (DWI) signal is not only influenced by true water diffusion in tissue due to the thermal Brownian motion, but also affected by micro-circulation of blood in the randomly structured capillary network, named pseudo-diffusion effect. As such, a bi-exponential mathematical model is proposed to quantify IVIM effect beyond the mono-exponential diffusion model, which only quantifies Brownian diffusion using apparent diffusion coefficient (ADC). By applying appropriate b-factor sets including both low and high b values, DWI signal is sensitive to both true water diffusion and pseudo-diffusion. IVIM parameters of pseudo-diffusion coefficient (D*), true diffusion coefficient (D) and pseudo-diffusion fraction (f) can be determined by fitting DWI signal decay with b-factors to a bi-exponential function. In a number of studies, it has been observed that diffusion signal decay in breast tumors is better fitted by bi-exponential function with smaller residual errors (14-16).
IVIM-MRI is postulated to provide additional tumor vascularity information potentially for better tumor characterization (17), while this postulation could be hindered by some limitations of IVIM quantification. First, simply applying a more complex model with more parameters (bi-exponential model here) for least-square fitting would always yield smaller residual errors. As such, the commonly used goodness-of-fit measured by coefficient of determination (R2) to evaluate fitting quality would introduce bias and thus always prefer the bi-exponential model (18). The higher R2 value does not necessarily mean that bi-exponential model better describes the observed data but rather reflects the flexibility of the more complex model to match the observed data (19). Furthermore, fitting with a more complex model may sometimes overly capture the observed data variation contaminated by noise and motion, hence leads to the problem of overfitting (18). Although the use of adjusted R2 could partially penalize the statistic when extra variables are added to the model, it is still inadequate to determine whether the complex model significantly better fit the observed data (19). In addition, accurate and precise bi-exponential quantification is mathematically difficult, particularly for f and D* in situations of low signal-to-noise ratio (SNR) and limited data points (20,21). As such, the obtained IVIM parameter values may associate with bias, inaccuracy, high uncertainty and poor reproducibility (22-24). Although advanced estimation methods other than least-square fitting have also been proposed, such as Bayesian analysis (25), bootstrapping (26,27) and maximum likelihood estimation (28), their use in clinical practice is still sparse and yet to be further evaluated. Last, although mono-exponential function is nested within bi-exponential function, the fitting to bi-exponential function does not always yield the fitting result of f=0, which makes bi-exponential model equivalent to mono-exponential one, even in the absence of IVIM effect (29,30), as the fitting procedure is subject to local minima, much dependent on the fitting method (31).
In consequence, the use of bi-exponential fitting to study IVIM effect should be carefully examined in a statistical point of view. In this study, we focus on malignant breast tumors in which higher micro-vascularity and hence pronounced IVIM effect could be presumed. We prompt to statistically assess whether bi-exponential function better fits the DWI signal decay of malignant breast tumors obtained with typical acquisition protocol for clinical scans through two statistical approaches, F-test (32) and Akaike information criterion (AIC) (33). We also prompt to examine whether the DWI model preference could be influenced by analysis means, i.e., region-of-interests (ROI)-averaged signal fitting or voxel-wise signal fitting.
Methods
Patient information and MRI protocol
This retrospective study was approved by the local Institutional Review Board with a waiver of informed consent. Consecutive patients were considered in this study if they underwent 3 T bilateral breast MRI and had DWI scan performed with eight b values appropriate for IVIM quantification. A cohort of 29 tumors in 29 patients was generated, including 22 invasive ductal carcinoma (IDC), 3 invasive lobular carcinoma (ILC), and 4 pure ductal carcinoma in situ (DCIS).
MRI protocol
All patients received MRI scan in a prone position on a 3.0 T clinical scanner (Magnetom Trio; Siemens Healthcare, Erlangen, Germany) with a dedicated 4-channel breast array coil. DWI was performed in axial views that covered the entire bilateral breasts prior to the contrast agent administration using a fat-saturated single-shot spin-echo type echo-planar imaging sequence. Major imaging parameters included: FOV =350 mm, matrix size = 192×192, voxel size =1.82×1.82 mm2, slices =40, slice thickness/gap =3/0 mm, TE/TR=102/5,800 ms, number of signal averages (NSA) =4, SENSE factor =2. DW images at eight b-factors of 0, 50, 100, 150, 200, 400, 600, 1,000 s/mm2 were acquired. The DWI scan time was about 3 minutes.
Image analysis and statistical analysis
Curve fittings of DW signal decay with regard to b-factor, based on Gaussian diffusion model and IVIM model, were conducted using in-house developed Matlab programs (The MathWorks, Inc., Natick, MA, USA).
Gaussian diffusion model was given in a mono-exponential function as shown in Eq. [1]:

where S(b) and S0 are the DW image intensities obtained with the b-factor value of b and zero, respectively. ADC is the apparent diffusion coefficient.
IVIM model was given in a bi-exponential decay function as shown in Eq. [2]:
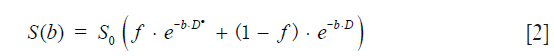
where D* and D respectively denote the pseudo-diffusion coefficient and the true water diffusion coefficient, and f is the unitless perfusion fraction. S(b) and S0 have the same meaning as in Eq. [1].
DWI images were first rigidly registered on console to the baseline image with b=0 s/mm2. The registration performance was visually inspected to make sure there was no apparent observable displacement of the lesion. ROIs of tumors were drawn manually on the slice of high-b DW images in which the tumor had the largest cross sectional area by referring to the DCE-MRI images. Two types of analyses were utilized. The first type, termed ROI-averaged analysis, calculated the average of DW image intensity for all voxels within the ROI and then this ROI-averaged intensity decay with regard to b-factor was fitted to mono- and bi-exponential function respectively to calculate ADC and IVIM parameters. For the other type, termed voxel-wise analysis, DW image intensity decay of each voxel within the ROI was fitted to mono- and bi-exponential function to obtain the voxel-wise value of ADC and IVIM parameters.
For both mono- and bi-exponential fitting, DW image intensities were first normalized to S0 and then logarithmized. The logarithmized DW signal decay with regard to all eight b-factors was least-square fitted to a linear function, and the slope of the best fitted linear curve was the estimated ADC. Bi-exponential fitting was conducted using the segmented fitting method, which was reported as an improved fitting method for IVIM quantification in particular at sufficiently high SNR (20,34-36). In detail, D was obtained similarly as ADC in mono-exponential through least-square linear fitting but only using the logarithmized DW signal at the b values of 200 s/mm2 and above. The fitted linear curve was then extrapolated to obtain an intercept at b=0. The ratio between this intercept and the DW signal at b=0 gave an estimate of f. Finally, the obtained D and f were substituted into the logarithmized Eq. [2] and non-linear least-square fitted against all b-factors to estimate D*. The start point for D* fitting was set as 10×10−3 mm2/s. By taking account of the reasonable physiological values, the lower limits of 0.0.01×10−3 and 1×10⁻³ mm2/s, and the upper limits of 1.5×10⁻³ and 500×10−3 mm2/s, were set for f, D and D* fitting respectively. D was constrained to be smaller than D*.
To statistically assess which model better fit the DW signal of breast tumors, two approaches, i.e., F-test (32) and AIC (19,33), were utilized and implemented in customized Matlab programs. F-test and AIC select model based on different but independent criteria. F-test is a null-hypothesis test applicable for nested models, but has the limitation to tend to choose the simpler model (34). In comparison, AIC is not a statistical hypothesis test so has no null hypothesis and P value. Instead, AIC provides a relative estimate of the information lost when a given model is used to describe the observed data, and is applicable to both nested and non-nested models. F-test and AIC were used in this study to complement each other and strengthen the confidence of the model preference results.
The null hypothesis of F-test is that the simpler model with fewer parameters, mono-exponential model here, is preferable. An F-ratio (F) was calculated to test whether the sum of squared deviations was sufficiently reduced to justify fitting with additional parameters by using the more complex bi-exponential model according to Eq. [3]:
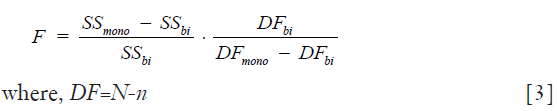
In Eq. [3], the subscripts mono and bi represent the mono-exponential and bi-exponential models, respectively. SS is the residual sum-of-squares. DF is degrees of freedom, which can be calculated by the subtraction of the number of model parameters n (n=3 for bi-exponential and n=1 for mono-exponential model) from the number of measured data points N. The P value associated with the F-ratio was then calculated based on F-distribution. If the P value associated with F-ratio was smaller than a significance level of 0.05, bi-exponential model was preferable. Otherwise, mono-exponential model was preferable in a statistical point of view.
AIC is not a statistical hypothesis test so has no null hypothesis and P value. Instead, it provides a relative estimate of the information lost when a given model is used to represent the observed data. We calculated the finite sample size corrected AIC values (AICc) first using Eq. [4]:
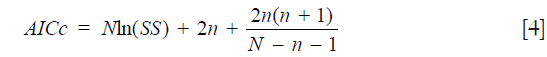
where all parameters have the same meaning as in Eq. [3]. The preferred model is the one with the smaller AICc value. Based on the calculated AICc values for two models, relative likelihood of bi-exponential model (RLbi) was calculated as Eq. [5]:

In general, if RLbi value was larger than 1, bi-exponential model was preferable, and the larger RLbi value implies that the mono-exponential model is more probable to result in a loss of information relative to the bi-exponential model. Conversely, mono-exponential was preferable if RLbi value was smaller than 1, and the preference was more strengthened with the smaller RLbi value.
For voxel-wise analysis using both F-test and AIC, if there were more voxels preferred bi-exponential model than mono-exponential one in a tumor ROI, this tumor was considered bi-exponential preferable. Otherwise, it was considered mono-exponential preferable.
The calculated ADC values were compared to D values (reported in mean ± SD) for all tumors, mono-exponential preferable tumors and bi-exponential preferable tumors for both ROI averaged analysis and voxel-wise analysis using Wilcoxon-signed rank test. For ROI-averaged analysis, the mean ADC, D and f values of the mono-exponential preferable tumors were compared to their corresponding counterparts of the bi-exponential preferable tumors using Mann-Whitney U-test. A significant level of 0.05 was used for all comparisons. Considering the unreliability of D* quantification in bi-exponential fitting (26), particularly when SNR was limited, comparison of D*, was still conducted but without further interpretation between mono-exponential and bi-exponential preferable tumor groups.
Results
No observable displacement was observed in lesions after registration. All lesions were still well visible even at the highest b value of 1,000 s/mm2, without dropping to the background image intensity level. Excellent R2 value was achieved in all tumors by fitting the ROI-averaged DWI signal to both mono-exponential (all R2>0.91) and bi-exponential models (all R2>0.97). Regarding the ROI-averaged analysis using F-test, 15 tumors were significantly better described by bi-exponential model, including 12 IDCs, 1 DCIS and 2 ILCs. In other 14 tumors, bi-exponential model was not significantly better than mono-exponential model, including 10 IDCs, 3 DCISs and 1 ILC. Regarding the ROI-averaged analysis using AIC, the preference results were well agreed with those using F-test. Figure 1 illustrates the 1st post-contrast DCE-MRI image and its corresponding ADC map of an IDC (Figure 1A,B) in which bi-exponential fitting is preferred (Figure 1C), and a DCIS (Figure 1D,E) in which mono-exponential fitting is preferred (Figure 1F).

For ROI-averaged analysis, the mean D of total 29 tumors (0.92±0.25×10⁻³ mm2/s) was significantly smaller (P<0.001) than the mean ADC (1.04±0.29×10⁻³ mm2/s) (Figure 2). The values (mean ± SD) of f and D* for the whole cohort (n=29) were 13.4%±7.7% and 13.8±15.4×10⁻³ mm2/s, respectively. For those bi-exponential preferred tumors based on the F-test results, the mean ADC of total 15 tumors (0.97±0.24×10⁻³ mm2/s) was significantly larger (P<0.001) than the mean D (0.86±0.22×10⁻³ mm2/s). For the remaining 14 mono-exponential preferred tumors, the mean ADC was 1.11±0.32×10⁻³ mm2/s, still (but less) significantly larger (P<0.001) than the corresponding mean D of 0.98±0.27×10⁻³ mm2/s (Figure 2). Meanwhile, ADC, D, and f were not significantly different between the mono-exponential and bi-exponential preferable cohorts (Table 1). Although the D* value difference between the two cohorts appeared to be significant, the further interpretation should be made with caution by taking account of the higher uncertainty of D* quantification via bi-exponential fitting.


Full table
Heterogeneity of parameter values was found in all tumors by using voxel-wise mono-exponential and bi-exponential mapping. The voxel-wise R2 ranged from 0.75 to over 0.95, indicating the heterogeneous SNR within voxels. Regarding the voxel-wise analysis results using F-test and AIC, in sharp contrast to ROI-averaged analysis, all tumors except for two IDCs exhibited over half of all voxels presenting apparent mono-exponential DWI signal decay rather than bi-exponential decay (Figure 3). For the remaining two IDCs (Figure 4), more voxels within the tumor were significantly better fitted by bi-exponential function (ROI-averaged analysis also revealed bi-exponential preference). In terms of voxel fractions for each tumor subtype, voxel-wise F-test revealed that 23%±21% of voxels within the ROI exhibited bi-exponential signal decay for IDC, and 23%±12% for ILC, higher than the fraction of 10%±11% for DCIS (P=0.35 and P=0.23, respectively).


Similar to ROI-averaged analysis, the mean ADC (1.02±0.28×10⁻³ and 1.03±0.29×10⁻³ mm2/s for entire tumor cohort and the mono-exponential preferred cohort, respectively) was systematically and significantly (P<0.001) larger than the mean D (0.97±0.28×10⁻³ and 0.97±0.28×10⁻³ mm2/s, respectively) for the entire tumor cohort and the mono-exponential preferred cohort (Figure 5). Due to the extremely limited sample size of bi-exponential preferred cohort (n=2), the mean ADC (0.97±0.18×10⁻³ mm2/s) and D (0.88±0.11×10⁻³ mm2/s) showed no significant difference (P>0.05), although the mean ADC was still larger than D (Figure 5).

Discussion
IVIM-MRI has been gaining increased attention in clinical applications of various organs, including breast (14,34,37-41). Sigmund et al. (14) first demonstrated the feasibility of using IVIM model in breast lesions. In a cohort of cancerous breast lesion including different subtypes (n=24), the segmented-fitting estimated ADC, D, f, and D* (mean ± SD) from a spin echo based DWI acquisition at 3 T were 1.34±0.39×10⁻³, 1.15±0.35×10⁻³ mm2/s, 9.8%±4.8% and 15.1±10.4×10⁻³ mm2/s, respectively. Subsequent studies showed that IVIM parameters of f and D were helpful to better differentiate malignant and benign breast tumors than ADC (15,42). In the work of Bokacheva et al., the estimated ADC, D, f, and D* (mean ± SD) of 26 malignant breast lesions acquired by an EPI-DWI sequence at 3 T were 1.40±0.30×10⁻³, 1.29±0.28×10⁻³ mm2/s, 6.4%±3.1% and 21.7±11.0×10⁻³ mm2/s, respectively (15). In the work of Liu et al., EPI-DWI were obtained at 1.5 T on 40 malignant breast lesions, the median values of ADC, D, f, and D* were reported as 0.95×10⁻³, 0.85×10⁻³ mm2/s, 10.34% and 94.71×10⁻³ mm2/s, respectively (42). In terms of IVIM quantification in breast, Cho et al. (36) compared fitting methods and sampling strategies, then proposed an optimized b-factor combination for improved IVIM parameters estimation in breast cancer. Their reported IVIM parameters of malignant lesions (n=24) estimated from an optimized b-factor combination and segmented fitting at 3 T were 1.195±0.471×10⁻³ mm2/s, 13.183%±6.529% and 16.83±9.06×10⁻³ mm2/s, for D, f, and D* respectively. Suo et al. (43) also compared three different curve-fitting methods for IVIM analysis in a cohort of 12 IDC tumors obtained at 3 T using an EPI sequence with 7 b-factors. The reported D, f, and D* values estimated by the similar segmented fitting as our approach were 0.83±0.19×10⁻³ mm2/s, 6.10%±3.19% and 159.50±90.32×10⁻³ mm2/s, respectively. By comparing the ADC and IVIM parameters values obtained in our study to those in the literatures, variabilities of the estimated values were found for all parameters, which could be attributed to the heterogeneities of tumor cohorts, acquisition sequences, b values and quantification methods. In particular, the largest discrepancy (>1,000% difference) was found in D*, and the second largest (up to 276% difference) in f, indicating the high uncertainty of f and D* via bi-exponential fitting approach, even when the optimized method was applied. In contrast, the discrepancies on the estimated ADC (up to ~47% difference) and D (up to ~52% difference) between different studies were much smaller compared to D* and f. However, none of previous studies examined whether IVIM analysis provides significantly better fit of DWI signal decay in breast cancer in a statistical view.
In this study, we statistically compared the segmented bi-exponential fitting and mono-exponential fitting f of DWI signal decay in malignant breast tumors. Despite that F-test is known to tend to choose the simpler model in comparison to AIC (44), the model preference results derived from both F-test and AIC in our study were consistent. In total 29 breast tumors, 15 tumors were significantly better fitted by bi-exponential function while other 14 tumors were not by using ROI-averaged analysis. More advanced invasive tumors of IDC (12:10) and ILC (2:1) while fewer precursor tumors of DCIS (1:3) were better fitted by bi-exponential model as found in ROI-averaged analysis. Regardless of model preference and tumor subtypes, ADC value was significantly larger than D. On the other hand, there was no significant difference in the value of ADC, D, and f between the mono-exponential preferred cohort and the bi-exponential preferred cohort.
The significantly better fitting to bi-exponential function by ROI-averaged analysis in over half tumors strongly suggested the presence of IVIM effect in these tumors. The exhibition of bi-exponential DWI signal in more advanced invasive tumors might indicate the increased micro-vascularity in the invasive tumors compared to the precursor tumor in situ (i.e., DCIS), while yet to be further verified. On the other hand, a number of advanced invasive tumors apparently exhibited mono-exponential DWI signal decay. This may be interpreted by either the absence of IVIM effect, or the undetectability of IVIM effect restricted by the limited SNR under the scan protocol (16). These two possibilities cannot be further delineated based on the current study. Presuming the presence of IVIM effect, the detectability of bi-exponential DWI signal could theoretically be improved by using more and optimized b-factors, higher NSA and better estimation methods. Nevertheless, as 8 b-factors and NSA of 4 were applied for acquisition and the segmented bi-exponential fitting was used for IVIM analysis, our data represented a typical clinically applicable protocol with reasonably high SNR, so it is believed that the model preference was not biased by the scan protocol and fitting method. The significantly larger value of ADC than D in all tumors suggests that the DWI signal at low b-factors does affect most likely overestimate the tumor diffusivity (45), regardless of fitting model preference. In consequence, D may be used as a more accurate parameter to reveal tissue diffusivity than ADC. The insignificant difference in the calculated f between the mono-exponential preferred cohort and the bi-exponential preferred cohort was a bit out of expectation, which might be majorly explained by the relatively lower micro-vascularity and hence the small value of underlying f (generally reported as <15% in literatures) in breast cancers. It has been suggested that small f could be associated with higher estimation uncertainty, which was also reflected by the larger SD of f in the mono-exponential preferable cohort (Table 1). It is plausible that this larger SD resulted from the f estimation uncertainty may obscure the difference of f between the mono-exponential and bi-exponential cohorts. On the other hand, the relatively small sample size might also contribute to the insignificant difference, so should be increased in future studies for better delineation.
Quite different from the ROI-averaged analysis, the voxel-wise analysis reveals that most tumors (n=27) presented more voxels exhibiting mono-exponential diffusion behavior than bi-exponential type, implying the heterogeneous but relatively small microvascularity in breast cancer. In addition, this difference may be explained by that ROI-averaged analysis could remarkably increase the DWI signal SNR and thus enhance the detectability of macroscopic IVIM effect (46,47). It has been recognized that the noise of magnitude MR image acquired by a single coil has Rician distribution rather than Gaussian distribution (48). At extremely low SNR below three, Rician distribution can be considerably deviates from Gaussian distribution, and results in the non-zero positive mean of the noise. In this study, all images were acquired by an array coil. Although the magnitude image noise pattern could be complicated, the voxel-wise fitting, in particular at high b values was carefully examined in this study to avoid the possible bias introduced by noise. In all cases, flattening of the DWI decay at high b-factors was not observed, and the image intensities within the lesion ROIs were still well above the background noise level even at the highest b value of 1,000 s/mm2. In the presence of tumor heterogeneity revealed by voxel-wise analysis, it is interesting to find that the average bi-exponential preferable voxel fraction (23%) was higher in advanced IDC and ILC tumors than the voxel fraction (10%) in precursor DCIS tumors, indicating the increased micro-vascularity in advanced breast tumors. Nevertheless, this has to be thoroughly further validated. Similar to the ROI-averaged analysis result, the calculated mean ADC in voxel-wise analysis was significantly larger than the corresponding mean D. One advantage of voxel-wise analysis over ROI-averaged analysis is the capability of revealing tumor heterogeneity. However, considering the relatively lower SNR compared to ROI-averaged analysis, f and D* should be used and interpreted with caution due to the possible inaccuracy and high uncertainty induced by quantification (23,36).
It is interesting to compare the DWI model preference results in breast cancer as found by this study to those in other tissues. Wittsack et al. reported that bi-exponential model better described the DWI signal decay of the healthy kidney at 3 T even for voxel-wise analysis, while was less robust to noise than mono-exponential model (49). In another study, Quentin et al. (44) found that mono-exponential model was most preferable in prostate cancers compared to other advanced diffusion models including bi-exponential IVIM, and bi-exponential model was best to describe DWI signal in healthy prostates of young volunteers. These model preference differences from our results in breast cancer could be explained by the intrinsic properties of different tissues, such as diffusivity and capillary density, as well as the different acquisition protocols used. It is speculated that the capillary density in kidney might be much higher (mean f=0.44 in Wittsack’s study) than that in breast, which makes the bi-exponential DWI behavior more easily to be detected. Meanwhile, breast and prostate DWI is suspected to suffer from lower SNR and more pronounced artifact than kidney DWI, which might also obscure the underlying bi-exponential DWI under a typical clinical acquisition protocol. It is also noticed that the averaged f in prostate cancer was reported as 0.29 in Quentin’s study (44) while mono-exponential was still preferable. This also supports the more frequent mono-exponential model preference as found by our study in breast cancer since the f value was even lower (<0.15).
This study is majorly limited in its small sample size, in particularly of DCIS and ILC. We only focused on malignant breast tumors in which more pronounced IVIM effect could be presumed. The discrimination of normal tissue, precursor and advanced breast tumors using IVIM parameters (15,42) is beyond the study purpose. We did not correlate the IVIM parameters to pathology or clinical outcome either because of the retrospective nature of this study. To further enhance the clinical impact, these investigations are warranted in the future and some promising results have been reported in other tissues in literatures (50,51). It is worth noting that DWI signal model preference and the calculated parameter values are dependent on scan protocol and fitting method. Although high NSA and segmented fitting were applied, our results just applied to the specific acquisition protocol and fitting method, representing a typical situation under clinically practical and achievable protocol, which might not be the most optimized one. It is also recognized that the number of b-factors used in our study, i.e., 8, was relatively small. As such, the statistical power of F-test and AIC might need to be further strengthened by applying even more b-factors, but at the cost of the longer scan time. Meanwhile, the pre-processing for fitting in this study might have some pitfalls. For example, performing linear least-square fits to logarithmic forms of the mono-exponential function, although is frequently adopted in many studies to simplify computation, this logarithmization operation might potentially affect the noise distribution pattern of the image and hence the fitting result, in particular at low SNRs. The optimization of IVIM acquisition and quantification is definitely worth being further exploited, whereas is also beyond the purpose of this study, and needs to be conducted in a prospective study design in the future.
Conclusions
In conclusion, although the presence of IVIM effect could be strongly suggested in some malignant breast tumors, our results show that bi-exponential fitting does not necessarily better represent the DWI signal decay in breast cancer in a statistical view under a clinically typical acquisition protocol and SNR as the microvascularity in breast cancer might be generally small. Although the IVIM detectability and quantification in breast cancer are much dependent on many factors such as acquisition protocol, fitting algorithm and analysis method, our study indicates the importance to statistically examine the breast cancer DWI signal characteristics in practice so as to select the appropriate model to interpret the quantification result in DWI analysis.
Acknowledgements
None.
Footnote
Conflicts of Interest: The authors have no conflicts of interest to declare.
Ethical Statement: The study was approved by the local Institutional Review Board with a waiver of informed consent.
References
- Horak ER, Leek R, Klenk N, LeJeune S, Smith K, Stuart N, Greenall M, Stepniewska K, Harris AL. Angiogenesis, assessed by platelet/endothelial cell adhesion molecule antibodies, as indicator of node metastases and survival in breast cancer. Lancet 1992;340:1120-4. [Crossref] [PubMed]
- Carmeliet P, Jain RK. Angiogenesis in cancer and other diseases. Nature 2000;407:249-57. [Crossref] [PubMed]
- Weidner N, Folkman J, Pozza F, Bevilacqua P, Allred EN, Moore DH, Meli S, Gasparini G. Tumor angiogenesis: a new significant and independent prognostic indicator in early-stage breast carcinoma. J Natl Cancer Inst 1992;84:1875-87. [Crossref] [PubMed]
- Toi M, Inada K, Suzuki H, Tominaga T. Tumor angiogenesis in breast cancer: its importance as a prognostic indicator and the association with vascular endothelial growth factor expression. Breast Cancer Res Treat 1995;36:193-204. [Crossref] [PubMed]
- Boudreau N, Myers C. Breast cancer-induced angiogenesis: multiple mechanisms and the role of the microenvironment. Breast Cancer Res 2003;5:140-6. [Crossref] [PubMed]
- Brooks PC, Strömblad S, Klemke R, Visscher D, Sarkar FH, Cheresh DA. Antiintegrin alpha v beta 3 blocks human breast cancer growth and angiogenesis in human skin. J Clin Invest 1995;96:1815-22. [Crossref] [PubMed]
- Shojaei F. Anti-angiogenesis therapy in cancer: current challenges and future perspectives. Cancer Lett 2012;320:130-7. [Crossref] [PubMed]
- Buckley DL, Drew PJ, Mussurakis S, Monson JR, Horsman A. Microvessel density of invasive breast cancer assessed by dynamic Gd-DTPA enhanced MRI. J Magn Reson Imaging 1997;7:461-4. [Crossref] [PubMed]
- Leach MO. Application of magnetic resonance imaging to angiogenesis in breast cancer. Breast Cancer Res 2001;3:22-7. [Crossref] [PubMed]
- Su MY, Cheung YC, Fruehauf JP, Yu H, Nalcioglu O, Mechetner E, Kyshtoobayeva A, Chen SC, Hsueh S, McLaren CE, Wan YL. Correlation of dynamic contrast enhancement MRI parameters with microvessel density and VEGF for assessment of angiogenesis in breast cancer. J Magn Reson Imaging. 2003;18:467-77. [Crossref] [PubMed]
- O'Connor JP, Jackson A, Parker GJ, Jayson GC. DCE-MRI biomarkers in the clinical evaluation of antiangiogenic and vascular disrupting agents. Br J Cancer 2007;96:189-95. [Crossref] [PubMed]
- Le Bihan D, Breton E, Lallemand D, Aubin ML, Vignaud J, Laval-Jeantet M. Separation of diffusion and perfusion in intravoxel incoherent motion MR imaging. Radiology 1988;168:497-505. [Crossref] [PubMed]
- Marckmann P, Skov L, Rossen K, Dupont A, Damholt MB, Heaf JG, Thomsen HS. Nephrogenic systemic fibrosis: suspected causative role of gadodiamide used for contrast-enhanced magnetic resonance imaging. J Am Soc Nephrol 2006;17:2359-62. [Crossref] [PubMed]
- Sigmund EE, Cho GY, Kim S, Finn M, Moccaldi M, Jensen JH, Sodickson DK, Goldberg JD, Formenti S, Moy L. Intravoxel incoherent motion imaging of tumor microenvironment in locally advanced breast cancer. Magn Reson Med 2011;65:1437-47. [Crossref] [PubMed]
- Bokacheva L, Kaplan JB, Giri DD, Patil S, Gnanasigamani M, Nyman CG, Deasy JO, Morris EA, Thakur SB. Intravoxel incoherent motion diffusion-weighted MRI at 3.0 T differentiates malignant breast lesions from benign lesions and breast parenchyma. J Magn Reson Imaging 2014;40:813-23. [Crossref] [PubMed]
- Nilsen LB, Fangberget A, Geier O, Seierstad T. Quantitative analysis of diffusion-weighted magnetic resonance imaging in malignant breast lesions using different b value combinations. Eur Radiol 2013;23:1027-33. [Crossref] [PubMed]
- Koh DM, Collins DJ, Orton MR. Intravoxel incoherent motion in body diffusion-weighted MRI: reality and challenges. AJR Am J Roentgenol 2011;196:1351-61. [Crossref] [PubMed]
- Istratov AA, Vyvenko OF. Exponential analysis in physical phenomena. Rev Sci Instrum 1999;70:1233-57. [Crossref]
- Sheather SJ. Variable Selection. In: Sheather SJ. A Modern Approach to Regression with R. New York, NY: Springer New York, 2009:227-261.
- Pekar J, Moonen CT, van Zijl PC. On the precision of diffusion/perfusion imaging by gradient sensitization. Magn Reson Med 1992;23:122-9. [Crossref] [PubMed]
- Lemke A, Stieltjes B, Schad LR, Laun FB. Toward an optimal distribution of b values for intravoxel incoherent motion imaging. Magn Reson Imaging 2011;29:766-76. [Crossref] [PubMed]
- Andreou A, Koh DM, Collins DJ, Blackledge M, Wallace T, Leach MO, Orton MR. Measurement reproducibility of perfusion fraction and pseudodiffusion coefficient derived by intravoxel incoherent motion diffusion-weighted MR imaging in normal liver and metastases. Eur Radiol 2013;23:428-34. [Crossref] [PubMed]
- Zhang Q, Wang YX, Ma HT, Yuan J. Cramér-Rao bound for Intravoxel Incoherent Motion Diffusion Weighted Imaging fitting. 2013 35th Annual International Conference of the IEEE Engineering in Medicine and Biology Society (EMBC) 2013:511-4.
- Kakite S, Dyvorne H, Besa C, Cooper N, Facciuto M, Donnerhack C, Taouli B. Hepatocellular carcinoma: short-term reproducibility of apparent diffusion coefficient and intravoxel incoherent motion parameters at 3.0T. J Magn Reson Imaging 2015;41:149-56. [Crossref] [PubMed]
- Neil JJ, Bretthorst GL. On the use of Bayesian probability theory for analysis of exponential decay data: an example taken from intravoxel incoherent motion experiments. Magn Reson Med 1993;29:642-7. [Crossref] [PubMed]
- Freiman M, Perez-Rossello JM, Callahan MJ, Voss SD, Ecklund K, Mulkern RV, Warfield SK. Reliable estimation of incoherent motion parametric maps from diffusion-weighted MRI using fusion bootstrap moves. Med Image Anal 2013;17:325-36. [Crossref] [PubMed]
- Zhang Q, King AD, Bhatia KS, Yeung DK, Wang YX, Liang D, Yuan J. Improving intra-voxel incoherent motion MRI quantification using wild bootstrap. 2014 IEEE 11th International Symposium on Biomedical Imaging (ISBI) 2014:726-9.
- Veraart J, Rajan J, Peeters RR, Leemans A, Sunaert S, Sijbers J. Comprehensive framework for accurate diffusion MRI parameter estimation. Magn Reson Med 2013;70:972-84. [Crossref] [PubMed]
- Henkelman RM, Neil JJ, Xiang QS. A quantitative interpretation of IVIM measurements of vascular perfusion in the rat brain. Magn Reson Med 1994;32:464-9. [Crossref] [PubMed]
- Neil JJ, Ackerman JJ. Detection of pseudodiffusion in rat brain following blood substitution with perfluorocarbon. J Magn Reson 1969;97:194-201.
- Baron P, Dorrius MD, Kappert P, Oudkerk M, Sijens PE. Diffusion-weighted imaging of normal fibroglandular breast tissue: influence of microperfusion and fat suppression technique on the apparent diffusion coefficient. NMR Biomed 2010;23:399-405. [PubMed]
- Mandel J. The statistical analysis of experimental data. New York: Wiley & Sons, Inc., 1964.
- Akaike H. Information theory and an extension of the maximum likelihood principle. In: Emanuel Parzen, Kunio Tanabe, Genshiro Kitagawa. editors.New York: Springer New York, 1998:199-213.
- Luciani A, Vignaud A, Cavet M, Nhieu JT, Mallat A, Ruel L, Laurent A, Deux JF, Brugieres P, Rahmouni A. Liver cirrhosis: intravoxel incoherent motion MR imaging--pilot study. Radiology 2008;249:891-9. [Crossref] [PubMed]
- Guiu B, Petit JM, Capitan V, Aho S, Masson D, Lefevre PH, Favelier S, Loffroy R, Vergès B, Hillon P, Krausé D, Cercueil JP. Intravoxel incoherent motion diffusion-weighted imaging in nonalcoholic fatty liver disease: a 3.0-T MR study. Radiology 2012;265:96-103. [Crossref] [PubMed]
- Cho GY, Moy L, Zhang JL, Baete S, Lattanzi R, Moccaldi M, Babb JS, Kim S, Sodickson DK, Sigmund EE. Comparison of fitting methods and b-value sampling strategies for intravoxel incoherent motion in breast cancer. Magn Reson Med 2014;74:1077-85. [Crossref] [PubMed]
- Re TJ, Lemke A, Klauss M, Laun FB, Simon D, Grünberg K, Delorme S, Grenacher L, Manfredi R, Mucelli RP, Stieltjes B. Enhancing pancreatic adenocarcinoma delineation in diffusion derived intravoxel incoherent motion f-maps through automatic vessel and duct segmentation. Magn Reson Med 2011;66:1327-32. [Crossref] [PubMed]
- Sumi M, Van Cauteren M, Sumi T, Obara M, Ichikawa Y, Nakamura T. Salivary gland tumors: use of intravoxel incoherent motion MR imaging for assessment of diffusion and perfusion for the differentiation of benign from malignant tumors. Radiology 2012;263:770-7. [Crossref] [PubMed]
- Rheinheimer S, Stieltjes B, Schneider F, Simon D, Pahernik S, Kauczor HU, Hallscheidt P. Investigation of renal lesions by diffusion-weighted magnetic resonance imaging applying intravoxel incoherent motion-derived parameters--initial experience. Eur J Radiol 2012;81:e310-6. [Crossref] [PubMed]
- Pang Y, Turkbey B, Bernardo M, Kruecker J, Kadoury S, Merino MJ, Wood BJ, Pinto PA, Choyke PL. Intravoxel incoherent motion MR imaging for prostate cancer: an evaluation of perfusion fraction and diffusion coefficient derived from different b-value combinations. Magn Reson Med 2013;69:553-62. [Crossref] [PubMed]
- Yuan J, Yeung DK, Mok GS, Bhatia KS, Wang YX, Ahuja AT, King AD. Non-Gaussian analysis of diffusion weighted imaging in head and neck at 3T: a pilot study in patients with nasopharyngeal carcinoma. PLoS One 2014;9:e87024. [Crossref] [PubMed]
- Liu C, Liang C, Liu Z, Zhang S, Huang B. Intravoxel incoherent motion (IVIM) in evaluation of breast lesions: comparison with conventional DWI. Eur J Radiol 2013;82:e782-9. [Crossref] [PubMed]
- Suo S, Lin N, Wang H, Zhang L, Wang R, Zhang S, Hua J, Xu J. Intravoxel incoherent motion diffusion-weighted MR imaging of breast cancer at 3.0 tesla: Comparison of different curve-fitting methods. J Magn Reson Imaging 2015;42:362-70. [Crossref] [PubMed]
- Quentin M, Blondin D, Klasen J, Lanzman RS, Miese FR, Arsov C, Albers P, Antoch G, Wittsack HJ. Comparison of different mathematical models of diffusion-weighted prostate MR imaging. Magn Reson Imaging 2012;30:1468-74. [Crossref] [PubMed]
- Yamada I, Aung W, Himeno Y, Nakagawa T, Shibuya H. Diffusion coefficients in abdominal organs and hepatic lesions: evaluation with intravoxel incoherent motion echo-planar MR imaging. Radiology 1999;210:617-23. [Crossref] [PubMed]
- Chow AM, Gao DS, Fan SJ, Qiao Z, Lee FY, Yang J, Man K, Wu EX. Liver fibrosis: an intravoxel incoherent motion (IVIM) study. J Magn Reson Imaging 2012;36:159-67. [Crossref] [PubMed]
- Lu PX, Huang H, Yuan J, Zhao F, Chen ZY, Zhang Q, Ahuja AT, Zhou BP, Wáng YX. Decreases in molecular diffusion, perfusion fraction and perfusion-related diffusion in fibrotic livers: a prospective clinical intravoxel incoherent motion MR imaging study. PLoS One 2014;9:e113846. [Crossref] [PubMed]
- Gudbjartsson H, Patz S. The Rician distribution of noisy MRI data. Magn Reson Med 1995;34:910-4. [Crossref] [PubMed]
- Wittsack HJ, Lanzman RS, Mathys C, Janssen H, Mödder U, Blondin D. Statistical evaluation of diffusion-weighted imaging of the human kidney. Magn Reson Med 2010;64:616-22. [PubMed]
- Kang KM, Lee JM, Yoon JH, Kiefer B, Han JK, Choi BI. Intravoxel incoherent motion diffusion-weighted MR imaging for characterization of focal pancreatic lesions. Radiology 2014;270:444-53. [Crossref] [PubMed]
- Woo S, Lee JM, Yoon JH, Joo I, Han JK, Choi BI. Intravoxel incoherent motion diffusion-weighted MR imaging of hepatocellular carcinoma: correlation with enhancement degree and histologic grade. Radiology 2014;270:758-67. [Crossref]

