
Algorithms for improved 3-D reconstruction of live mammalian embryo vasculature from optical coherence tomography data
Introduction
The cardiovascular system is the first functional organ system to develop in the embryo. Consisting of the heart, vessels, and blood, the circulatory system of the embryo is responsible for the transport of oxygen, nutrients, and waste to and from the developing tissue. Impairments in the early development of the cardiovascular system can lead to congenital cardiovascular birth defects (1,2), and in severe cases, embryonic death. In particular, the early establishment and remodeling of the embryonic vasculature is a critical step for maintaining embryonic viability. To investigate the mechanisms of vascular remodeling in the developing embryo, the mouse has become a leading model system due to the availability of genetic manipulation tools, and the relatively short gestation period. The initial vessels of the mouse embryo form in the extra-embryonic yolk sac starting at embryonic day E7.5; resulting in a network of small vessels which are homogeneous in shape and size by E8.5. As the heart begins to beat, the primitive capillary plexus of the yolk sac is remodeled into a branched, hierarchical vessel network of large arteries, veins, and small capillary beds, evident by E9.5 (3,4). To this end, it has been shown that the development of embryonic yolk sac vasculature is closely related to the development of the embryonic heart (5). Moreover, it is also known that during embryonic development, vascular remodeling is induced by hemodynamic force (4), and that abnormal blood flow can potentially lead to heart defects (6-8). Visualization and quantification of this dynamic, morphogenetic remodeling process in living embryos remains a significant challenge. However, by combining embryo culture with optical imaging and image processing techniques, these challenges have begun to be overcome (9,10).
For the live imaging of mouse embryonic development, several noninvasive imaging techniques have been proposed and applied to obtain structural and functional information. Among these, ultrasound biomicroscopy (UBM) has been utilized to study the mouse embryos in utero with typical spatial resolutions of 30 to 40 µm for axial direction and 70 to 90 µm for lateral direction (11). Besides structural features, blood flow can also be assessed using the UBM-Doppler method (11). However, due to limitations in spatial resolution, achieving high-quality vasculature mapping with UBM remains challenging. With similar spatial resolving ability, micro-magnetic resonance imaging (µMRI) has been used for structural imaging of mouse embryos (12). However, the long data acquisition time (several hours) restricts the use of µMRI for live imaging of embryonic vascular development. With superior spatial resolution, optical imaging techniques possess advantages in vascular imaging. Therefore, confocal imaging has been used for studies on dynamic yolk sac vascular development with the spatial resolution down to sub-micron level (13). However, due to the field of view of confocal imaging being restricted by its imaging mechanism, mapping of large areas of the vasculature can be time consuming. Also, high contrast imaging of the vasculature usually requires fluorescence labeling, which exacerbates the time complexity.
Optical coherence tomography (OCT) is a non-invasive interferometry-based imaging system (14) which facilitates real-time imaging of biological structures. Beginning with ophthalmology (15,16), OCT has been extensively used in several other research and clinical applications (17-22). Recently, OCT has been applied to live imaging of various parts of the mammalian embryo (23-28) with resolutions ranging from 2-20 µm, and imaging depths of 1-5 mm. Overall, OCT has emerged as an excellent tool for imaging the live mammalian yolk sac vasculature (24), thus facilitating its comprehensive and quantitative analysis.
Doppler OCT has been the conventional tool for vascular reconstruction. This method can quantify blood flow. However, it has several limitations including: sensitivity to the phase stability of the system; limited resolving ability for capillaries; insensitivity to transverse component of blood flow; and sensitivity to bulk tissue motion (BTM) (29). The phase variance technique (30) improves upon this method, in that, it can detect blood flow in both transverse and parallel directions. However, it is still subject to the other limitations of Doppler OCT. Optical angiography (31) is a recently proposed method that is more sensitive in detecting blood flow compared to Doppler OCT. However, the method remains insensitive to the transverse flow component. Apart from the aforementioned methods, a few other approaches based on OCT data processing have also been proposed. For example, speckle correlation detects motion contrast by computing cross-correlation between successive frames recorded at the same location (32). However, the resolving ability of this method is largely dependent on the kernel size, in that, big vessels and capillaries may need a different kernel size to achieve a comparable reconstruction quality. Considering the fact that the variations in scatter caused by moving targets are higher than those caused by stationary ones, the speckle variance (SV) method (10,33,34) detects motion contrast by computing the variance in pixel intensities across multiple time points. Although SV provides good reconstruction quality for big vessels, its limitations include lower reconstruction quality for capillaries, and sensitivity to high-intensity fluctuations and BTM (29).
High quality 3-D reconstruction of blood vessels from OCT data and their computational analysis involves several challenges. These include the presence of multi-scale vessel structures, capillaries with weak flow, and artifacts contributed by BTM. As mentioned above, the previous methods have only partially addressed these challenges. In this study, a novel method based on anomaly detection and sparsity-based reconstruction is proposed and studied with comparisons to the SV approach and confocal imaging. This method combines the advantages of SV, whereas it uses anomaly detection (35,36) and sparse-reconstruction (37,38) to cope with the previously mentioned challenges.
Materials and methods
Animal manipulations and imaging
Flk1-H2B::YFPtg/tg; Flk1-myr::mCherrytg/tg x CD-1+/+ mouse timed matings are set overnight and checked for vaginal plugs daily. The day of the observed vaginal plug is counted as E0.5. Embryos are dissected at E8.5 and E9.0 with the yolk sac intact in dissection medium containing 89% DMEM/F12, 1% Pen-strep solution, and 10% FBS (Life Technologies). The dissection station is maintained at 37 °C. After dissection, embryos are transferred to a humidified incubator maintained at 37 °C, 5% CO2 and allowed to recover for 30 minutes. The dish and embryo are then transferred to a 37 °C, 5% CO2 microscope stage for image acquisition (39). Embryos are positioned such that the arterial vessels of the yolk sac can be imaged using OCT.
A spectral-domain OCT system is used to conduct live imaging of the mouse embryos. The details of the OCT system can be found in, e.g. (40,41). Briefly, the system employs a low-coherence Titanium:Sapphire laser source (Micra-5, Coherent, Inc.) that has a central wavelength of ~808 nm and a bandwidth of ~110 nm. A home-built high-resolution spectrometer with a complementary metal-oxide-semiconductor (CMOS) camera (Basler, Inc.) is used to resolve the interference of the light from the reference and sample arms. A two-axis galvanometer-mirror system (Cambridge Technology, Inc.) is utilized in the sample arm for 2-D transverse scanning of the laser beam over the sample. This system setup provides an axial resolution of ~5 µm in tissue and a transverse resolution of ~4 µm. During the experiments, the A-line acquisition speed is set to 62.5 kHz. The data acquisition is performed at 20 frames per position within the 3-D volume with a frame rate of 100 Hz. The imaging time for each sample is 200 seconds.
Upon completion of OCT image acquisition, the Flk1-H2B::YFPtg/+; Flk1-myr::mCherrytg/+ embryos are immediately imaged using a Zeiss LSM 780 laser scanning confocal microscope. Embryos are positioned such that the arterial vessels of the yolk sac can be imaged using 10× and 20× objectives. Z-stack images of whole mount yolk sacs are acquired, and maximum intensity projections are created for analysis of vascular morphology. Followed by this, the embryos are fixed in 4% paraformaldehyde/PBS at 4 °C overnight followed by rinsing in PBS. The yolk sac is then removed from the embryo, flattened and mounted on a glass slide with Fluoromount-G mounting medium. The entire flattened yolk sacs are tile-imaged again using a 10× objective on a LSM 780 confocal microscope. Z-stack images of the tiled flattened yolk sacs are acquired, and maximum intensity projections are created for analysis of vascular morphology.
Overview of the reconstruction method
The data obtained from the OCT system consists of spectral information (representing structure) corresponding to each A-line. We obtain the structural OCT image by computing the magnitude of the Fourier transform of the raw data, by means of the FFT algorithm. The intensity value at every pixel in the transformed data represents the total backscatter from a specific location in the specimen. For the purpose of our analysis, we consider the speckle arising from the blood flow as signal, and the speckle from all other sources as noise.
Figure 1 summarizes the computational pipeline for the proposed reconstruction method. Starting with 4-D (3-D + time) OCT data, the first step consists of processing the data with anomaly detection and SV. The integrated output of this step forms the input for sparse reconstruction, which employs a pre-computed parametric dictionary. The sparse reconstruction output provides the 3-D vascular data, which can be analyzed using standard vessel tracing algorithms (42-44), thereby facilitating morphological quantification of the data. A detailed presentation of each component follows in the next subsections, along with the motivation of each method employed.

Anomaly detection
In order to address the multiple inherent challenges involved in the reconstruction of blood vessels from OCT data, we propose an anomaly detection-based approach. Anomaly detection-based methods are extensively used in hyperspectral image processing (35,45,46) for detecting structures or patterns that are rare and distinguishable from the rest of the data points. They form a specific case of target detectors (TD), and are typically employed when the target spectral signature is either unavailable or challenging to obtain a priori. In adapting anomaly detection for vessel reconstruction, the temporal signal corresponding to blood is represented as the target, embedded in a locally homogenous background. The complex and non-deterministic nature of the dynamics associated with blood flow as imaged using OCT discourages the use of global model-based approaches, thereby making anomaly detection a justified choice for vessel reconstruction.
In applying anomaly detection for OCT vessel reconstruction, we compare the temporal signal at every pixel with that of the surrounding pixels belonging to a pre-determined spatial neighborhood. In the parlance of hyperspectral imaging, the number of spectral components at each location equals the number of frames acquired per position using OCT. We adapted the well-known Reed-Xiaoli (RX) algorithm (47) which is a benchmark method for anomaly detection in hyperspectral imaging. The RX algorithm is an adaptive matched filter that models the data as a Gaussian non-stationary multivariate random process with a space-varying mean and covariance matrix. Our adaptation of this algorithm for detecting anomalies in OCT data is termed speckle anomaly detection (SAD), which is a weighted addition of the RX metric and SV. The SAD metric is given by:
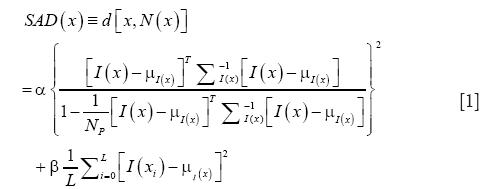
where α and β are constants, NP is the total number of pixels in the local background of the pixel at location x, μx and Σ are the mean and covariance respectively of the pixels in NP, and L is the number of frames per location. The first term in Eq. [1] is the normalized RX metric that is proportional to the Mahalanobis distance between the target signal and the local background, whereas the second term is the SV of the temporal target signal. Evidently, the proposed method is formulated with the goal of improving upon the SV method.
Sparse reconstruction
In recent years, sparse representations have successfully evolved as robust modeling schemes for acquisition and representation of multi-dimensional signals, and have made significant contributions to the field of image processing and computer vision (37,38,48-50). The main idea in sparse reconstruction is to effectively model the data as a linear combination of a small number of representative elements (called “atoms”) from a dictionary. Sparse representations thus exploit the redundancy inherent in the data.
In the context of OCT vessel reconstruction, we use sparse representation for two purposes. First, it is used for harnessing the structural redundancy found in the data, and second, to eliminate any morphological false detections that might result from a pixel-wise application of Eq. [1]. To this end, we model the blood vessels as geometrical structures with tube-like morphologies, and a piece-wise constant texture. These characteristics can be succinctly represented by a dictionary comprising of simple parametric shapes. For this purpose, we design a dictionary of 3-D solid cylinders at multiple scales and orientations. It should be noted that we choose to employ a hand-designed dictionary versus learning the dictionary from the data for two reasons. First, learning the dictionary is an exploratory approach which is inherently more suitable for solving problems where the underlying representation of the data is either unknown or challenging to model parametrically (e.g., natural images). Second, the use of a parametric dictionary allows for easy computation of geometrical features from the dictionary parameters, which can be effectively utilized for further processing steps including segmentation and vessel tracing. The parametric dictionary D used in this work is given by:
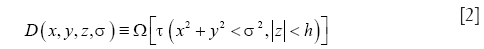

where x,y,z are the Cartesian coordinates, h is the height of the cylinder that is set equal to the size of the pre-determined local spatial neighborhood. Multiple scales (n) are selected using the function Ω. Multiple orientations are selected using the function τ that uniformly samples the range of possible azimuth angles φ and inclination angles θ. Along with the parametric dictionary D, a dictionary of cylinder centerlines is pre-computed as follows:

In applying the pre-computed dictionary D for sparse reconstruction, the image is divided into 3-D overlapping patches and sparse codes are computed for each patch by solving the following optimization problem:

for every pixel in the SAD image with a positive intensity value, where T specifies the number of dictionary atoms to be used for the reconstruction. Computing the exact solution for the optimization problem with L0 sparsity constraint (Eq. [5]) has been proven to be NP-hard (51,52). To this end, we use the orthogonal matching pursuit (OMP) algorithm (53) that provides an approximate and computationally efficient solution to the above problem. For details of the OMP algorithm, the reader is referred to (53). Followed by the application of OMP for each image patch, we compute the sparsity-integrated SAD (SSAD) image by using Dcenter as follows:
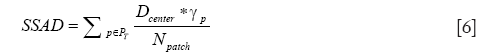
where Npatch is inversely proportional to the interval between adjacent patch centers for each patch p, PT is the set of all patches in an image, and γp is the sparse code computed using OMP based on the dictionary D. The SSAD result consists of the 3-D reconstructed image, which can be used for subsequent processing steps such as segmentation and feature computation.
Results and discussion
Parameter selection
Considering the necessity of applying the proposed method on large-scale datasets, all the algorithms have been designed with minimal requirements for parameter selection/tuning. The following parameters were used for processing the datasets described in this paper: for the SAD computation (Eq. [1]), the constants α and β in were both set to 0.5 in order to give equal contribution to the RX and SV estimates, whereas the window size, NP was set to 61 × 61 × L voxels, where L is the number of frames acquired per location. The latter was selected based on empirical knowledge of the expected size of the thickest blood vessel in the mouse embryos imaged using OCT. It should be noted that, given the covariance-based measurement used in Eq. [1], a window size that is sufficiently large to reconstruct a thick vessel, also suffices for reconstructing smaller vessels with a similar quality. Based on the same motivations, the patch size for sparse reconstruction was set to 16×16×16 voxels. Furthermore, in designing the dictionary D, the number of scales, σ was set such that, c ∈ (1,2) and the number of orientations in τ were set to 182. With the goal of promoting sparsity, the number of dictionary atoms, T for the minimization problem in Eq. [5] was set to a very low value of 5.
Reconstruction results
The proposed method was applied to the aforementioned mouse embryonic datasets. The algorithms were developed using MATLAB®, enabled with multi-core processing capability. To this end, the datasets were processed on a Dell 910 PowerEdge server with 40 processing cores; two threads per core and 1 TB of RAM running on Red Hat Enterprise Linux linked to a RAID 5 SAN. The output of the proposed method consists of 3-D tiff stacks with 32-bits/voxel.
Figure 2 demonstrates the comparative 3-D vessel reconstruction results on a dataset of an E8.5 embryo. It can be observed that the SSAD method [panel (B)] generates an overall higher-quality reconstruction compared to the SV method [panel (A)]. Specifically, the overlaid arrowheads indicate some of the locations where SSAD detects vessel segments that are partially or completely missed by SV, whereas the solid arrows indicate locations where SSAD provides a higher quality reconstruction compared to the corresponding vessels in SV, in terms of the continuity and smoothness of vessel structures. Additionally, the dashed arrows highlight locations where SSAD is able to minimize the speckle arising from other moving parts of the embryo (BTM), in comparison with SV. Similar comparisons are shown in panels (C,D) and (E,F) wherein the image has been cropped for visualization purposes. Panel (G) compares the intensity profile of the SSAD and SV result corresponding to the dashed line in panels (A) and (B). The relative magnitudes of the local maxima in these plots demonstrate that the SSAD generates a higher-contrast reconstruction of the blood vessels compared to SV. Along similar lines, Figure 3 illustrates the comparative performance of SSAD [panels (B), (D) and (F)] and SV [panels (A), (C) and (E)] reconstruction for a dataset of an E9.0 embryo wherein the intensity plots in panel (G) corresponds to the dashed curve in panels (A) and (B). Figures 2 and 3 demonstrate the qualitative superiority of the SSAD reconstruction over SV, in terms of the ability to detect weakly reconstructed vessel segments, reconstruct vessels with an overall higher contrast and minimization of the artifacts arising from BTM. The following paragraphs provide a quantitative validation of these observations. Figure 4 summarizes the comparison between SSAD and SV reconstructions using confocal data as the baseline. To this end, panel (A) shows the maximum intensity projection of the confocal image of a E9.0 yolk sac in which the vessels are labeled using a membrane targeted fluorescent protein, mCherry, acquired as mentioned earlier. The arterial section of the yolk sac, as indicated by the box, is expanded in panel (B), wherein it is aligned for facilitating comparisons with the corresponding SV [panel (C)] and SSAD [panel (D)] reconstructions. The corresponding vessel segments in panels (B-D) are marked with the same color. The red arrows in panels (B-D) point to the vessel segments that are detected by SSAD but are partially or completely missed by SV, whereas the white arrows indicate segments that are reconstructed with a comparatively higher contrast. The corresponding locations for these segments, as marked in panel (B), indicate that these structures in panel (D) indeed correspond to vessel segments (dashed lines) that are visible in the confocal data. Figure 4 thus corroborates the ability of the SSAD algorithm to detect valid vessel segments that might be missed or weakly reconstructed by current state-of-the-art methods such as SV. This is further confirmed by evaluating the SV, SSAD and confocal images using a standard active-contour based tracing algorithm (44). To this end, Figure 5 shows a sample result obtained after applying this algorithm to the SSAD output, wherein the vessel centerlines estimated by the active-contour based tracing algorithm (44) are shown in yellow. Based on application of the tracing algorithm, Figure 6 compares the number of detected segments for SV, SSAD and confocal images. As expected, the tracing algorithm could detect more vessel segments in the SSAD image compared to SV image due to the higher reconstruction quality of the prior. Additionally, tracing of the corresponding area from the confocal image resulted in the detection of a relatively large number of vessel segments which include the segments missed by both SV and SSAD reconstructions due to the resolution limits of OCT. Figure 6 thus quantifies the aforementioned improvements resulting from the SSAD reconstruction.


In addition to the tracing-based quantification, we employ the standard multi-scale “vesselness” metric (54) to provide a global morphological measure for vessel reconstruction quality. The vesselness value at scale sigma Vσ, is given by:
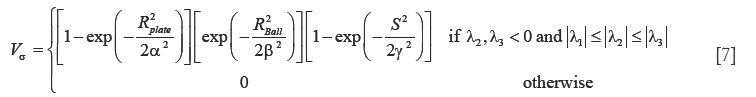
such that, 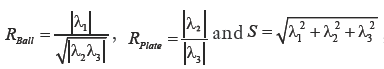 where α,β and γ are constants that indicate the corresponding weight for each term in the product and are set to 50%, 50% and 0.25% respectively of the maximum intensity value in the input image, λ1,λ2,λ3 are eigenvalues of the Hessian matrix at scale σ. The Hessian matrix is given by
  , wherein I is the input image and Gσ is the Gaussian function with standard deviation σ. The vesselness value at every pixel is computed as the maximum of Vσ across all the scales. Based on prior knowledge about the expected size of the vessel structures, σ was set equal to 2n where
  . Figure 7 summarizes the vesselness values for SSAD and SV reconstruction for N=6 datasets. It can be noticed that, the SSAD reconstruction resulted in an overall higher vesselness value (0.8±0.09) compared to SV (0.6±0.2), indicating an overall higher reconstruction quality.

Our results demonstrate that SSAD has significant advantages over the state-of-the-art SV method. Specifically, SSAD is able to reconstruct some of the vessel segments that are partially missed or weakly reconstructed by SV while providing an overall high-quality reconstruction, in terms of the smoothness, continuity and contrast of the vessel structures. Additionally, the SSAD reconstruction also results in minimization of artifacts arising due to BTM. While this encouraging, it should also be noted that SSAD is a computationally expensive method due to the analysis of a large neighborhood region around every pixel. Specifically, the SSAD run-time for a representative dataset is ~6 hours compared to SV which takes ~2 hours on the same dataset. In order to address this concern, the SSAD method has been implemented with contemporary multi-core computers in mind, and with increasing availability of computing cores, this limitation will be easily overcome.
Conclusions
The proposed SSAD method used a combination of anomaly detection and sparse representation for improved reconstruction of blood vessels from 4-D OCT data acquired from live mammalian embryos. Quantitative comparisons with the widely used SV method demonstrate that the proposed method generates a higher quality reconstruction of the vascular network, especially for those vessel structures that may be partially missed or weakly reconstructed by SV, and in areas with high BTM. Specifically, the SSAD resulted in an overall higher vesselness (0.8±0.09) compared to SV (0.6±0.2). These results suggest that SSAD is potentially a valuable tool for performing accurate quantification of the progression of vascular development in the mammalian embryonic yolk sac as imaged using OCT, thus having a significant potential to further embryonic cardiovascular research.
Although the advantages of SSAD are clear, there is room for further improvement. For example, the anomaly detection method could be improved by adapting non-linear modeling strategies such as the kernel-RX algorithm (55). This could be potentially useful for detecting vessels with very weak blood flow. To overcome the challenge of high computational cost, publicly-available high-performance computing resources (56) could be utilized for performing rapid analysis on large batches of images. Finally, as a natural consequence of this work, the SSAD method could be applied for discovering morphological differences in various developmental stages of the mammalian embryonic yolk sac vasculature.
Acknowledgements
This work was supported, in part, by grants 1R01EY022362, 1R01HL120140, and U54HG006348 from the NIH and PRJ71TN from DOD/NAVSEA.
Disclosure: The authors declare no conflict of interest.
References
- Go AS, Mozaffarian D, Roger VL, Benjamin EJ, Berry JD, Blaha MJ, Dai S, Ford ES, Fox CS, Franco S, Fullerton HJ, Gillespie C, Hailpern SM, Heit JA, Howard VJ, Huffman MD, Judd SE, Kissela BM, Kittner SJ, Lackland DT, Lichtman JH, Lisabeth LD, Mackey RH, Magid DJ, Marcus GM, Marelli A, Matchar DB, McGuire DK, Mohler ER 3rd, Moy CS, Mussolino ME, Neumar RW, Nichol G, Pandey DK, Paynter NP, Reeves MJ, Sorlie PD, Stein J, Towfighi A, Turan TN, Virani SS, Wong ND, Woo D, Turner MB; American Heart Association Statistics Committee and Stroke Statistics Subcommittee. Heart disease and stroke statistics--2014 update: a report from the American Heart Association. Circulation 2014;129:e28-e292. [PubMed]
- Kallen B. Epidemiology of human congenital malformations. Switzerland: Springer International Publishing, 2014.
- Walls JR, Coultas L, Rossant J, Henkelman RM. Three-dimensional analysis of vascular development in the mouse embryo. PLoS One 2008;3:e2853. [PubMed]
- Lucitti JL, Jones EA, Huang C, Chen J, Fraser SE, Dickinson ME. Vascular remodeling of the mouse yolk sac requires hemodynamic force. Development 2007;134:3317-26. [PubMed]
- Conway SJ, Kruzynska-Frejtag A, Kneer PL, Machnicki M, Koushik SV. What cardiovascular defect does my prenatal mouse mutant have, and why? Genesis 2003;35:1-21. [PubMed]
- Hove JR, Köster RW, Forouhar AS, Acevedo-Bolton G, Fraser SE, Gharib M. Intracardiac fluid forces are an essential epigenetic factor for embryonic cardiogenesis. Nature 2003;421:172-7. [PubMed]
- Hogers B, DeRuiter MC, Gittenberger-de Groot AC, Poelmann RE. Unilateral vitelline vein ligation alters intracardiac blood flow patterns and morphogenesis in the chick embryo. Circ Res 1997;80:473-81. [PubMed]
- Chapman WB. The effect of heart beat on the development of vascular system of the chick. Am J Anat 1918;23:175-203.
- Udan RS, Vadakkan TJ, Dickinson ME. Dynamic responses of endothelial cells to changes in blood flow during vascular remodeling of the mouse yolk sac. Development 2013;140:4041-50. [PubMed]
- Sudheendran N, Syed SH, Dickinson ME, Larina IV, Larin KV. Speckle variance OCT imaging of the vasculature in live mammalian embryos. Laser Phys Lett 2011;8:247-52.
- Phoon CK. Imaging tools for the developmental biologist: ultrasound biomicroscopy of mouse embryonic development. Pediatr Res 2006;60:14-21. [PubMed]
- Smith BR. Magnetic resonance microscopy in cardiac development. Microsc Res Tech 2001;52:323-30. [PubMed]
- Larina IV, Dickinson ME. In vivo cellular imaging using fluorescent proteins. Hoffman RM. eds. Totowa, NJ, USA: Humana Press, 2012;872:205-15.
- Huang D, Swanson EA, Lin CP, Schuman JS, Stinson WG, Chang W, Hee MR, Flotte T, Gregory K, Puliafito CA, et al. Optical coherence tomography. Science 1991;254:1178-81. [PubMed]
- Koozekanani D, Boyer K, Roberts C. Retinal thickness measurements from optical coherence tomography using a Markov boundary model. IEEE Trans Med Imaging 2001;20:900-16. [PubMed]
- Hee MR, Izatt JA, Swanson EA, Huang D, Schuman JS, Lin CP, Puliafito CA, Fujimoto JG. Optical coherence tomography of the human retina. Arch Ophthalmol 1995;113:325-32. [PubMed]
- Vakoc BJ, Fukumura D, Jain RK, Bouma BE. Cancer imaging by optical coherence tomography: preclinical progress and clinical potential. Nat Rev Cancer 2012;12:363-8. [PubMed]
- Rouba B, Karaszkiewicz P, Tymioska-Widmer L, Iwanicka M, Góra M, Kwiatkowska E, Targowski P. Optical coherence tomography for non-destructive investigations of structure of objects of art. J Nondestructive Testing 2008;13.
- Lehmann R, Bossen A, Meier C. Internal Fingerprint Identification With Optical Coherence Tomography. IEEE Photonics Technol Lett 2010;22:507-9.
- Fercher AF, Drexler W, Hitzenberger CK, Lasser T. Optical coherence tomography - principles and applications. Reports Prog Phys 2003;66:239-303.
- Meglinski IV, Buranachai C, Terry LA. Plant Photonics: Use of Optical Coherence Tomography to monitor defects and rots in onion. Laser Physics Letters 2010;7:307-10.
- Zhong HQ, Guo ZY, Wei HJ, Zeng CC, Xiong HL, He YH, Liu SH. Quantification of glycerol diffusion in human normal and cancer breast tissues in vitro with optical coherence tomography. Laser Phys Lett 2010;7:315-20.
- Jenkins MW, Rothenberg F, Roy D, Nikolski VP, Hu Z, Watanabe M, Wilson DL, Efimov IR, Rollins AM. 4D embryonic cardiography using gated optical coherence tomography. Opt Express 2006;14:736-48. [PubMed]
- Larina IV, Sudheendran N, Ghosn M, Jiang J, Cable A, Larin KV, Dickinson ME. Live imaging of blood flow in mammalian embryos using Doppler swept-source optical coherence tomography. J Biomed Opt 2008;13:060506. [PubMed]
- Luo W, Marks DL, Ralston TS, Boppart SA. Three-dimensional optical coherence tomography of the embryonic murine cardiovascular system. J Biomed Opt 2006;11:021014. [PubMed]
- Syed SH, Larin KV, Dickinson ME, Larina IV. Optical coherence tomography for high-resolution imaging of mouse development in utero. J Biomed Opt 2011;16:046004. [PubMed]
- Bhat S, Larina IV, Larin KV, Dickinson ME, Liebling M. 4D reconstruction of the beating embryonic heart from two orthogonal sets of parallel optical coherence tomography slice-sequences. IEEE Trans Med Imaging 2013;32:578-88. [PubMed]
- Larina IV, Larin KV, Dickinson ME, Liebling M. Sequential Turning Acquisition and Reconstruction (STAR) method for four-dimensional imaging of cyclically moving structures. Biomed Opt Express 2012;3:650-60. [PubMed]
- Mahmud MS, Cadotte DW, Vuong B, Sun C, Luk TW, Mariampillai A, Yang VX. Review of speckle and phase variance optical coherence tomography to visualize microvascular networks. J Biomed Opt 2013;18:50901. [PubMed]
- Fingler J, Schwartz D, Yang C, Fraser SE. Mobility and transverse flow visualization using phase variance contrast with spectral domain optical coherence tomography. Opt Express 2007;15:12636-53. [PubMed]
- Wang RK, Jacques SL, Ma Z, Hurst S, Hanson SR, Gruber A. Three dimensional optical angiography. Opt Express 2007;15:4083-97. [PubMed]
- Enfield J, Jonathan E, Leahy M. In vivo imaging of the microcirculation of the volar forearm using correlation mapping optical coherence tomography (cmOCT). Biomed Opt Express 2011;2:1184-93. [PubMed]
- Conroy L, DaCosta RS, Vitkin IA. Quantifying tissue microvasculature with speckle variance optical coherence tomography. Opt Lett 2012;37:3180-2. [PubMed]
- Mariampillai A, Leung MK, Jarvi M, Standish BA, Lee K, Wilson BC, Vitkin A, Yang VX. Optimized speckle variance OCT imaging of microvasculature. Opt Lett 2010;35:1257-9. [PubMed]
- Matteoli S, Diani M, Corsini G. A tutorial overview of anomaly detection in hyperspectral images. IEEE A&E Systems Magazine 2010;25:5-28.
- Molero JM, Paz A, Garzón EM, Martinez JA, Plaza A, García I. Fast anomaly detection in hyperspectral images with RX method on heterogeneous clusters. J Supercomput 2011;58:411-9.
- Elad M, Figueiredo MA, Ma Y. On the role of sparse and redundant representations in image processing. Proc IEEE 2010;98:972-82.
- Wright J, Ma Y, Mairal J, Sapiro G, Huang TS, Yan S. Sparse representation for computer vision and pattern recognition. Proceedings of the IEEE 2010;98:1031-44.
- Garcia MD, Udan RS, Hadjantonakis AK, Dickinson ME. Live imaging of mouse embryos. Cold Spring Harb Protoc 2011;2011:pdb.top104.
- Wang S, Lopez AL 3rd, Morikawa Y, Tao G, Li J, Larina IV, Martin JF, Larin KV. Noncontact quantitative biomechanical characterization of cardiac muscle using shear wave imaging optical coherence tomography. Biomed Opt Express 2014;5:1980-92. [PubMed]
- Larin KV, Syed SH, Coughlin AJ, Wang S, West JL, Dickinson ME, Larina IV. OCT guided microinjections for mouse embryonic research. SPIE BiOS 2013;85930E.
- Narayanaswamy A, Dwarakapuram S, Bjornsson CS, Cutler BM, Shain W, Roysam B. Robust adaptive 3-D segmentation of vessel laminae from fluorescence confocal microscope images and parallel GPU implementation. IEEE Trans Med Imaging 2010;29:583-97. [PubMed]
- Delibasis KK, Kechriniotis AI, Tsonos C, Assimakis N. Automatic model-based tracing algorithm for vessel segmentation and diameter estimation. Comput Methods Programs Biomed 2010;100:108-22. [PubMed]
- Wang Y, Narayanaswamy A, Tsai CL, Roysam B. A broadly applicable 3-D neuron tracing method based on open-curve snake. Neuroinformatics 2011;9:193-217. [PubMed]
- Matteoli S, Diani M, Corsini G. Improved estimation of local background covariance matrix for anomaly detection in hyperspectral images. Optical Engineering 2010;49:46201.
- Zhou H, Niu X, Qin H, Zhou J, Lai R, Wang B. Shearlet transform based anomaly detection for hyperspectral image. Int Symp Adv Opt Manufac Test Tech 2012;84190I.
- Reed IS, Yu X. Adaptive multiple-band CFAR detection of an optical pattern with unknown spectral distribution. IEEE Trans Acoust Speech Signal Process 1990;38:1760-70.
- Zibulevsky M, Elad M. L1-L2 optimization in signal and image processing. IEEE Signal Process Mag 2010;27:76-88.
- Dabov K, Foi A, Katkovnik V, Egiazarian K. Image denoising by sparse 3-D transform-domain collaborative filtering. IEEE Trans Image Process 2007;16:2080-95. [PubMed]
- Elad M. Sparse and Redundant Representation Modeling — What Next? IEEE Signal Processing Letters 2012;19:922-8.
- Natarajan BK. Sparse approximate solutions to linear systems. SIAM J Comput 1995;24:227-34.
- Bruckstein AM, Donoho DL, Elad M. From sparse solutions of systems of equations to sparse modeling of signals and images. SIAM Rev 2009;51:34-81.
- Pati YC, Rezaiifar R, Krishnaprasad PS. Orthogonal matching pursuit : recursive function approximation with applications to wavelet decomposition. Asilomar Conf on Signal Sys Comput 1993;1:40-4.
- Frangi AF, Niessen WJ, Vincken KL, Viergever MA. Multiscale vessel enhancement filtering. Med Image Comput Comput Assist Interv 1998;1496:130-7.
- Kwon H, Nasrabadi NM. Kernel RX-algorithm: a nonlinear anomaly detector for hyperspectral imagery. IEEE Trans Geosci Remote Sens 2005;43:388-97.
- Texas advanced computing center. 2013. Available online: https://www.tacc.utexas.edu/

