

In vivo assessment of extracellular pH of joint tissues using acidoCEST-UTE MRI
Introduction
Osteoarthritis is a debilitating disease with considerable individual and societal impact (1). Progression of this disease is mediated by a variety of biochemical factors. One such factor, extracellular pH, affects expression and function of several proteins involved in the degradation of cartilage (2,3). In particular, chondrocytes, which are responsible for synthesis and maintenance of the cartilage matrix, have been shown to exhibit inhibited matrix synthesis in acidic conditions (pH<7.1) (4). Certain cells present in the environment of the joint are even able to modulate pH, such as osteoclasts, which dissolve bone by secretion of acid (5). In addition to driving cartilage degradation, the acidification of joint tissue may contribute to osteoarthritis-related pain. Decreased pH in neuromusculoskeletal structures has been correlated with increased pain (6-9), and thus could help explain the poor association between patient-reported pain and degenerated structural findings on magnetic resonance imaging (MRI) (10).
Until recently, pH of cartilage and meniscus could only be measured ex vivo, or in vivo by an invasive process. Now, non-invasive, pH-sensitive measurements can be made with chemical exchange saturation transfer (CEST) MRI, or acidoCEST MRI (11,12). This technique uses Food and Drug Administration- and European Medicines Agency-approved diamagnetic contrast agents, such as iopamidol or iohexol, to measure the exchange of protons between water and amide side chains. While acidoCEST MRI has predominantly been used to measure pH in tumors, the technique has recently been modified by Ma et al. (13) for application to musculoskeletal tissues. Traditional acidoCEST sequences have long, high-power saturation periods and use readouts with longer echo times (14), which are not suitable for tissues with short T2 relaxation such as cartilage and meniscus (15). This barrier has been overcome by the addition of an ultrashort echo time (UTE) readout to the acidoCEST sequence (16). Still, acidoCEST-UTE sequence parameters remain unoptimized for musculoskeletal tissues and the technique has not yet been applied to patients for measurement of pH in musculoskeletal tissues in vivo. Previous work by Ma et al. determined that ratio of radiofrequency power mismatch (RPM) showed strong correlation coefficients between fluid, cartilage, and meniscus, yet only two saturation powers, 0.56 and 1.10 µT, were evaluated. As CEST effect is saturation power-dependent (17), additional powers should be tested for optimal performance.
The purpose of this study was to optimize saturation powers used with the acidoCEST-UTE MRI technique in phantoms and demonstrate feasibility of measuring in vivo pH of intra-articular structures, including cartilage and meniscus. First, multiple saturation powers between 0.54 and 1.30 µT were evaluated in fluid and tissue phantoms for both iopamidol and iohexol. Second, the powers whose RPM showed the strongest correlation coefficients between fluid, cartilage, and meniscus were selected for use in vivo.
Methods
Chemicals
Stock solutions of 972 mM iopamidol (370 mgI/mL Isovue; Bracco Imaging S.p.A, Milan, Italy) and 920 mM iohexol (350 mgI/mL Omnipaque; GE Healthcare, Chicago, IL, USA) were commercially purchased for use in this study. All other chemicals were purchased from Sigma-Aldrich (St. Louis, MO).
Phantom preparation
A set of ex vivo cartilage and meniscus samples was prepared with either iopamidol or iohexol at 200 mM concentration and phosphate-buffered saline (PBS) at 10 mM final concentration. Samples were harvested from grossly normal tissues, from two male donors aged 48 and 88. Coins of pure cartilage from osteochondral cores and menisci slices were created from various locations in the joint. Tissues were soaked in buffered contrast agent solution for 24 hours and sealed in plastic syringes prior to scanning. Solution pH values ranged between 6.19 and 7.8 and were tested before and after scanning to ensure pH stability. Phantoms were bundled in a cylindrical container, filled with Fomblin (Ausimont, Thorofare, NJ), and scanned parallel to B0 at isocenter. Phantoms were maintained at physiologic temperature (35±0.2 °C) during scanning by an MRI-compatible, regulated air heater, which was made in-house.
Human subjects
The studies were conducted under an approved Institutional Review Board protocol at the VA San Diego Healthcare System and signed, informed consent was obtained from all participants. Four male subjects (mean age 56 years, range 46–63 years) were recruited, ranging in symptoms from asymptomatic to severe, chronic knee pain. Standard, sterile techniques were employed, and for each patient a 20 gauge 1.5” needle was inserted into the knee joint through an anterior approach under fluoroscopic imaging guidance. Approximately 35 cc of contrast was injected into the joint (n=2, iopamidol 370 mgI/mL; n=2, iohexol 350 mgI/mL). After contrast injection, patients were asked to engage in light walking to encourage contrast to permeate the tissue. MR imaging was performed between 1 and 6.5 hours after injection. In two of the four subjects, contrast-agent bottles used for intra-articular injection were tested with a calibrated pH electrode (LE422, FiveEasy F20 bench meter; Mettler Toledo, Columbus, OH).
Magnetic resonance imaging
MRI scanning was performed on a 3T clinical MRI scanner (MR750, GE Healthcare, Milwaukee, WI) using an 8-channel transmit/receive knee coil. The CEST pulse sequence used in this study consists of a frequency selective Fermi saturation pulse (duration =32 milliseconds, bandwidth =40 Hz) followed by the acquisition of a 3D ultrashort echo time (UTE) cones sequence. For the ex vivo cartilage and meniscus phantom scans, the CEST imaging parameters were as follows: TR =62 ms, TE =0.032 ms, number of spokes (Nsp) =5, spoke interval (τ) =5 ms, flip angle (FA) =5°, bandwidth (BW) =166 kHz, field of view (FOV) =12×12×11.2 cm3, and matrix size =160×160×28. Z-spectra were acquired at varying saturation offset frequencies from −1,080 Hz to 1,080 Hz with 40 Hz steps using saturation pulses with B1 of 0.54, 0.65, 0.97, 1.10, and 1.30 µT (300°, 360°, 540°, 600°, and 720° respectively) as calculated by power average. The scanning time of each frequency was 1 minute and 10 seconds. For in vivo scanning, the sequence parameters were identical to the ex vivo phantom scans except for higher resolution (FOV =12×12×11.2 cm3, and matrix size =160×160×28) and resultant 2-minute scan time per frequency. CEST images were acquired at varying saturation offset frequencies from ±430 to ±670 Hz with a step size of ±40 Hz using saturation pulses with B1 of 0.54 and 1.10 µT (300° and 600°). Acquisitions were interleaved (e.g., +/− ppm and 0.54/1.10 µT powers for each offset were paired). High in-plane resolution T2-weighted images were acquired using a 3D fast-spin echo (FSE) sequence for both ex vivo and in vivo studies to enhance the contrast of tissue and improve the accuracy of drawing ROIs. A dual-echo UTE sequence with two echo times (TE1 =0.032 ms; TE2 =2.2 ms) was performed to generate a ΔB0 map, which was used for B0 correction for CEST data processing. Total in vivo scanning time was ~60 minutes.
Data processing
All data were processed in MATLAB (Mathworks, Natick, MA). All images were smoothed using a 3D Gaussian kernel with standard deviation of 0.8 to remove noise. The dual echo time method calculates the ΔB0 maps from the difference of two gradient echo-based phase images acquired at TE1 and TE2:
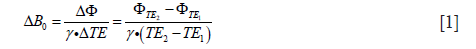
where  is the phase image acquired at echo time TEi using 3D UTE cones sequence, and γ is the gyromagnetic ratio for hydrogen, 1H.
The CEST images with different frequency offsets were interpolated using the spline method to generate images with a fine increment of 0.015 ppm. B0-corrected CEST images at ±4.2, ±4.3, or ±5.6 ppm were obtained from the interpolated CEST images by selecting signals according to the frequency shift in ΔB0 map pixel by pixel.
The magnetization transfer ratio asymmetry (MTRasym) was calculated by:
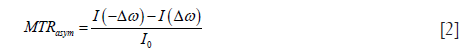
where Δω is the frequency offset of mobile protons with respect to bulk water resonance at 0 ppm. I(–Δω) and I(Δω) are the signal intensities with saturation pulse at +Δω and –Δω, respectively. I0 is the signal intensity with no saturation pulse.
RPM was determined by comparing MTRasym index which was obtained under two RF saturation power from a single labile proton group in contrast agent:
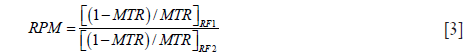
where subscript RF1 and RF2 indicate the different RF irradiation powers for MTRasym index.
ROI selection and pH calculation
MTRasym maps were created by masking for positive values (e.g., pixels where MTRasym <0 were excluded) and increasing values at higher powers (e.g., pixels where MTRasym at 0.56 µT > MTRasym at 1.10 µT were excluded) to threshold against noise. Masked MTRasym pixel maps were evaluated by a musculoskeletal radiologist and intra-articular structures and locations with maximal values (indicating greatest contrast accumulation) were noted. Thereafter, using the I0 image, a second scientist drew ROIs on these structures for pH calculation. Pixel maps of pH were generated using the equation of the line of best fit for the iopamidol and iohexol fluid and tissue phantoms. For the iopamidol phantom, the best fit line for RPM (0.56/1.10 µT) and pH yielded the equation:

where y is RPM and x is pH. For the iohexol phantom, the equation from Ma et al. (13) was used:

Statistical analysis
Statistical analyses were performed using the SPSS software package (v. 21; SPSS, Chicago, IL). The Shapiro-Wilk test was used to assess normality. Descriptive statistics were performed. Correlations between pH and RPM calculated using various powers were performed in the phantoms. Student’s t-test was performed to compare mean pH values of cartilage and menisci in vivo. A P value less than 0.05 was considered statistically significant.
Results
For the phantoms containing 200 mM iopamidol or iohexol and samples of ex vivo meniscus and cartilage, a comparison of the z-spectra (Figure 1) demonstrated that the CEST effect of these agents change as saturation power increases from 0.54 to 1.30 µT, in fluid (Figure 1A,G), meniscus (Figure 1B,H), and cartilage (Figure 1C,I). In general, MTRasym increased with increasing power for fluid, meniscus, and cartilage using either iopamidol or iohexol. RPM of iopamidol at 4.2 ppm and iohexol at 4.3 ppm was calculated for power ratios 0.54/1.10, 0.65/0.97, 0.65/1.30, and 0.97/1.30 µT, over a pH range of 6.2 to 7.8 for fluid (Figure 1D,J) as well as meniscus (Figure 1E,K) and cartilage (Figure 1F,L). In meniscus and cartilage, the RPM calculated with saturation powers of 0.54 and 1.10 µT yielded the most consistently linear relationship with pH and thus these were selected as the powers to be used in vivo. For iohexol at 4.3 ppm, R2=0.96 and 0.91 for meniscus and cartilage, respectively, and for iopamidol at 4.2 ppm, R2=0.76 and 0.75 for meniscus and cartilage, respectively.

Figure 2 demonstrates representative images from a 55-year-old man, injected with ~35 cc of undiluted iopamidol, and imaged 2-hours post injection. MTRasym could be detected in the cartilage of the medial femoral condyle at the weight-bearing aspect and anterior horn of the medial meniscus. Accumulation of the injected fluid in the suprapatellar recess is evident on the proton-density weighted image (Figure 2A). Average MTRasym of the intra-articular fluid was 0.03 at 0.54 µT (Figure 2D) and 0.08 at 1.10 µT (Figure 2G). Average RPM for the same fluid ROI (Figure 2J) was calculated to be 3.37. Using Eq. [4], this corresponds to an average pH of 7.22. The batch of iopamidol was pH tested post-injection with an electrode and confirmed as pH 7.1. The pH of each pixel in the fluid ROI is shown in Figure 2M. The anterior horn of the medial meniscus (Figure 2B) demonstrated an MTRasym value of 0.05 at 0.54 µT (Figure 2E) and 0.14 at 1.10 µT (Figure 2H). Average RPM for this meniscus ROI (Figure 2K) was 2.82, corresponding to an average pH of 6.93. The pH of each pixel in the meniscus ROI is shown in Figure 2N. An ROI over the cartilage of the medial femoral condyle (Figure 2C) had an MTRasym value of 0.03 at 0.54 µT (Figure 2F) and 0.06 at 1.10 µT (Figure 2I). Average RPM for this cartilage ROI (Figure 2L) was 2.20, corresponding to an average pH of 6.60. The pH of each pixel in the cartilage ROI is shown in Figure 2O.

Figure 3 shows representative images from a 46-year-old man injected with ~35 cc of undiluted iohexol and imaged at 1-hour post injection. MTRasym could be detected in the cartilage of the femoral trochlea and in an incidentally noted discoid lateral meniscus. Iohexol fluid accumulation is present in the suprapatellar recess (Figure 3A). This fluid MTRasym was 0.03 at 0.54 µT (Figure 3D) and 0.11 at 1.10 µT (Figure 3G). Average RPM for the same fluid ROI (Figure 3J) was 3.54. Using Eq. [5], this RPM value corresponds to an average pH of 7.65. The bottle of ioxehol used was pH tested with an electrode at pH 7.5 after injection. The pH of each pixel in the fluid ROI is shown in Figure 3M. The intact discoid lateral meniscus (Figure 3B) demonstrated an MTRasym of 0.04 at 0.54 µT (Figure 3E) and 0.09 at 1.10 µT (Figure 3H). Average RPM for the same meniscus ROI (Figure 3K) was 2.54, or pH 7.00. The pH of each pixel in the meniscus ROI is shown in Figure 3N. Femoral trochlear cartilage (Figure 3C) MTRasym was 0.03 at 0.54 µT (Figure 3F) and 0.05 at 1.10 µT (Figure 3I). Average RPM for the same cartilage ROI (Figure 3L) was 2.09, or pH 6.74. The pH of each pixel in the cartilage ROI is shown in Figure 3O.

In total, 18 ROIs were identified in cartilage and 25 ROIs were identified in meniscus on all the exams. Overall average pH values for all cartilage and meniscus ROIs for both iopamidol and iohexol are given in Table 1. Student’s t-test showed that overall mean cartilage pH was significantly lower than overall mean meniscus pH (6.60 vs. 6.72, respectively; P=0.043).

Full table
Discussion
In this study, we utilized the acidoCEST-UTE technique to measure cartilage and meniscus tissue pH. We first assessed the effect of saturation power in phantoms, ranging from 0.54 to 1.30 µT, and determined that RPM calculated from a combination of 0.54 µT (300°) and 1.1 µT (600°) yielded the strongest correlation with electrode measured pH. We also demonstrated feasibility of the technique for measuring pH in musculoskeletal tissue in vivo on a clinical 3 T scanner.
Direct intra-articular injection of iopamidol or iohexol is a safe, minimally invasive, and routinely performed procedure in clinical practice. This procedure is typically used in smaller volumes to confirm intra-articular access for steroid injections or in larger volumes (>35–50 cc) to highlight internal derangement (18). We demonstrate that sufficient contrast agent is present between 1 and 6.5 hours after administration to detect a CEST effect and measure tissue pH with the acidoCEST-UTE technique.
Compared with anionic contrast agents previously used with direct arthrography, non-ionic agents such as iopamidol and iohexol diffuse equally into normal and degenerated cartilage samples (19). This property makes iopamidol and iohexol ideal acidoCEST agents, as strong CEST effects should be able to be detected regardless of tissue integrity. The passage of non-ionic iodinated contrast into the cartilage and menisci occurs through a combination of diffusion and convection (bulk flow). Diffusion is strongly influenced by molecular size (20) and, based on this, it would be expected that iopamidol would diffuse into tissues better than iohexol (777.1 vs. 821.1 g/mol, respectively). This is supported by our results which show higher MTRasym values with iopamidol. However, diffusion/convection into intra-articular tissues such as cartilage and menisci occurs simultaneously as synovial resorption and extra-articular diffusion of contrast (20). Diffusion of contrast into the tissue may potentially be improved with increased range of motion. Entezari et al. (21) demonstrated that mechanical convection increased the contrast concentration in cartilage tissues by 71% at 30 minutes. Our results support this idea, in that the weightbearing aspects of the femoral condyles preferentially showed detectable MTRasym values. In addition, the discoid lateral meniscus in one of our patients showed diffusely increased MTRasym values (Figure 3E,H), consistent with the fact that discoid menisci are subject to greater stresses compared with regular menisci (22). Although our subjects were instructed to mobilize after injection (i.e., walk around), in the future we will recommend motions with greater range to improve mechanical convection. Higher degrees of flexion will increase the load at the posterior-most portion of the condyles as well as the patellofemoral contact. Flexion increases load transmission through the menisci to 85–90%, compared to 50–70% in extension (23).
Our results show that both cartilage and meniscus are slightly acidic. It is generally accepted that the negative fixed charge density of proteoglycans causes proton attraction, reducing extracellular pH, as evident by the acidic range of all previously reported values (<7.1) (24,25). However, there is debate as to the direction of pH change in diseased cartilage. Experiments by Gray et al. (24) strongly suggest that pH follows matrix fixed-charge density (e.g., compressive loading, which leads to greater negative fixed charge density causes an acidic shift). This would suggest that cartilage degradation, where proteoglycans are decreased, would result in a basic shift. Konttinen et al. (2), however, found that diseased cartilage is more acidic compared with more normal cartilage. We aim to clarify this in future investigations of in vivo pH measurement with the acidoCEST-UTE technique. To the best of our knowledge, pH measurements of menisci have not been previously performed. However, menisci have lower amounts of proteoglycan compared with articular hyaline cartilage (15), and based on the above results from Gray et al. (24) we would expect a higher (more basic) pH compared with cartilage, which is confirmed by our experimental results.
There are several limitations to our study. First, ours was a feasibility study with small sample size. However, in vivo assessment of tissue pH in the joint has not been performed previously. This study serves as a proof-of-concept with pilot results that are encouraging enough to continue the technique in larger sample sizes with future aims of elucidating the relationship between tissue pH and degradation or patient pain. Second, although we investigated various saturation powers, the imaging protocol remains suboptimal for clinical application. A relatively long scan time (~60 minutes) contributed to motion artifacts. Future experiments will explore opportunities for scan acceleration, including fewer acquisitions (e.g., fewer off-resonance datapoints), improvements in the UTE sequence (e.g., optimization of spokes acquired per TR), smaller scan coverage centered on the structures of interest, and implementation of advanced acceleration techniques such as compressed sensing or parallel imaging (26,27). Third, MTRasym was not able to be detected in several regions of cartilage and meniscus. Although we had an insufficient sample size for formal analysis, we subjectively noted that greater regions of tissue contrast accumulation were present in patients imaged closer to 1–2 hours after injection. As mentioned above, we also believe that increased patient range of motion after injection will improve mechanical convection and provide detectable contrast in more regions throughout the joint in future studies.
In conclusion, measuring in vivo musculoskeletal tissue such as cartilage and meniscus using acidoCEST-UTE MRI is feasible. Both iopamidol and iohexol appear to be suitable contrast agents for this purpose.
Acknowledgments
Funding: The authors gratefully acknowledge grant support from the VA Rehabilitation Research and Development Service (Merit Award I01RX002604), VA Clinical Science Research and Development Service (Merit Award I01CX001388), and NIH (1R01AR075825, 1R21AR073496, 5R01AR062581, and 1R01NS092650).
Footnote
Conflicts of Interest: The authors have no conflicts of interest to declare.
Ethical Statement: The studies were conducted under an approved Institutional Review Board protocol at the VA San Diego Healthcare System and signed, informed consent was obtained from all participants.
References
- Hunter DJ, Schofield D, Callander E. The individual and socioeconomic impact of osteoarthritis. Nat Rev Rheumatol 2014;10:437-41. [Crossref] [PubMed]
- Konttinen YT, Mandelin J, Li TF, Salo J, Lassus J, Liljeström M, Hukkanen M, Takagi M, Virtanen I, Santavirta S. Acidic cysteine endoproteinase cathepsin K in the degeneration of the superficial articular hyaline cartilage in osteoarthritis. Arthritis Rheum 2002;46:953-60. [Crossref] [PubMed]
- Razaq S, Wilkins RJ, Urban JPG. The effect of extracellular pH on matrix turnover by cells of the bovine nucleus pulposus. Eur Spine J 2003;12:341-9. [Crossref] [PubMed]
- Wilkins RJ, Hall AC. Control of matrix synthesis in isolated bovine chondrocytes by extracellular and intracellular pH. J Cell Physiol 1995;164:474-81. [Crossref] [PubMed]
- Blair HC. How the osteoclast degrades bone. BioEssays 1998;20:837-46. [Crossref] [PubMed]
- Issberner U, Reeh PW, Steen KH. Pain due to tissue acidosis: a mechanism for inflammatory and ischemic myalgia? Neurosci Lett 1996;208:191-4. [Crossref] [PubMed]
- Izumi M, Ikeuchi M, Ji Q, Tani T. Local ASIC3 modulates pain and disease progression in a rat model of osteoarthritis. J Biomed Sci 2012;19:77. [Crossref] [PubMed]
- Deval E, Lingueglia E. Acid-sensing ion channels and nociception in the peripheral and central nervous systems. Neuropharmacology 2015;94:49-57. [Crossref] [PubMed]
- Sugimura N, Ikeuchi M, Izumi M, Kawano T, Aso K, Kato T, Ushida T, Yokoyama M, Tani T. Repeated intra-articular injections of acidic saline produce long-lasting joint pain and widespread hyperalgesia. Eur J Pain 2015;19:629-38. [Crossref] [PubMed]
- Yusuf E, Kortekaas MC, Watt I, Huizinga TWJ, Kloppenburg M. Do knee abnormalities visualised on MRI explain knee pain in knee osteoarthritis? A systematic review. Ann Rheum Dis 2011;70:60-7. [Crossref] [PubMed]
- Chen LQ, Howison CM, Jeffery JJ, Robey IF, Kuo PH, Pagel MD. Evaluations of extracellular pH within in vivo tumors using acidoCEST MRI. Magn Reson Med 2014;72:1408-17. [Crossref] [PubMed]
- Ji Y, Zhou IY, Qiu B, Sun PZ. Progress toward quantitative in vivo chemical exchange saturation transfer (CEST) MRI. Isr J Chem 2017;57:809-24. [Crossref]
- Ma YJ, High RA, Tang Q, Wan L, Jerban S, Du J, Chang EY. AcidoCEST-UTE MRI for the assessment of extracellular pH of joint tissues at 3 T. Invest Radiol 2019;54:565-71. [Crossref] [PubMed]
- Jones KM, Randtke EA, Howison CM, Pagel MD. Respiration gating and Bloch fitting improve pH measurements with acidoCEST MRI in an ovarian orthotopic tumor model. Proc SPIE Int Soc Opt Eng 2016;9788:1-15.
- Chang EY, Du J, Chung CB. UTE imaging in the musculoskeletal system. J Magn Reson Imaging. 2015;41:870-883. [Crossref] [PubMed]
- Chen L, Wei Z, Chan KWY, Cai S, Liu G, Lu H, Wong PC, van Zijl PCM, Li T, Xu J. Protein aggregation linked to Alzheimer’s disease revealed by saturation transfer MRI. Neuroimage 2019;188:380-90. [Crossref] [PubMed]
- Moon BF, Jones KM, Chen LQ, Liu P, Randtke EA, Howison CM, Pagel MD. A comparison of iopromide and iopamidol, two acidoCEST MRI contrast media that measure tumor extracellular pH. Contrast Media Mol Imaging 2015;10:446-55. [Crossref] [PubMed]
- Kalke RJ, Di Primio GA, Schweitzer ME. MR. Semin Musculoskelet Radiol 2012;16:57-68. [Crossref] [PubMed]
- Yoo HJ, Hong SH, Choi JY, Lee IJ, Kim SJ, Choi JA, Kang HS. Contrast-enhanced CT of articular cartilage: experimental study for quantification of glycosaminoglycan content in articular cartilage. Radiology 2011;261:805-12. [Crossref] [PubMed]
- Silvast TS, Kokkonen HT, Jurvelin JS, Quinn TM, Nieminen MT, Töyräs J. Diffusion and near-equilibrium distribution of MRI and CT contrast agents in articular cartilage. Phys Med Biol 2009;54:6823-36. [Crossref] [PubMed]
- Entezari V, Bansal PN, Stewart RC, Lakin BA, Grinstaff MW, Snyder BD. Effect of mechanical convection on the partitioning of an anionic iodinated contrast agent in intact patellar cartilage. J Orthop Res 2014;32:1333-40. [Crossref] [PubMed]
- Woods GW, Whelan JM. Discoid meniscus. Clin Sports Med 1990;9:695-706. [PubMed]
- Fox AJS, Bedi A, Rodeo SA. The basic science of human knee menisci: structure, composition, and function. Sports Health 2012;4:340-51. [Crossref] [PubMed]
- Gray ML, Pizzanelli AM, Grodzinsky AJ, Lee RC. Mechanical and physicochemical determinants of the chondrocyte biosynthetic response. J Orthop Res 1988;6:777-92. [Crossref] [PubMed]
- Grodzinsky AJ. Electromechanical and physicochemical properties of connective tissue. Crit Rev Biomed Eng 1983;9:133-99. [PubMed]
- Heo HY, Zhang Y, Lee DH, Jiang S, Zhao X, Zhou J. Accelerating chemical exchange saturation transfer (CEST) MRI by combining compressed sensing and sensitivity encoding techniques. Magn Reson Med 2017;77:779-86. [Crossref] [PubMed]
- She H, Greer JS, Zhang S, Li B, Keupp J, Madhuranthakam AJ, Dimitrov IE, Lenkinski RE, Vinogradov E. Accelerating chemical exchange saturation transfer MRI with parallel blind compressed sensing. Magn Reson Med 2019;81:504-13. [Crossref] [PubMed]

