

Early prediction of acute xerostomia during radiation therapy for nasopharyngeal cancer based on delta radiomics from CT images
Introduction
Permanent xerostomia is one of the most common side effect of radiation therapy (RT) toxicity for head and neck (H&N) malignancies (1). It is considered as a significant cause of decreased quality of life (QOL) in patients (2,3), by introducing swallowing and chewing hypofunction (4), disturbing speech, taste, and even sleep patterns (5). Xerostomia grade (XG) is commonly scoring via five level scales from Grade 0 to 4 (G0-G4) according to the Radiation Therapy Oncology Group (RTOG) radiation morbidity scoring criteria (3). Recent literatures manifested employing computed tomography (CT) images to predict the dry mouth symptoms of patients with H&N cancer after receiving radiotherapy (6,7). There are two major concerns in such scoring system: (I) inadequate objectiveness and (II) insufficient quantitative description. Most studies measured and graded using subjective and qualitative observer-rated toxicity grading (3), rather than the measurements of major salivary gland output or saliva amount (SA) for description. The separation between the different grades is ambiguous to some extent in the current toxicity grading systems, which also induced the difficulty of non-subjective description.
Quantitatively and accurately predicting SA will facilitate clinical decision-making to prevent xerostomia, while radiomics can aid diagnosis by analyzing medical images (8). Radiomics uses automatic algorithm to extract a large number of feature information from the region of interest (ROI) of medical images as the research object, and further used diversified statistical analysis and data mining methods to extract and reveal the key information that really plays a role in the immense amount of information. Finally, these features were used in the auxiliary diagnosis, classification or grading of diseases (9,10). The specific steps can be divided into image collection, ROI segmentation, feature extraction, statistical analysis and classification prediction (11).
Accurate toxicity prediction could assist clinical decision-making for planning personalized treatment. Recently, some studies had reported the use of radiomics features extracted from medical images [CT (7,12,13), MR (14,15), PET (16,17) and CBCT (18,19)] to improve the prediction models of side effect treatment. The rate of CBCT-measured parotid glands (PGs) image feature changes improved the prediction concerning the dose alone for chronic xerostomia prediction (18). Analysis of CBCT images acquired for treatment positioning might provide an inexpensive monitoring system to support toxicity reducing adaptive RT. Xu et al. (20) recognized that the CT number changes in parotids were measurable during the delivery of fractionated radiotherapy for NPC. Feng et al. (21) revealed that the CT number could be reduced in tumor and PGs during the course of RT. There was a fair correlation between CT number reduction and radiation doses for a part of patients, whereas the correlation between CT number reductions and volume reductions in GTV and PGs was weak. Recently, Wu et al. (6) pointed out that the significant changes in the CT histogram features of the PGs were observed during RT. And a practical method that used the changes of mean CT number and volume of PGs was proposed to predict radiation-induced acute xerostomia in multiple institutions. This method might be helpful for designing adaptive treatment or personalized treatment, such as the submandibular glands transfer prior to RT (22) or the concomitant administration of pilocarpine during radiation increases unstimulated saliva flow rate and reduces clinician-rated XG (23).
We noticed that all the previous work graded the xerostomia either by patients themselves or by physicians, rather than an objective reported as an main end points (24). In this study, a new SA prediction system was proposed based primarily on the changes of radiomics from CT images for patients with nasopharyngeal cancer (NPC) during radiotherapy, combined with SA and associated with xerostomia. As far as to our knowledge, this is the very first paper to quantitatively predict patients’ SA.
Methods
This article predicted the probability and extent of the patient’s future acute xerostomia by predicting the prospective SA of patient. The SA prediction model consists of five parts as shown in Figure 1: (I) data generation; (II) data preprocessing; (III) feature score calculation; (IV) feature selection; and (V) SA prediction.

The data generation (Figure 1A) was described in Patient data. Data preprocessing elucidated the content of Figure 1B. Xerostomia prediction model explained in detail in three sub-sections: (I) the feature score calculation (Figure 1C); (II) feature selection (Figure 1D); and (III) SA prediction (Figure 1E).
CT simulator protocols
The CT simulator in our department, a Brilliance Big Bore CT scanner (Philips Medical Systems, Cleveland, OH, USA), had monthly/quarterly/yearly QA/QC based on the American College of Radiology (ACR) CT accreditation phantom before scanning the patients. And this CT simulator images showed that image quality was within ACR guidelines for all tested scanning protocols.
A pre-defined set of scan protocol was performed on NPC patients using the CT simulator and the image data were reconstructed with a 3 mm thickness. These images were generated by using the more common clinical protocol of 3 mm slices at 3 mm increments with the scanning protocols most commonly used in clinical practice. The detailed parameters for these protocols were given as following: voltage 120 kVp, exposure 300 mAs, slice thickness 3 mm, increment 3 mm, collimation 16 mm × 0.75 mm, display FOV 600 mm, scan FOV 600 mm, reconstruction filter type UB/B, and pitch 0.567.
Patient data
CT images were retrieved to predict the dry mouth symptoms of patients with NPC after receiving radiotherapy. CT and true SA data were collected from 35 NPC patients at the Sun Yat-sen University Cancer Center (SYSUCC), Guangzhou, China. All the data were retrospectively analyzed. The patients with stages I–IVB, were randomly chosen from the control group in the NPC clinical trial, which was registered on the clinicaltrials.gov (ID: NCT01762514). The study was approved by the institutional review board and the ethical review office from the institution, and the data had been submitted to a public Research Data Deposit platform (www.researchdata.org.cn), with an approval RDD number as RDDB2018000256. The 35 patients were used as training and validation sets, and 4 more patients were used as the independent test set.
All patients received radical treatment based on intensity-modulated RT (IMRT) with a prescription dose of 68.1 Gy in 30 fractions. The patients’ ages ranged 24–72 years, and each patient had five CT sets acquired using a CT simulator (CT Big Bore; Philips) at treatment position at 0th, 10th, 20th, 30th fractions during RT and 3-month later after the RT. The PGs were delineated on each CT set by a radiation oncologist and verified independently by another. Acute xerostomia was evaluated based on RTOG acute toxicity scoring (3) and all the patients were evaluated in those XG every other ten days by the attending physician based on patients reporting as follows: (I) G0: no change over baseline; (II) G1: mild mouth dryness/slightly thickened saliva/may have slightly altered taste such as metallic taste; (III) G2: moderate to complete dryness/thick, sticky saliva/markedly altered taste (i.e., copious water or other lubricants); (IV) G3: severe dry mouth, no stimulation, often need to wake up at night to drink water; and (V) G4: acute salivary gland necrosis.
Patients saliva were collected every other 10 days during RT. Measurement of saliva output is the most commonly applied objective evaluation of xerostomia. Previous literature (25) comprehensively explored on how to collect saliva. The un-stimulated saliva was collected, which represents the saliva output of the whole-mouth saliva. Saliva collection was performed over a period of 5 minutes at the 0th, 10th, 20th, 30th fractions during RT and at 3-month later after RT. Collection of the whole saliva was performed by drainage and measured via a medical cylinder. All the SA and its changes were documented.
The 0th fraction (0F) CT images and SA0F were used as the baseline to predict the SA10F in this paper. The result was recorded as PSA10F (predicted SA at 10th fraction). Furthermore, 0F CT images, 10F CT images, SA0F, SA10F, and the corresponding changes were used together to predict PSA30F. The probability and extent of the patient’s future acute xerostomia were evaluated according to the PSA. Patient characteristics along with other data were summarized in Table 1.

Full table
Data preprocessing
The PGs of 35 patients were delineated on each CT set by a radiation oncologist and verified independently by another one. More than 5,000 radiomics features were obtained from each annotated CT (Figure 1A) using 3D Slicer (26-28). 3D Slicer has an extension module called Radiomics which provides an interface to the PyRadiomics library (https://github.com/Radiomics/pyradiomics). PyRadiomics is an open-source python package for extracting Radiomics features from medical imaging. Current possible image types for PyRadiomics are Original, Wavelet, LoG, Square, SquareRoot, Logarithm, Exponential, Gradient, LBP2D and LBP3D. In this article, Original (no filter applied) and Wavelet (wavelet filtering, yields 8 decompositions per level, and all possible combinations of applying either a High or a Low pass filter in each of the three dimensions), two types of image were utilized. Various features can be extracted by PyRadiomics. They can be divided into seven categories: First Order, Shape, Gray Level Co-occurrence Matrix (GLCM), Gray Level Run Length Matrix (GLRLM), Gray Level Size Zone Matrix (GLSZM), Neighbouring Gray Tone Difference Matrix (NGTDM) and Gray Level Dependence Matrix (GLDM). All the mentioned features categories were employed in our method.
In all, 1,703 feature values (FVs) were extracted from radiomics features for each CT set by data cleaning, which includes checking data consistency, handling invalid values and missing values. In addition, we performed data augmentation through the normalization process (29) and the differences between those FVs (Figure 1B).
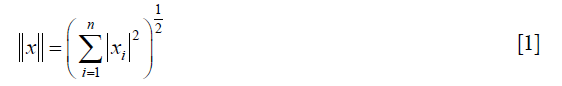
In this paper, the FVs at 0th fraction (include SA0F), named FV0F, were employed to predict the SA at 10th fraction (PSA10F). FV0F, FV10F and delta radiomics FVs named as delta FV (ΔFV10F-0F) were also used to predict PSA30F. Besides the original data set, L2-norm normalization was performed on FV0F and FV10F, to ensure all the features were on the same order of magnitude. Formally, given one feature x={x1, x2,., xn} where n represents the number of patients, the L2-norm  is formulated as:
And the normalization formula is deduced as:
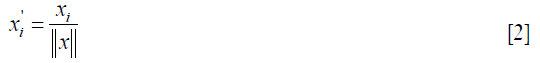
where  is the normalized feature value (NFV) or normalized SA (NSA).
Besides normalization, the feature difference was added between FV10F and FV0F (ΔFV10F-0F) to the data set, while the ΔFV10F-0F was normalized to obtain the ΔNFV10F-0F. The difference feature was also considered as a kind of feature. ΔNFV10F-0F was added to the data set to verify the effect of feature changes on predicting patients’ future SA, which can further determine whether the prediction ability of the difference feature was stronger than the ordinary ones or not.
Xerostomia prediction model
After the data preprocessing, the FVs and SA labels were used to calculate the feature scores (Figure 1C) by specified functions. Then K features were filtered out based on the scores ranking (Figure 1D). Finally, the selected features were applied to predict the SA (Figure 1E) by prediction functions. The functions were shown in Table 2. The first column was nine score calculation functions, which match with 2 feature selection functions placed in the second column. The third column contained eight SA prediction functions. We tried the various combination of machine learning techniques to determine the best method to predict SA efficiently and accurately.

Full table
Feature score calculation
After the data were preprocessed, nine score calculation functions were used to generate the feature scores, as following:
- f_regression: this is a univariate linear regression test (30), which is used in feature selection procedure, the formula for calculating the f value is shown as follows:
- mutual_info_regression: this function is able to estimate the mutual information I(X,Y) (31,32) of two target variables, which can measure the dependency between two samples. The formula is defined as:
- DecisionTreeRegressor: decision tree regressor is an unsupervised regression method, and it learns simple decision rules from features to predict the target variable (33-35).
- RandomForestRegressor (36): in the integrated model of the random forest, the samples of each tree are constructed from the training set after the put-back sampling. In addition, the selected segmentation point is not the best segmentation point for all features, but the best segmentation point in a random subset of features (37).
- ExtraTreesRegressor: in the extra tree, the randomness in the method of calculating the segmentation point is further enhanced. Instead of finding the most discriminating threshold, the threshold here is randomly generated for each candidate feature, and selecting the best one of these thresholds as the segmentation rule (37,38).
- LinearRegression: this function is a least squares linear regression (36,39), which minimizes the residual sum of squares between X and Y by fitting a linear model with the coefficient w = (w1, w2, …, wp):
- Ridge: ridge regression solves the problem of ordinary least squares by imposing punishment on the size of the coefficient (40), which minimizes the residual sum of squared with penalty:
- RidgeCV: RidgeCV implements Ridge regression with cross-validation (CV) of built-in Alpha parameters (40).
- Lasso: this function is a linear model for estimating sparse coefficients. It tends to use fewer variables or parameters, which can effectively reduce the number of variables that the given solution depends on (40,42). Its minimized objective function is as follows:
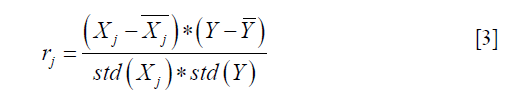
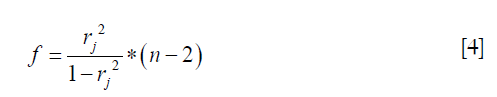
where Xj represents the vector of all patients on the feature of j, Y is the vector of SA label. And std() indicates standard deviation function. rj is the sample correlation coefficient. Hence, the larger the f value, the greater the correlation between the j-feature and the dependent variable Y.
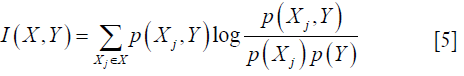
where X={X1, X2,., Xm} is the set of all features and m represents the number of features, p(Xj, Y) is joint probability distribution function of Xj and Y. And p(Xj) and p(Y) are marginal probability function. Higher I(X,Y) implies higher dependency between two variables.
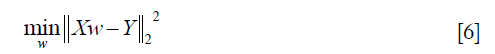
However, this method relies on the mutual independence of the model terms. The least squares estimate will be very sensitive to random errors and produce a large variance when the columns (features) of X are approximately linearly dependent and terms are correlated (40).
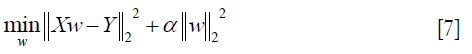
where α ≥0, and the larger the α, the greater the shrinkage and the stronger the robustness of the coefficient w to the collinearity (41).
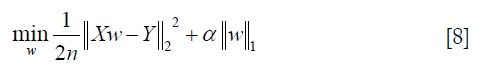
where α is a constant, n is the number of samples and  is the ℓ1-norm of the parameter vector.
Feature selection
The score calculation function (Figure 1C) needs to combine with the feature selection function (Figure 1D) to filter out the features. This paper employed the SelectKBest and recursive feature elimination (RFE) (43) to select the features (Table 2).
- SelectKBest is able to remove all features except the K features with the highest score, and the retained features are the target features, where the K value can be customized.
- RFE selects the specified number K of features by recursively considering smaller and smaller sets of features.
SA prediction
The features, filtered by feature selection, were used to predict the SA (Figure 1E). Eight prediction functions were used, and most of them were the same as the score calculation function, except for the support vector regression (SVR) (40) (in Table 2 column 3). The output of this step was the predicted value of the SA (PSA), which could be used as a predictor of the acute xerostomia.
Results
Model selection
Various feature selection and SA prediction function combinations could be considered. There were nine score calculation functions (in Table 2 column 1) and two feature selection functions (in Table 2 column 2), which could produce nine combinations for selecting features. And there were also eight methods for SA prediction (in Table 2 column 3). Therefore, a total 72 combinations of feature selection and SA prediction function were tested in all (Table 2). Besides, the experimental data can be preprocessed by various ways, such as whether to normalize, whether to take the difference. Here we considered total 24 forms (Table 3). Therefore, the best model and data preprocessing method were finally chosen based on the experimental results.

Full table
We designed a set of experiments according to the input data form (as shown in Table 3) and the functions (as shown in Table 2) to predict SA. The number of selected feature quantity K, which was difficult to be set at very beginning, could be determined by experiments. And range of candidate K was from 1 to 16. And the CV coefficient of the prediction function was initialized to 3.
The training stage was composed of three parts: score calculation, feature selection and SA prediction. It was worth noting that all the 35 patients’ data were used in score calculation and feature selection stage, while the CV technique mentioned was only used for SA prediction function in training stage.
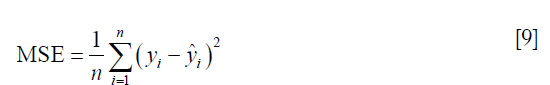
The optimal result for PSA10F and PSA30F is shown in Table 4. The model is evaluated by MSE (mean square error) (39), which is shown as follows:

Full table
where n is the number of samples, yi is the SA true value of the ith patient, and  is predictive value. Reference MSE (R_MSE) is defined as
 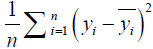 . Hence, the smaller the MSE, the more accurate the prediction.
Experimental results showed that the best prediction model for PSA10F was RidgeCV_RFE_LinearRegression. Experimental results also showed that the best two prediction models for PSA30F was RidgeCV_RFE_LinearRegression with {NFV0F, NFV10F, ΔNFV10F-0F} datasets and LinearRegression_RFE_LinearRegression with NFV10F-0F datasets, respectively. They had the similar MSE as shown in Table 4 (0.0801 vs. 0.0754).
In order to determine the final model of predicting PSA30F, the pros and cons of the methods for PSA30F in Table 4 rows 2 and 3 were further discussed by changing the CV coefficient, and the result was shown in Table 5.

Full table
Table 5 shows that as the CV of the prediction function increases, the advantages of using {NFV0F, NFV10F, ΔNFV10F-0F} datasets with RidgeCV to calculate feature scores become apparent. Hence, the best predictive model of PSA30F was RidgeCV_RFE_LinearRegression with {NFV0F, NFV10F, ΔNFV10F-0F} datasets.
A large number of experiments demonstrated that NFV prediction results were better than FV, the FV results were not given in the paper. For detailed experimental results, please refer to Table S1.

Full table
We also did a related experiment to predict NSA (PNSA10F and PNSA30F), however, because predicting PSA is more in line with clinical needs, Table 4 focuses on the result of PSA. The best predictions for PNSA10F and PNSA30F were detailed in Table S1.
SA prediction
Predicting PSA10F
We used RidgeCV_RFE_LinearRegression model with NFV0F datasets and SA0F to predict PSA10F. The experimental result with K=8 gave the best result (the smallest MSE of 0.9042). However, prediction results between K=6 (Table S1, an MSE of 0.9548) and K=8 were close, which K=6 had fewer features. Therefore, both sets of features could be considered. In this paper, the eight features and their weights were given in Table 6. Please note that the “h” means High-pass filter and the “l” means Low-pass filter in “hhl” or “lhh” of the feature names, and the last “r” means Right and the last “l” means Left. Ranking indicated the sequential order of the features’ selection. The features were selected by score calculation and feature selection, and the weights were yielded in SA prediction stage by specific function based on the data from all 35 patients. The related weights of the six features were given in Table S2.

Full table

Full table
Predicting SA10F with the LinearRegression function, MSE was 0.9042 and R2 score was 0.7406 in the verification phase while CV was 3 (Table 4). The R2 score is shown as:
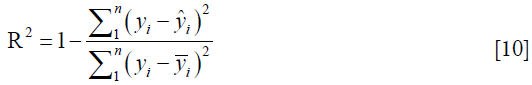
where  is mean SA. The denominator is the true data dispersion degree, and the numerator is the prediction error. The division of the two intends to eliminate the influence of the true data dispersion degree. When the R2 is higher, the model fits the data better.
Figure 2 shows the prediction results of SA10F.White histogram and green solid line represented the predicted result, black histogram and red dash line were the distribution of true SA and gray part indicated the overlap between reality and prediction. The x-axis represented the SA, and the left y-axis represented probability for the histogram, while the right y-axis represented density for the fitting curve. The histogram showed the distribution of SA and the fitting curve was kernel density estimation, which gave the distribution of the data more explicitly. The true and corresponding predicted values of PSA10F were given in Table 7, and the P value between SA10F and PSA10F was 0.9888.


Full table
Predicting PSA30F
The RidgeCV_RFE_LinearRegression model with {NFV0F, NFV10F, ΔNFV10F-0F} datasets were applied to predict PSA30F, K=14 was selected by experiment result. The weights of the fourteen features were given in Table 8.

Full table
LinearRegression function with 35 CV (leave one out protocol) was utilized to get the best prediction results for PSA30F in the verification phase. The best MSE was 0.0569 and R2 score was 0.9220. The results showed that the error was small enough by using the above 14 features to predict PSA30F, while the model fitted the data well. Please note that ten delta radiomics features out of the fourteen features played an important role in the PSA30F.
Figure 3 showed the prediction results of PSA30F. The prediction curve was basically consistent with the true curve. The specific values of PSA30F were also given in Table 7, and the P value between SA30F and PSA30F was 0.8845.

Independent testing
In general, our model tried to predict the SA based on specific features (8 features in Table 6 for PSA10F, 14 features in Table 8 for PSA30F) and the LinearRegression was used as the SA prediction function. In order to prove the model and the selected features were also applicable to other datasets, four unseen patients were used for testing. The Table 9 showed that the PSA10F (Table 9 column 4) were not close to the true value (Table 9 column 3), while PSA30F were accurate enough with the true value (Table 9 column 6). The MSE of PSA30F was 0.0233 and R2 score was 0.8680. The reason might be that most of the selected features (10 out of 14) used for predicting SA30F were delta radiomics, which can effectively represent features’ changes during RT.

Full table
Discussion
Predicting acute xerostomia through the changes in the PGs had been proposed in previous literatures. However, most of the studies focused on merely a few common features [e.g., volume and Hounsfield units (HU) (6)], which could not comprehensively extract and analyze such large number of features for PGs. In this paper, the method was implemented by using radiomics and delta radiomics. It can be divided into following stages: image collection, ROI segmentation, feature extraction, statistical analysis, classification and prediction. It showed that radiomics can automatically extract a large number of features from the ROI of medical images, and identifies key features based on statistical analysis. Finally, these features were applied in the auxiliary diagnosis and treatment through detailed analysis (8,9,11).
This article quantified the SA by systematically analyzing a large number of features extracted from the PGs to achieve predicting acute xerostomia. Finally, eight (Table 6) and fourteen (Table 8) features to applied to predict SA10F and SA30F, and the precision were 0.7406 and 0.9220, respectively. The sensitivity reached 100% because every patient received a PSA. On the other hand, the P values for the 10F and 30F were both greater than 0.05 (0.9888 and 0.8845), which indicated no significant statistical difference between the true and the prediction values, and the experimental results expressed clinical significance.
We noted that delta radiomics (ΔFV10F-0F) held a larger proportion (10/14) when predicting SA30F. It indicated that the variation of features contributed significantly to the quantitative prediction of SA. However, volume and HU, which played an important role in other studies (6), were not selected out in this article. We speculated the reason was that the wavelet features had a large ratio in all the features exacted in our study. Radiomics data contain first-, second-, and higher-order statistics, and the high-order features might overcome the low-order (first-order) grey features in this PGs study.
Moreover, our prediction accuracy for SA30F at the 10th of RT reached 0.9220, in other words, the system could accurately predict the acute xerostomia of patients after 30th fractions of RT as soon as possible, which was a key step for early xerostomia prediction.
Conclusions
We observed and quantified the radiomics changes in the PGs during the fractionated RT for NPC to predict SA10F and SA30F. The RidgeCV was used to calculate the features score, RFE was used to select feature, and Linear Regression was used to predict SA both at 10F and 30F. The optimal result of PSA10F was achieved using 8 features (Table 6) with an MSE of 0.9042 and R2 score of 0.7406. Meanwhile 14 features (Table 8) performed the best at PSA30F with an MSE of 0.0569 and R2 score of 0.9220. This result indicated that the proposed method was able to accurately predict patients’ SA at early stage and prevent the xerostomia symptom in advance.
In this paper, only the un-stimulated SA was used to build the model, and the stimulated saliva data can be added into the model to increase the robustness of the method in the following work. In addition, how to accurately predict the late xerostomia for the patients after RT is still a difficult problem. We would work on it in the near future, since the PGs surface/volume reduction might be associated with late xerostomia. The early post treatment model with delta PG-surface and acute xerostomia scores can be considered as a surrogate marker for late xerostomia (44). What is more, we will increase training data and test data gradually and further improve the model to improve the accuracy of SA prediction. Other diseases could also benefit from this model with moderate adjustment.
Acknowledgments
Discussions and inputs from Dr. Allen Li and Dr. Yalan Tao are greatly appreciated. The authors would like to thank the anonymous reviewers, and the guest editor for their constructive comments and suggestions, which greatly improved the quality of the manuscript.
Funding: This research received the support from Natural Science Foundation of Guangdong Province (No. 2017A030310217); Pearl River S&T Nova Program of Guangzhou (No. 201710010162).
Footnote
Conflicts of Interest: The authors have no conflicts of interest to declare.
Ethical Statement: The study was approved by the institutional review board and the ethical review office from the institution, and the data had been submitted to a public Research Data Deposit platform (www.researchdata.org.cn), with an approval RDD number as RDDB2018000256. Written informed consent was obtained from all individual participants involved in this trial, which was registered on the clinicaltrials.gov (ID: NCT01762514).
References
- Tribius S, Sommer J, Prosch C, Bajrovic A, Muenscher A, Blessmann M, Kruell A, Petersen C, Todorovic M, Tennstedt P. Xerostomia after radiotherapy. Strahlenther Onkol 2013;189:216-22. [Crossref] [PubMed]
- Bjordal K, Kaasa S, Mastekaasa A. Quality of life in patients treated for head and neck cancer: A follow-up study 7 to 11 years after radiotherapy. Int J Radiat Oncol Biol Phys 1994;28:847-56. [Crossref] [PubMed]
- Cox JD, Stetz J, Pajak TF. Toxicity criteria of the Radiation Therapy Oncology Group (RTOG) and the European organization for research and treatment of cancer (EORTC). Int J Radiat Oncol Biol Phys 1995;31:1341-6. [Crossref] [PubMed]
- Vissink A, Mitchell JB, Baum BJ, Limesand KH, Jensen SB, Fox PC, Elting LS, Langendijk JA, Coppes RP, Reyland ME. Clinical Management of Salivary Gland Hypofunction and Xerostomia in Head-and-Neck Cancer Patients: Successes and Barriers. Int J Radiat Oncol Biol Phys 2010;78:983-91. [Crossref] [PubMed]
- Vissink A, van Luijk P, Langendijk J, Coppes R. Current ideas to reduce or salvage radiation damage to salivary glands. Oral Diseases 2015;21:e1-10. [Crossref] [PubMed]
- Wu H, Chen X, Yang X, Tao Y, Xia Y, Deng X, Zheng C, Robbins J, Schultz C, Li XA. Early Prediction of Acute Xerostomia During Radiation Therapy for Head and Neck Cancer Based on Texture Analysis of Daily CT. Int J Radiat Oncol Biol Phys 2018;102:1308-18. [Crossref] [PubMed]
- van Dijk LV, Brouwer CL, van der Schaaf A, Burgerhof JGM, Beukinga RJ, Langendijk JA, Sijtsema NM, Steenbakkers RJHM. CT image biomarkers to improve patient-specific prediction of radiation-induced xerostomia and sticky saliva. Radiother Oncol 2017;122:185-91. [Crossref] [PubMed]
- Aerts HJ, Velazquez ER, Leijenaar RT, Parmar C, Grossmann P, Carvalho S, Bussink J, Monshouwer R, Haibe-Kains B, Rietveld D, Hoebers F, Rietbergen MM, Leemans CR, Dekker A, Quackenbush J, Gillies RJ, Lambin P. Decoding tumour phenotype by noninvasive imaging using a quantitative radiomics approach. Nat Commun 2014;5:4006. [Crossref] [PubMed]
- Gillies RJ, Kinahan PE, Hricak H. Radiomics: Images Are More than Pictures, They Are Data. Radiology 2016;278:563-77. [Crossref] [PubMed]
- Kumar V, Gu Y, Basu S, Berglund A, Eschrich SA, Schabath MB, Forster K, Aerts HJ, Dekker A, Fenstermacher D, Goldgof DB, Hall LO, Lambin P, Balagurunathan Y, Gatenby RA, Gillies RJ. Radiomics: the process and the challenges. Magn Reson Imaging 2012;30:1234-48. [Crossref] [PubMed]
- Lambin P, Rios-Velazquez E, Leijenaar R, Carvalho S, van Stiphout RG, Granton P, Zegers CM, Gillies R, Boellard R, Dekker A, Aerts HJ. Radiomics: extracting more information from medical images using advanced feature analysis. Eur J Cancer 2012;48:441-6. [Crossref] [PubMed]
- Pota M, Scalco E, Sanguineti G, Farneti A, Cattaneo GM, Rizzo G, Esposito M. Early prediction of radiotherapy-induced parotid shrinkage and toxicity based on CT radiomics and fuzzy classification. Artif Intell Med 2017;81:41-53. [Crossref] [PubMed]
- Chen X, Oshima K, Schott D, Wu H, Hall W, Song Y, Tao Y, Li D, Zheng C, Knechtges P, Erickson B, Li XA. Assessment of treatment response during chemoradiation therapy for pancreatic cancer based on quantitative radiomic analysis of daily CTs: An exploratory study. PLoS One 2017;12:e0178961. [Crossref] [PubMed]
- Abdollahi H, Mahdavi SR, Mofid B, Bakhshandeh M, Razzaghdoust A, Saadipoor A, Tanha K. Rectal wall MRI radiomics in prostate cancer patients: prediction of and correlation with early rectal toxicity. Int J Radiat Biol 2018;94:829-37. [Crossref] [PubMed]
- Zhang Z, Yang J, Ho A, Jiang W, Logan J, Wang X, Brown PD, McGovern SL, Guha-Thakurta N, Ferguson SD, Fave X, Zhang L, Mackin D, Court LE, Li J. A predictive model for distinguishing radiation necrosis from tumour progression after gamma knife radiosurgery based on radiomic features from MR images. Eur Radiol 2018;28:2255-63. [Crossref] [PubMed]
- Zhu T, Das S, Wong TZ. Integration of PET/MR Hybrid Imaging into Radiation Therapy Treatment. Magn Reson Imaging Clin N Am 2017;25:377-430. [Crossref] [PubMed]
- Liao KY, Chiu CC, Chiang WC, Chiou YR, Zhang G, Yang SN, Huang TC. Radiomics features analysis of PET images in oropharyngeal and hypopharyngeal cancer. Medicine (Baltimore) 2019;98:e15446. [Crossref] [PubMed]
- Rosen BS, Hawkins PG, Polan DF, Balter JM, Brock KK, Kamp JD, Lockhart CM, Eisbruch A, Mierzwa ML, Ten Haken RK, El Naqa I. Early Changes in Serial CBCT-Measured Parotid Gland Biomarkers Predict Chronic Xerostomia After Head and Neck Radiation Therapy. Int J Radiat Oncol Biol Phys 2018;102:1319-29. [Crossref] [PubMed]
- van Timmeren JE, Leijenaar RTH, van Elmpt W, Reymen B, Lambin P. Feature selection methodology for longitudinal cone-beam CT radiomics. Acta Oncologica 2017;56:1537-43. [Crossref] [PubMed]
- Xu S, Wu Z, Yang C, Ma L, Qu B, Chen G, Yao W, Wang S, Liu Y, Li XA. Radiation-induced CT number changes in GTV and parotid glands during the course of radiation therapy for nasopharyngeal cancer. Br J Radiol 2016;89:20140819. [Crossref] [PubMed]
- Feng M, Yang C, Chen X, Xu S, Moraru I, Lang J, Schultz C, Li XA. Computed Tomography Number Changes Observed During Computed Tomography–Guided Radiation Therapy for Head and Neck Cancer. Int J Radiat Oncol Biol Phys 2015;91:1041-7. [Crossref] [PubMed]
- Jha N, Harris J, Seikaly H, Jacobs JR, McEwan AJB, Robbins KT, Grecula J, Sharma AK, Ang KK. A Phase II Study of Submandibular Gland Transfer Prior to Radiation for Prevention of Radiation-induced Xerostomia in Head-and-Neck Cancer (RTOG 0244). Int J Radiat Oncol Biol Phys 2012;84:437-42. [Crossref] [PubMed]
- Yang WF, Liao GQ, Hakim SG, Ouyang DQ, Ringash J, Su YX. Is Pilocarpine Effective in Preventing Radiation-Induced Xerostomia? A Systematic Review and Meta-analysis. Int J Radiat Oncol Biol Phys 2016;94:503-11. [Crossref] [PubMed]
- Meirovitz A, Murdoch-Kinch CA, Schipper M, Pan C, Eisbruch A. Grading xerostomia by physicians or by patients after intensity-modulated radiotherapy of head-and-neck cancer. Int J Radiat Oncol Biol Phys 2006;66:445-53. [Crossref] [PubMed]
- Navazesh M. Methods for Collecting Saliva. Ann N Y Acad Sci 1993;694:72-7. [Crossref] [PubMed]
- Pieper S, Halle M, Kikinis R. editors. 3D Slicer. 2004 2nd IEEE International Symposium on Biomedical Imaging: Nano to Macro (IEEE Cat No. 04EX821); 2004 18-18 April 2004.
- Fedorov A, Beichel R, Kalpathy-Cramer J, Finet J, Fillion-Robin JC, Pujol S, Bauer C, Jennings D, Fennessy F, Sonka M, Buatti J, Aylward S, Miller JV, Pieper S, Kikinis R. 3D Slicer as an image computing platform for the Quantitative Imaging Network. Magn Reson Imaging 2012;30:1323-41. [Crossref] [PubMed]
- Pinter C, Lasso A, Wang A, Jaffray D, Fichtinger G., Slicer RT. Radiation therapy research toolkit for 3D Slicer. Med Phys 2012;39:6332-8. [Crossref] [PubMed]
- Aksoy S, Haralick RM. Feature normalization and likelihood-based similarity measures for image retrieval. Pattern Recognit Lett 2001;22:563-82. [Crossref]
- Hazelton ML. Univariate Linear Regression. International Encyclopedia of Education 2010:482-8.
- Huang J, Cai Y, Xu X. editors. A Filter Approach to Feature Selection Based on Mutual Information. IEEE International Conference on Cognitive Informatics; 2007.
- Nagpal A, Gaur D, Gaur S. editors. Feature selection using mutual information for high- dimensional data sets. IEEE International Advance Computing Conference; 2014.
- Fredman ML. editor. On the decision tree complexity of the shortest path problems. Symposium on Foundations of Computer Science; 1975.
- Cervantes B, Monroy R, Medina-Pérez MA, Gonzalez-Mendoza M, Ramirez-Marquez J. Some features speak loud, but together they all speak louder: A study on the correlation between classification error and feature usage in decision-tree classification ensembles. Eng Appl Artif Intell 2018;67:270-82. [Crossref]
- Shah N, Ziauddin S, Shahid AR. editors. Brain tumor segmentation and classification using cascaded random decision forests. International Conference on Electrical Engineering/electronics; 2017.
- Grömping U. Variable Importance Assessment in Regression: Linear Regression versus Random Forest. Am Stat 2009;63:308-19. [Crossref]
- Mishra G, Sehgal D, Valadi JK. Quantitative Structure Activity Relationship study of the Anti-Hepatitis Peptides employing Random Forests and Extra-trees regressors. Bioinformation 2017;13:60-2. [Crossref] [PubMed]
- Pisane J, Maree R, Ries P, Wehenkel L, Verly JG. editors. An extra-trees-based automatic target recognition algorithm. International Radar Conference-surveillance for A Safer World; 2009.
- Arsad PM, Buniyamin N, Manan JLA. editors. Neural Network and Linear Regression methods for prediction of students' academic achievement. Global Engineering Education Conference; 2014.
- Franklin J. The elements of statistical learning: data mining, inference, and prediction. J Am Stat Assoc 2010;99:567.
- Arpit D, Wu S, Natarajan P, Prasad R, Natarajan P. editors. Ridge Regression based classifiers for large scale class imbalanced datasets. Applications of Computer Vision; 2013.
- Zhang Z, Hong Y. Development of a novel score for the prediction of hospital mortality in patients with severe sepsis: the use of electronic healthcare records with LASSO regression. Oncotarget 2017;8:49637-45. [PubMed]
- Guyon I, Weston J, Barnhill S, Vapnik V. Gene Selection for Cancer Classification using Support Vector Machines. J Mach Learn 2002;46:389-422. [Crossref]
- van Dijk LV, Brouwer CL, van der Laan HP, Burgerhof JG, Langendijk JA, Steenbakkers RJ, Sijtsema NM. Geometric Image Biomarker Changes of the Parotid Gland Are Associated With Late Xerostomia. Int J Radiat Oncol Biol Phys 2017;99:1101-10. [Crossref] [PubMed]

