

Four-dimensional computed tomography-based biomechanical measurements of pulmonary function and their correlation with clinical outcome for lung stereotactic body radiation therapy patients
Introduction
Functional images such as single photon emission computed tomography (1) and xenon-enhanced computed tomography (2) have been used in the diagnosis and evaluation of treatment response assessment. Recently, four-dimensional computed tomography (4DCT), which is routinely used in treatment planning for patients treated with radiation therapy, has been used to generate ventilation images and this technique has proven to be a fast and cost effective technique for lung function assessment (3).
There are studies showing that radiation dose to the normal lung increases the risk of lung toxicity, such as dyspnea, pneumonitis, and fibrosis (4-8). Thus, restrictions in dose/volume are attempted during radiation treatment planning to limit the toxicity to the lung, which may lead to respiratory deficiency. To optimize the treatment plan, it is therefore important to understand how radiation dose delivered to different ventilation areas of the lung is associated with clinical outcome. As an efficient tool to quantify the relationship between dose and ventilation, ventilation imaging reveals region-specific information about the lung function.
4DCT-based ventilation imaging techniques often calculate ventilation function locally within each voxel (9). The accuracy of the resulting ventilation image will depend on the accuracy of DIR in individual voxels. Note that DIR errors in general are in the range of 1 to ~3 mm (10), which is comparable to the size of image voxels. This may introduce large uncertainties in the computation of ventilation images. In order to reduce the effect of displacement errors in individual voxels, we used a finite element-based biomechanical method in combination with DIR to calculate the relative volumetric variation in the lung (11-13).
The purpose of this study is twofold: (I) to investigate if radiation dose to higher ventilation regions will cause worse clinical outcome and (II) to evaluate the impact of different ventilation calculation methods on outcome assessment. Two ventilation imaging methods were used to identify different ventilation regions, and the correlation of radiation dose with clinical outcomes in these regions were fully analyzed. This study may help support the principle of function-guided radiotherapy (14) for sparing high functional lung areas during treatment planning.
Methods
Patient cohort
A total of 30 non-small cell lung cancer (NSCLC) patients treated with SBRT at Henry Ford Hospital were used for this study. Patients received 4 fractions of 12 Gy/fraction. Of the 30 patients 26 were NSCLC stage I, 1 was stage II, and 3 were stage IV. All patients had a pre-treatment 4DCT image routinely acquired for their treatment planning. Radiation dose was calculated using the analytical anisotropic algorithm implemented in Eclipse treatment planning system (Varian IEC; Varian Medical Systems, Inc, Palo Alto, CA). Dyspnea scores were available for these patients at 3 to 6 months post RT (range, 3–6 months). 19 out of the 30 patients had a tumor in the upper lobe, 2 in the middle lobe, and 9 in the lower lobe. According to the Common Terminology Criteria for Adverse Events version 3.0 scoring system, grade 0 is no dyspnea, grade 1 is shortness of breath with moderate exertion, grade 2 is shortness of breath with minimal exertion, grade 3 is shortness of breath at rest, grade 4 can cause life threatening consequences, and grade 5 is death. The clinical endpoint of this study was dyspnea scores of grades 2 or higher.
Calculation of Jacobian-based ventilation image
4DCT-based ventilation images are computed first by performing deformable image registration (DIR) between the end-inhale (EI) and end-exhale (EE) phases of the 4DCT images and then by using the resultant deformation vector field (DVF) to create the associated ventilation image. An intensity-based B-Spline registration algorithm (Elastix, v4.7, Utrecht, Netherlands) was used and the accuracy of the registration was inspected for all patients. The resulting DVF was used to calculate the Jacobian determinant for the deformation map. Volume change was quantified by the Jacobian determinant of the DVF which was calculated by (9),
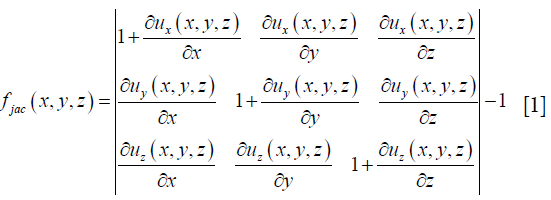
where u (x, y, z) is the displacement vector that maps the EI to the EE image. The Jacobian represents the local expansion or contraction of the lung tissue.
Calculation of relative volumetric variation maps
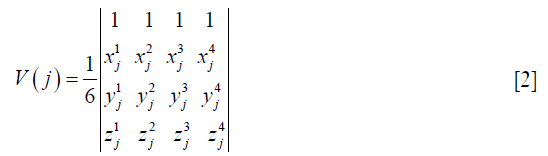
Lung volume variations correspond to air changes in the lung (15). Ventilation values can be calculated by the volumetric variation of each tetrahedron element as described in our previous work (11-13). Briefly, a cubic mesh consisting of 131,614 nodes and 747,384 tetrahedral elements was matched to the CT image domain. The coordinates (xj, yj, zj) of the vertices of each tetrahedron element j in the mesh were derived. The volume of each tetrahedron element was then calculated by the determinant of these coordinates,
DVFs obtained from the B-Spline DIR map were then used to move the vertices of the tetrahedron element j to their target positions to recalculate the volume of the deformed mesh. The relative volumetric variation (Rv) of each element j was defined as,
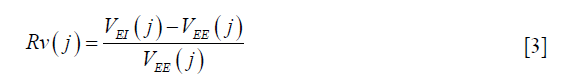
where VEI and VEE are lung volumes at each element j, calculated at the end inhalation and end exhalation phase. The values of Rv were then interpolated to create a ventilation image for the B-spline-based registration using a weighted interpolation method (16).
Functional metrics
Lung volume was contoured with automatic thresholding using a MATLAB-based tool [REGGUI (17)]. Mean lung dose (MLD) was calculated for all patients. The dose matrix was divided into multiple iso-dose regions: 1 to 5 (V1–5), 5 to 10 Gy (V5–10), 10 to 20 Gy (V10–20), and higher than 20 Gy (V≥20). The functionally weighted mean lung dose (fMLD and RvMLD) was calculated by weighting each voxel’s dose with their ventilation value as presented in Equation [4] (18-20). Percent ventilation within each dose region was defined as the ratio of ventilation functions (fJac and Rv) within an iso-dose volume and those in the whole lung. fMLD and fractional ventilation for V10–20 are calculated respectively by,
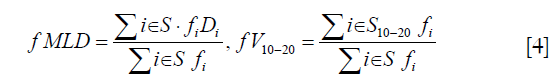
where S represents the voxels in the whole lung region and S10–20 denotes the voxels that received dose between 10 to 20 Gy. fi represents the function in voxel i calculated either by fJac or Rv, and Di denotes the dose in voxel i. Using the ventilation maps and dose matrix, the functional metrics defined in Equation [4] were calculated using MATLAB (MathWorks, R2012a).
Functional sub-volume dose metrics
There is no threshold value reported for defining a high ventilation region in ventilation images. In this study, the median ventilation of all subjects (0.95) was used to segment between high functional and low functional lung. For all patients, the volume of lung with ventilation <0.95 was considered low function and the volume of the lung with ventilation ≥0.95 was considered high functional lung. These functional sub-volumes were denoted by Flow and Fhigh. Within each Fi, the mean dose (MLDlow, MLDhigh) and the V1–5, V5–10, V10–20, V≥20 were determined. These metrics that create a second set of variables were named “functional sub-volume dose metrics”.
Statistical analysis
Coefficient of variation (CoV) was calculated by taking the ratio of the standard deviation and the mean of the ventilation function. Larger CoV values show higher heterogeneity in function, which may reflect the variation in lung function (14). In this analysis, receiver operating characteristic curves were used to assess the predictive power of functional and dosimetric variables in predicting dyspnea.
Spearman’s correlation coefficient between the mean Jacobian and Rv-based functions was calculated over all patients. An additional method performed for comparing the two ventilation functions was the Dice similarity coefficient (DSC) index which represents the similarity between the upper 55% Jacobian and Rv ventilation volumes. DSC between volumes A and B is calculated as,
Where |A| and |B| represent the cardinal sets of A and B. The DSC index values range between 0 and 1. A value of 1 indicates complete similarity, while an index of 0 indicates no similarity between the volumes.
Results
Predictive power of functional metrics
The highest dyspnea scores the patients developed was grade 2. Seven of the patients had grade 2 after-RT. Retrospective studies have shown that for patients treated with SBRT, the incidence of toxicity grades larger than grade 3 is only seen in less than 10% of patients (21,22). The MLD averaged over all patients was 3.8±1.5 Gy (range, 1.55–6.8 Gy). Average fMLD and RvMLD for patients with dyspnea grade 2 or greater was 3.70 Gy and 4.02 Gy, which was greater than 2.50 and 3.22 Gy calculated for patients with grade ≤1.
Table 1 shows the area under the curve (AUC) and the associated P values determined from the ROC analysis for fJac and Rv-based functional metrics over the whole lung region. The P value tests the null hypothesis that the AUC equals 0.50 vs. the alternative hypothesis that the AUC≠0.5. Both fJac and Rv-based ventilation methods had AUC values higher than 0.70 for V1–5, which shows a relatively high predictive power. For regions receiving dose above 20 Gy, the AUC value for the percent ventilation of the Rv method (AUC =0.69) was more predictive of outcome compared to the fJac (AUC =0.56).

Full table
Predictive power of functional sub-volume dose metrics
The high and low ventilation sub-volumes were obtained by both ventilation methods (Figure 1) and the dose metrics (e.g., mean dose, V1–5, V5–10, V10–20, V>20) within each sub-volume was calculated. In order to determine the predictive power of these metrics, AUCs and P values are reported in Table 2 for both ventilation methods. For the fJac ventilation image, mean dose in the Fhigh and Flow regions were 3.3±1.6 and 4.2±2.1 Gy, respectively. For the Rv-based ventilation image the mean dose in these regions were 3.4±1.7 and 3.2±2.7 Gy, respectively.


Full table
AUC values were in general higher for the high ventilated regions compared to the low ventilated regions, meaning the highly ventilated areas were more influenced by radiation dose (Table 2).
V1–5 has the highest AUC value for both Jacobian and Rv-based methods, 0.71 and 0.79, respectively. The AUCs were highest for the Rv-based method in the Fhigh volumes with AUCs up to 0.79. The Rv ventilation method may improve the identification and prediction of clinical outcome for the purpose of functional avoidance. The AUC values for MLDlow were 0.75 and 0.62, which indicate that dose in low ventilation regions also have an impact on the outcome.
Comparison of the two ventilation methods and dose-based metrics
The Spearman correlation coefficient between the means of the two ventilation images over all patients was 0.7 (P<0.05). The mean DSC index for the upper 55% Jacobian and Rv-ventilation volumes was 0.55±0.08, indicating some difference in distribution of the two ventilation volumes.
Average CoV of Jacobian and Rv ventilation over all patients was 0.99 and 0.68, respectively, showing a more heterogeneous distribution of fJac ventilation within the whole lung, while the Rv-based ventilation showed lower heterogeneity. An example of their difference is shown in Figure 2. Average CoV of 1.05 and 0.70 and lower CoV of 0.85 and 0.63 were seen in the upper and lower lobes of the lung, respectively. These results show that the fJac and Rv ventilation in the upper lung are 20% and 10% more heterogeneous than the lower lung, respectively. It should be mentioned that registration uncertainties generally are at the level of voxel size (1–2 mm) (10,12), so fJac function calculated at individual voxels are more heterogeneous.

The registrations between the EI and EE were visually inspected for unusual registration errors. The displacement grid for one patient is represented in Figure 3, where the displacements were largest in regions closer to the diaphragm, as expected. Using landmark evaluations, the average displacement error over all patients was 1.97±1.39 mm.

Figure 4 shows two patients, one with grade 1 dyspnea after RT (patient 1) and the other having grade 2 dyspnea after RT (patient 2). Patient 1 received a larger dose to the higher functional lung region while patient 2 receives a higher dose to a lower functional region of the lung and the higher ventilated regions of the lung are exposed to lower dose (1–5 Gy). MLD was 6.2 Gy for patient 1 and 5.59 Gy for patient 2, which are both higher than the average MLD over all patients.

Discussion
While 4DCT images are used mainly for treatment planning and dose calculation in radiation therapy, ventilation images developed from 4DCT images can help render pulmonary function to avoid high ventilation regions for treatment of lung cancer patients. Commonly used CT density or Jacobian based ventilation imaging techniques which directly calculate ventilation in each individual voxel (local volume change) are more sensitive to uncertainties of deformable registration, and consequently the quality of the computed ventilation images depends on the accuracy of displacement at each voxel. To reduce the impact of voxel-wise registration uncertainty, in this study we introduced a biomechanical model-based method to calculate the volumetric variation of each tetrahedral element rather than each voxel.
The results from the functional metrics showed that both fV1–5 and RvV1–5 were more predictive than other metrics and the functional metric RvV>20 showed a higher predictive power compared to fJac ventilation (fV>20). These results were generally in line with studies previously reporting AUC values (23). Liu et al. also found V10 to be a significant risk factor for radiation -induced lung toxicity (RILT) in patients treated with SBRT (24). It should be noted that no other study investigated SBRT patients with dyspnea as endpoint. Radiation pneumonitis after SBRT is fairly uncommon, usually less than 10% (25). In this study both ventilation methods showed that the areas receiving dose between 1 to 5 Gy are more predictive while a study by Fought et al. (26) showed AUC value of 0.70 (P=0.02) for fV>20 when predicting for grade 2+ pneumonitis. It is suggestive that compared to pneumonitis, dyspnea may be more influenced by the lung volume that was exposed to relatively lower dose.
The high and low functioning lung regions were segmented and the second set of metrics, functional sub-volume dose metrics (mean dose, V1–5, V5–10, V10–20, V>20), were used. Our results showed a higher predictive power for Rv ventilation (higher AUC values) compared to the fJac ventilation. We observed that radiation dose to low ventilated regions also leads to worse outcome, however, the AUCs were much lower than those of the high ventilated region. Faught et al. (26) reports that when thresholds higher than the 30th percentile are used, the AUC values vary by small deviations, ranging between 0.66–0.70. In our study, AUC values for Rv ventilation ranged from 0.43–0.79 and 0.61–0.67 for fJac for predicting grade 2+ dyspnea. Our study reported mean dose of 3.3±1.6 Gy in the high functioning lung and a MLD of 4.2±2.1 Gy for low functioning lung, meaning that for most patients, high dose was not in the same region as the high ventilation. This could be partly since in SBRT, higher dose is mainly focused around the tumor region which consists of a smaller volume, and ventilation in regions neighboring the tumor are usually reduced. However it should be noted that based on the linear-quadratic model the dose levels in SBRT (4×12 Gy/fraction) are equal to higher dose levels in conventional fractionation (21,27).
An interesting finding of our study was that in the high functional lung region, V1–5 had significantly higher AUC values for fJac ventilation and even higher AUC values for Rv ventilation. One reason for this observation may be that the volume of the functional lung receiving dose between 1 to 5 Gy is much larger than the volumes with dose higher than 20 Gy. Thus, the volume with relatively low dose in higher functional lung was more predictive of dyspnea. This may suggest that the dose as low as 1 Gy could cause dyspnea. Previous ventilation studies correlating function to toxicity, mostly just report the metrics related to dose regions above 20 Gy (14,23,28), but this study shows the importance of further investing the impact of low dose to high ventilation regions. In line with our results, a study by Scheenstra et al. (21), measuring the perfusion (SPECT) in patients treated with SBRT, showed that perfusion was still observed at high dose levels post-SBRT, where no perfusion was expected. Compared to 3D-conformal RT, volumetric modulated arc therapy/intensity modulated radiation therapy requires more monitor units, and therefore more attention should be paid to radiation leakage for lung SBRT patients.
Considering functional sub-volume dose metrics, it is evident that when looking at regions with higher function, the Rv ventilation provides higher predictive power compared to fJac. In a recent multi-institutional study, biomechanical-based DIR showed the highest correlation (median Spearman correlation coefficient =0.49) with clinical ventilation scans (29). This may indicate that biomechanical methods may be more desirable in calculating ventilation. Based on the results from the heterogeneity test, Rv ventilation technique seems to be less spatially variant than the fJac technique in representing ventilation (Figure 2). In this study, the same DVF was used to reconstruct the ventilation image, but the displacements used to calculate each voxel’s ventilation are different for the two methods, resulting in differences between fJac and Rv. The approach used here is different than that of others (30). Previous studies (29) have shown that the correlation between clinical ventilation images and the 4DCT-ventilaion images vary with the choice of 4DCT ventilation algorithm, and additionally with the choice of evaluation metrics used to compare ventilation distributions.
Several other studies have investigated correlation between ventilation metrics and radiation pneumonitis (RP), showing that incorporating functional information improves the prediction of RP (23,26,31). In our study the only endpoint available was dyspnea, and therefore may be considered as a limitation because comparable studies are not available for comparison. It should also be noted that dyspnea may be non-specific and, in some cases, it can be caused by other clinical conditions. A study by Paludan et al. (32) shows no association between dose and dyspnea changes. In this study we did not investigate dyspnea as a causative effect of lung ventilation. Rather, we have evaluated associations between lung regions with low and high ventilation and dyspnea, an outcome related to the quality of life of the patient. It should also be mentioned that the clinical observations revealed in this study are not conclusive and more patient data should be collected in future studies.
To the best of our knowledge this is the first study that investigates how dyspnea is correlated to ventilation in relatively low dose regions. Two ventilation imaging methods were used and compared in this study. The Rv ventilation method is less sensitive to registration errors and may help quantify region-specific ventilation to avoid high functional lung regions during radiation treatment. This method could also be used to assess the functional loss after RT. However, validation studies need to be performed in order to find the correspondence of this method with clinical ventilation scans.
Conclusions
Lung function prior to SBRT treatment was assessed using two ventilation imaging techniques with the resultant images correlated to clinical outcomes. It was found that dose as low as 1–5 Gy delivered to high ventilated areas could be related to the incidence of dyspnea. FEM-based ventilation images may improve the prediction of clinical toxicity for lung SBRT patients.
Acknowledgments
None.
Footnote
Conflicts of Interest: The authors have no conflicts of interest to declare.
References
- Harris B, Bailey D, Miles S, Bailey E, Rogers K, Roach P, Thomas P, Hensley M. Objective analysis of tomographic ventilation-perfusion scintigraphy in pulmonary embolism. Am J Respir Crit Care med 2007;175:1173-80. [Crossref] [PubMed]
- Simon BA. Regional ventilation and lung mechanics using X-Ray CT. Acad Radiol 2005;12:1414-22. [Crossref] [PubMed]
- Guerrero T, Sanders K, Noyola-Martinez J, Castillo E, Zhang Y, Tapia R, Guerra R, Borghero Y. Quantification of regional ventilation from treatment planning CT. Int J Radiat Oncol Biol Phys 2005;62:630-4. [Crossref] [PubMed]
- Sharifi H, van Elmpt W, Oberije C, Nalbantov G, Das M, Öllers M, Lambin P, Dingmans AMC, De Ruysscher D. Quantification of CT-assessed radiation-induced lung damage in lung cancer patients treated with or without chemotherapy and cetuximab. Acta Oncol 2016;55:156-62. [Crossref] [PubMed]
- Al Feghali KA, Wu Q, Wen N, Ajlouni M, Movsas B, Chetty IJ. Correlation of Normal Lung Density Changes With Dose After Stereotactic Body Radiation Therapy for Early Stage Lung Cancer. Int J Radiat Oncol Biol Phys 2017;99:E632. [Crossref]
- De Ruysscher D, Sharifi H, Defraene G, Kerns SL, Christiaens M, De Ruyck K, Peeters S, Vansteenkiste J, Jeraj R, Van Den Heuvel F, van Elmpt W. Quantification of radiation-induced lung damage with CT scans: The possible benefit for radiogenomics. Acta Oncol 2013;52:1405-10. [Crossref] [PubMed]
- Mehta V. Radiation pneumonitis and pulmonary fibrosis in non-small-cell lung cancer: Pulmonary function, prediction, and prevention. Int J Radiat Oncol Biol Phys 2005;63:5-24. [Crossref] [PubMed]
- De Ruysscher D, Houben A, Aerts HJWL, Dehing C, Wanders R, Öllers M, Dingemans AMC, Hochstenbag M, Boersma L, Borger J, Dekker A, Lambin P. Increased 18F-deoxyglucose uptake in the lung during the first weeks of radiotherapy is correlated with subsequent Radiation-Induced Lung Toxicity (RILT): A prospective pilot study. Radiother Oncol 2009;91:415-20. [Crossref] [PubMed]
- Reinhardt JM, Ding K, Cao K, Christensen GE, Hoffman EA, Bodas SV. Registration-based estimates of local lung tissue expansion compared to xenon CT measures of specific ventilation. Med Image Anal 2008;12:752-63. [Crossref] [PubMed]
- Yeo UJ, Supple JR, Taylor ML, Smith R, Kron T, Franich RD. Performance of 12 DIR algorithms in low-contrast regions for mass and density conserving deformation. Med Phys 2013;40:101701. [Crossref] [PubMed]
- Zhong H, Jin J, Ajlouni M, Movsas B, Chetty IJ. Measurement of regional compliance using 4DCT images for assessment of radiation treatment. Med Phys 2011;38:1567-78. [Crossref] [PubMed]
- Sharifi H, Zhang H, Bagher-Ebadian H, Lu W, Ajlouni MI, Jin JY, Kong FS, Chetty IJ, Zhong H. Utilization of a hybrid finite-element based registration method to quantify heterogeneous tumor response for adaptive treatment for lung cancer patients. Phys Med Biol 2018;63:065017. [Crossref] [PubMed]
- Sharifi H, Brown S, McDonald GC, Chetty IJ, Zhong H. 4-Dimensional computed tomography-based ventilation and compliance images for quantification of radiation-induced changes in pulmonary function. J Med Imaging Radiat Oncol 2019;63:370-7. [Crossref] [PubMed]
- Brennan D, Schubert L, Diot Q, Castillo R, Castillo E, Guerrero T, Martel MK, Linderman D, Gaspar LE, Miften M, Kavanagh BD, Vinogradskiy Y. Clinical validation of 4-dimensional computed tomography ventilation with pulmonary function test data. Int J Radiat Oncol Biol Phys 2015;92:423-9. [Crossref] [PubMed]
- Simon BA. Non-invasive imaging of regional lung function using x-ray computed tomography. J Clin Monit Comput 2000;16:433-42. [Crossref] [PubMed]
- Zhong H, Kim J, Chetty IJ. Analysis of deformable image registration accuracy using computational modeling. Med Phys 2010;37:970-9. [Crossref] [PubMed]
- Janssens G. Registration models for tracking organs and tumors in highly deformable anatomies: applications to radiotherapy [PhD thesis]. Belgium: Université Catholique de Louvain (UCL), 2010.
- Miften MM, Shiva KD, Min S, Lawrence BM. Incorporation of functional imaging data in the evaluation of dose distributions using the generalized concept of equivalent uniform dose. Phys Med Biol 2004;49:1711. [Crossref] [PubMed]
- Marks LB, Sherouse GW, Munley MT, Bentel GC, Spencer DP. Incorporation of functional status into dose-volume analysis. Med Phys 1999;26:196-9. [Crossref] [PubMed]
- Lan F, Jeudy J, Senan S, van Sornsen de Koste JR, D'Souza W, Tseng HH, Zhou J, Zhang H. Should regional ventilation function be considered during radiation treatment planning to prevent radiation-induced complications? Med Phys 2016;43:5072. [Crossref] [PubMed]
- Scheenstra AE, Rossi MM, Belderbos JS, Damen EM, Lebesque JV, Sonke JJ. Local dose-effect relations for lung perfusion post stereotactic body radiotherapy. Radiother Oncol 2013;107:398-402. [Crossref] [PubMed]
- Lagerwaard FJ, Haasbeek CJ, Smit EF, Slotman BJ, Senan S. Outcomes of risk-adapted fractionated stereotactic radiotherapy for stage I non-small-cell lung cancer. Int J Radiat Oncol Biol Phys 2008;70:685-92. [Crossref] [PubMed]
- Vinogradskiy Y, Castillo E, Tucker SL, Liao Z, Guerrero T, Martel MK. Use of 4-dimensional computed tomography-based ventilation imaging to correlate lung dose and function with clinical outcomes. Int J Radiat Oncol Biol Phys 2013;86:366-71. [Crossref] [PubMed]
- Liu Y, Yao H, Wang W, Shiue K, Cerra-Franco A, Vile D, Langer MP, Watson G, Bartlett G, Sheski F, Jin JY, Lautenschlaeger T, Kong FM. Risk Factors for Radiation-Induced Lung Toxicity after Stereotactic Body Radiation Therapy in Patients with Non-Small Cell Lung Cancer. Int J Radiat Oncol Biol Phys 2017;99:E475-6. [Crossref]
- Marks LB, Bentzen S, Deasy J, Kong F, Bradley J, Vogelius I, El Naqa I, Hubbs J, Lebesque J, Timmerman R, Martel M, Jackson A. Radiation dose-volume effects in the lung. Int J Radiat Oncol Biol Phys 2010;76:S70-6. [Crossref] [PubMed]
- Faught AM, Yamamoto T, Castillo R, Castillo E, Zhang J, Miften M, Vinogradskiy Y. Evaluating Which Dose-Function Metrics Are Most Critical for Functional Guided Radiation Therapy with CT Ventilation Imaging. Int J Radiat Oncol Biol Phys 99:E454-E5. [Crossref]
- Latifi K, Dilling TJ, Feygelman V, Moros EG, Stevens CW, Montilla-Soler JL, Zhang GG. Impact of dose on lung ventilation change calculated from 4D-CT using deformable image registration in lung cancer patients treated with SBRT. J Radiat Oncol 2015;4:265-70. [Crossref]
- Vinogradskiy Y, Schubert L, Diot Q, Waxweiller T, Koo P, Castillo R, Castillo E, Guerrero T, Rusthoven C, Gaspar L, Kavanagh B, Miften M. Regional lung function profiles of Stage I and III lung cancer patients: an evaluation for functional avoidance radiation therapy. Int J Radiat Oncol Biol Phys 2016;95:1273-80. [Crossref] [PubMed]
- Kipritidis J, Tahir BA, Cazoulat G, Hofman MS, Siva S, Callahan J, Hardcastle N, Yamamoto T, Christensen GE, Reinhardt JM, Kadoya N, Patton TJ, Gerard SE, Duarte I, Archibald-Heeren B, Byrne M, Sims R, Ramsay S, Booth JT, Eslick E, Hegi-Johnson F, Woodruff HC, Ireland RH, Wild JM, Cai J, Bayouth JE, Brock K, Keall PJ. The VAMPIRE challenge: A multi-institutional validation study of CT ventilation imaging. Med Phys 2019;46:1198-217. [Crossref] [PubMed]
- Castillo R, Castillo E, Martinez J, Guerrero T. Ventilation from four-dimensional computed tomography: density versus Jacobian methods. Phys Med Biol 2010;55:4661-85. [Crossref] [PubMed]
- Lind PA, Marks LB, Hollis D, Fan M, Zhou S-M, Munley MT, Shafman TD, Jaszczak RJ, Coleman RE. Receiver operating characteristic curves to assess predictors of radiation-induced symptomatic lung injury. Int J Radiat Oncol Biol Phys 2002;54:340-7. [Crossref] [PubMed]
- Paludan M, Traberg Hansen A, Petersen J, Grau C, Høyer M. Aggravation of dyspnea in stage I non-small cell lung cancer patients following stereotactic body radiotherapy: Is there a dose-volume dependency? Acta Oncol 2006;45:818-22. [Crossref] [PubMed]

