

T1ρ-based fibril-reinforced poroviscoelastic constitutive relation of human articular cartilage using inverse finite element technology
Introduction
As one of the critical tissues for supporting and distributing loads in human joints, articular cartilage consists of a low density of chondrocytes and a large amount of extracellular matrix (ECM). The ECM is composed of water and solid matrix, which mainly contribute to the load-bearing capacity of cartilage under transient and equilibrium conditions, respectively (1,2). In the context of common joint diseases such as degenerative and posttraumatic osteoarthritis (OA), biochemical and molecular changes occur in the cartilage ECM: hydration, proteoglycan loss, and thinning and disruption of collagen are seen in the early stages of OA; and dehydration, disorganization of collagen network, and loss of cartilage become prominent in the late stages (3-5).
Recently, quantitative magnetic resonance (MR) techniques, such as delayed gadolinium-enhanced MRI of cartilage (dGEMRIC) and T2 and T1ρ relaxometry, have been developed to assess the biochemical and compositional characterization of cartilage tissues (6-12). The T2 and T1ρ quantifications offer distinct advantages over dGEMRIC techniques in that no contrast agent is required. The T2 relaxation time reflects changes not only in water and collagen content but also in the organization of collagen fibrils and the formation of fibrocartilage (8,13). This multi-relation causes the T2 values of abnormal cartilage to change inconsistently: they are elevated in some OA cartilage but not higher (even significantly lower) in others (14-18). The T1ρ relaxation time is sensitive to slow-motion interactions between the macromolecules of ECM and the motion-restricted water molecules, enabling the noninvasive quantification of changes to the ECM (8). It is known that the T1ρ value becomes significantly elevated in knees with anterior cruciate ligament reconstructions and increases with the degree of cartilage degeneration in OA joints, revealing degeneration of the cartilage’s ECM (10,14,16). The quantitative relationship between the mechanical properties and MR quantifications of cartilage matrix has also been studied. The elastic moduli of animal and human cartilage were significantly correlated with the T1, T2, and T1ρ relaxation times (11,14,19). Tang et al. reported a significant and strong correlation between the T1ρ relaxation time and viscous properties of cartilage (20). In addition, some combinations of relaxation times, such as the T1ρ-to-T2 ratio, have been proposed as potential tools for estimating the elastic modulus of cartilage (9,15).
Mechanical stress plays a critical role in the development and progress of OA. It is therefore highly desirable to be able to noninvasively quantify in vivo the mechanical properties of cartilage. Combining the MR measurements of relaxation time and the quantitative relationship between relaxation time and tissue mechanical properties provides a clear pathway for noninvasively estimating material properties of in vivo tissues. However, cartilage tissues show very complicated mechanical behaviors, expressing heterogeneous, anisotropic and highly nonlinear characteristics. Hence, the mechanical behaviors of cartilage tissues cannot be fully captured by some general linear moduli (including viscous and elastic properties). To date, fibril-reinforced poroviscoelastic (FRPE) models have been proposed and have been proved to be the most applicable constitutive models for representing the mechanical behaviors of cartilage (1,21-27). In previous studies, because of physiological microstructures, the constitutive relation was composed of an interstitial fluid phase and two solid components, i.e., nonfibrillar matrix and collagen fibrils. Julkunen et al. reported a strong correlation between the T1ρ relaxation time and the nonfibrillar matrix modulus as well as between the T2 relaxation time and the initial fibril modulus based on MR-dGEMRIC images of human cartilage (21).
However, no studies have yet included T1ρ relaxation time in a FRPE constitutive relation to model the mechanical behavior of cartilage. The objective of this study was to update the FRPE constitutive relation of cartilage by including the T1ρ relaxation time. MR quantifications and mechanical tests of in vitro human tibiofemoral cartilages were used in an inverse finite element (FE) optimization to determine a quantitative relationship between the T1ρ relaxation time and material parameters of cartilage. Furthermore, the updated T1ρ-based constitutive relation has been investigated by leave-one-out cross validation, sensitivity analysis of parameters, and comparison with the common FRPE constitutive relation.
Methods
Specimen preparation and tests
Both the MR T1ρ maps and indentation data for the cartilage samples were obtained from our previous published research (20). The experimental protocols were approved by the Committee on Human Research at the University of California, San Francisco. In brief, four human tibial plateaus (medial or lateral unicompartment), obtained from patients who had undergone total knee arthroplasty due to severe OA, were stored at −80 °C immediately after surgery. Before MR imaging acquisition, these plateaus were thawed overnight at 4 °C, fixed on a radiographically opaque plastic grid for location reference, and immersed into a phosphate-buffered saline solution for approximately 0.5 h at room temperature. A GE 3T MR imaging system (General Electric, Milwaukee, WI, USA) with a quadrature transmit/8-channel phased-array receive knee coil (Invivo Corp., Orlando, FL, USA) was used for scanning the tibial plateaus under the following settings (28): 3D MAPSS sequence; repetition time/echo time (TR/TE) =9.3/3.7 ms; field of view (FOV) =6–8 cm; matrix =256×128; slice thickness =2 mm; bandwidth (BW) =31.25 kHz; view per segment (VPS) =64; Trec =1.5 s; time of spin-lock (TSL) =0, 10, 40, 80 ms; and frequency of spin-lock (FSL) =500 Hz. The map of T1ρ relaxation times was reconstructed pixel by pixel using a Levenberg-Marquardt mono-exponential fitting algorithm described by Li and colleagues (16,28). After MR scanning, ten sites were selected for the indentation test from the human tibial plateaus (Figure S1). The International Cartilage Repair Society Outerbridge scores of the cartilage tissues at these ten sites were 2.8±0.4 (mean ± SD), ranging from 2 to 3. Indentation tests were performed using the indentation system, BioDent 1000 TDI (Active Life Scientific, Inc., Santa Barbara, CA, USA), with the samples submerged in phosphate-buffered saline at 20 °C. A coaxial probe was used for the test: its outer part was hollow for identifying the articular surface while its core part was a flat tip 1.47 mm in diameter to indent tissues. A sinusoidal reciprocation of 300 µm was implemented for the indenter cyclically along its longitudinal direction (i.e., 1 Hz). After the mechanical response of the tissues reached a steady state (i.e., the change of peak force was <1%), the depth-force curves in three cycles were extracted and averaged to determine the indentation behavior of each specimen (Figure 1A). A schematic diagram of the whole workflow is shown in Figure 1B.


Constitutive relation of cartilage including T1ρrelaxation time
We updated a commonly used FRPE constitutive relation of cartilage (22,26) by linking T1ρ relaxation time to its stress-strain relationship. The constitutive framework of cartilage was composed of nonfibrillar matrix and collagen fibrils (including 4 primary fibrils and 7 secondary fibrils) (24), as shown in Figure 2. It is known that fluid permeability mainly affects the transient response of the cartilage, whereas the mechanical properties of the cartilage at the equilibrium stage are determined almost exclusively by the solid component (including the nonfibrillar matrix and collagen fibrils) (1,27). Because the loading curves used in this study were obtained from the steady state of the cyclical indentation (Figure 1A), the component of the hydrostatic pressure was ignored in this updated constitutive relation. However, an obvious phase lag between force and displacement peaks was still observed in these loading curves at the steady state (20). This was assumed to be attributable to the viscous properties of the solid component.

The total stress tensor of the cartilage σtot was
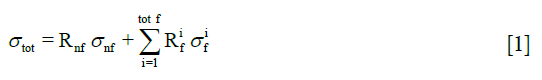
where σnf and  are the Cauchy stress tensor of the nonfibrillar matrix and the i-th collagen fibril respectively, and Rnf and are their volume fractions with respect to the total volume, respectively. We define ns,0 as the initial volume fraction of the hydrated solid to the total volume (i.e., including the intrafibrillar water), which equals
 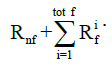 . The parameters Rnf and were (22,26,27,29)
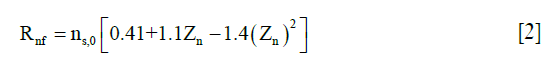
where Zn is the normalized depth in the tissue (0 at the articular surface of the cartilage sample and 1 at the bottom). C0 was assumed to be 3.009 (25).
The stress tensor of the nonfibrillar matrix, σnf, was defined as the same as those in the literature by the following modified neo-Hookean law (22,26,27):
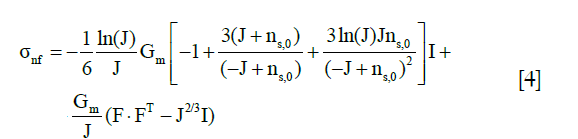
where J is the determinant of the deformation gradient tensor F, I is the unit tensor, and Gm is the shear modulus of 0.903 MPa (22).
The stress tensor of the i-th collagen fibril,, is given by
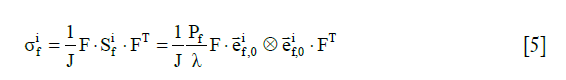
where  is the 2nd Piola-Kirchhoff stress tensor; C is the right Cauchy–Green strain tensor, as C = FT · F;
 is the initial direction vector of the i-th collagen fibril;
  is the dyadic product of two vectors; λ is the elongation of the fibril, as
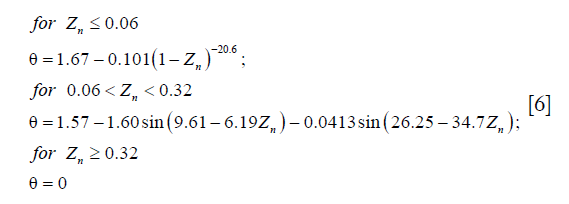
 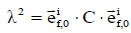 ; and Pf is the 1st Piola-Kirchhoff stress value of the collagen fibril (including primary and secondary). The initial directions of the collagen fibrils were defined according to directions found in the literature (24). First, the orientations of the seven secondary fibrils were assumed to be random. Second, the four primary fibrils from bottom to top firstly oriented as an arcade that extended perpendicular to the subchondral bone surface (in the deep zone), deflected toward two orthogonal directions parallel to the subchondral bone surface (in the middle zone), and then were flush with the articular surface (in the superficial zone) (Figure 2B). The three directions in defining the fibril orientations are shown as the axes x, y, and z, corresponding to the radial, circumferential, and normal directions of the unicondylar tibial plateaus, respectively (Figure 2A). The angle of the primary fibrils with respect to the normal axis of the articular surface, θ, was determined by fitting the published data of Wilson et al. (24) as shown in the following:
The 1st Piola-Kirchhoff stress value Pf of the collagen fibril was represented by a set of springs and a damper as the published papers (22,26):
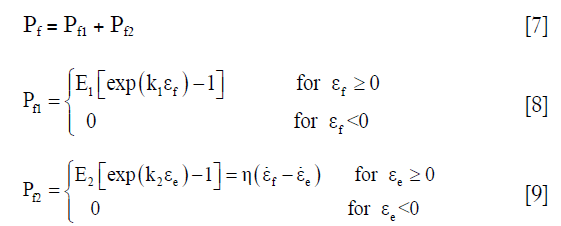
where εf = In (λ) is the total logarithmic fibril strain and εe is the strain of the spring at the side of the damper (Figure 2C). The material constants k1, k2, E1, E2, and η were defined as 3.825, 72.328, 6.632 MPa, 15.555 MPa, and 1,197.1 MPa·s, respectively (22).
Parameter identification using the inverse FE method
It is known that T1ρ relaxation time is sensitive to changes in the ECM, although the specific relationship between T1ρ and ECM content is not fully understood. Based on both the T1ρ and the hydrated solid volume fraction data through the depth direction of healthy bovine cartilage from published studies (11,27), we suggested a two-parameter exponential relationship between the ns,0 and the T1ρ relaxation time for human cartilage as

where C1 and C2 are two parameters that need to be determined.
The whole cartilage of each tibial plateau was reconstructed using the software MeVisLab v2.5.1 (MeVis Medical Solutions AG, Bremen, Germany) based on the MR images described above. Then, a 3D geometrical model at each site was extracted according to the opaque grids beneath, with horizontal dimensions of 4.4 mm × 4.4 mm (i.e., 3 times the probe diameter). All geometrical models were meshed by 8-node hexahedral element using the software TrueGrid (XYZ Scientific Applications, Inc., Pleasant Hill, CA, USA). The element size was 0.367 mm × 0.367 mm in the horizontal dimensions of the cartilage while the element number in its depth direction was 10 (i.e., 1,440 elements for one cartilage sample). Each element was assigned with the T1ρ value of the corresponding pixel in the MR quantification mappings as well as with the normalized depth Zn calculated using a custom-coded MATLAB script (MathWorks, Inc., Natick, MA, USA). Mesh convergence of the FE model was checked by comparing the simulated resultant force of the indenter from the current element density with those from a double-meshed density under the same displacement loading. The difference between these two simulated resultant force curves was <3%, indicating the convergence of the current element density.
All FE models of the indentation test were developed using the software LS-DYNA (Livermore Software Technology Corporation, Livermore, CA, USA). According to the previous indentation test, a 1.47-mm-diameter flat indenter was created at the center of the articular surface and defined as steel with elastic modulus of 207 GPa and Poisson’s ratio of 0.3. The cartilage tissues were defined by the T1ρ-based constitutive relation using a user subroutine of material in LS-DYNA. The bottom surface of the cartilage model was fixed in all degrees of freedom; the indenter was only free in its longitudinal axis. Frictionless contacting behavior was defined between the cartilage tissues and the indenter. In each simulation, loading was applied to the indenter, whose value was defined by the indentation force curve from the averaged depth-force data of the corresponding sample. Because of the uncertain geometry of the indenter tip and the partial gap between the indenter and rough tissue surface during the initial loading portion, relative indentation depth was used to identify the parameters. It was calculated by subtracting the indentation depth value at 25% of the peak force from the indentation depth curve of the upper 75% portion. Polynomial metamodel optimization technology in the LS-OPT software (Livermore Software Technology Corporation, Livermore, CA, USA) was employed to determine the parameters C1 and C2 of each sample by comparing their experimental and simulated relative indentation depth curves.
Assessment of the T1ρ-based constitutive relation
Three assessments were performed for the T1ρ-based constitutive relation, including leave-one-out cross validation, sensitivity analysis of the parameters, and comparison with the common FRPE constitutive relation. All the settings of these FE simulations were the same as described above, except for the parameters below.
In the leave-one-out validation, the parameters C1 and C2 for each sample were determined by averaging the corresponding values from all the other nine samples. In the sensitivity analysis, three levels of the parameter ns,0 were compared: the standard level of the parameter ns,0 was defined by the averaged C1 and C2 (Table 1); the higher and lower levels of ns,0 were calculated by increasing and decreasing the standard value by 25%, respectively. A linear regression analysis was developed between the experimental and simulated relative depth results for the leave-one-out validation and the sensitivity analysis. In the comparison between the T1ρ-based and common FRPE constitutive relations, the parameter ns,0 was determined by Eq. [10] and the averaged C1 and C2 (Table 1) for the T1ρ-based constitutive relation, and by  for the common FRPE constitutive relation, respectively (21,27). The simulated maximal relative indentation depths were compared with the experimental data using linear regression analysis and Bland-Altman plots. Additionally, the stress distributions from these two constitutive relations were compared, including the minimal principal stress and the maximal shear stress.

Full table
Results
Table 1 indicates the parameters C1 and C2 for all ten cartilage samples. Their mean and standard deviation (SD) were 0.770±0.0807 and −0.0027±0.00053, respectively.
In the leave-one-out validation of the T1ρ-based constitutive relation, a strong correlation was observed between the experimental and simulated maximal results of the relative indentation depth with its regression equation as

where X and Y correspond to the experimental and simulated results, respectively (Figure 3A). In the sensitivity analysis of the parameter ns,0, the results of the linear regression analysis for the three parameter levels are shown in Figure 3B. Compared with the relative indentation depth results under the standard ns,0 value (based on the averaged C1 and C2), the 25% increase of the parameter induced the slope of the regression equation from 0.939 to 0.655; the 25% decrease changed the slope from 0.939 to 1.496.

In the comparison of the T1ρ-based and the common FRPE constitutive relations, the simulated relative indentation depths were similar between the two constitutive relations. The linear regression equations between the experimental results and the simulations of the T1ρ-based and the common FRPE constitutive relations were Y=0.939X+0.0036 and Y=0.936X+0.0046, respectively (Figure 4A,B). The different ratio between the simulated and experimental results were both within the range of ±1.96 SD for the two constitutive relations, shown in the Bland-Altman plots (Figure 4C,D). However, the stress results of the cartilage samples showed differences between these two constitutive relations. Specifically, some samples manifested wider distributions of high maximal shear stress by the T1ρ-based constitutive relation (S1_loc1, S1_loc2, S2_loc2, S3_loc1, S4_loc1, S4_loc2) whereas some samples did not reveal any obvious difference (S1_loc3, S1_loc4, S2_loc3). In the sample S2_loc1, the maximal shear stress by the T1ρ-based constitutive relation showed a narrower distribution compared with that by the common FRPE constitutive relation. In contrast, the distribution of minimal principal stress did not reveal any obvious difference except for the samples S1_loc1, S2_loc3, and S4_loc2. Sample S2_loc3 showed a narrower distribution of high minimal principal stress by the T1ρ-based constitutive relation, whereas the distributions of the other two samples (S1_loc1 and S4_loc2) were wider from the common FRPE constitutive relation. Furthermore, the T1ρ values were analyzed from all the elements with obvious stress change. Elements with higher T1ρ values (mean ± SD: 130±40 ms, n=24) led to higher stress in the T1ρ-based relation than that in the common relation; elements with lower T1ρ values (mean ± SD: 80±36 ms, n=35) resulted in lower stress results in the T1ρ-based relation. The T1ρ values of 130±40 ms were significantly higher than the lower T1ρ values of 80±36 ms (two-tailed t test, P<0.0001). Figure 5 shows the comparison results of a typical cartilage sample (sample S4_loc1) between these two FRPE constitutive relations.


Discussion
In this study, we updated a common FRPE constitutive relation of cartilage by including MR T1ρ relaxation time through an inverse FE approach. A two-parameter exponential relation was obtained between the T1ρ quantification and the constitutive coefficient of the hydrated solid volume fraction (ns,0). The results of the leave-one-out cross validation demonstrated that the T1ρ-based FRPE constitutive relation can be used to determine the mechanical behaviors of cartilage reliably (Figure 3A). In the sensitivity analysis of the parameter ns,0, the slope values of the linear regression analyses indicated that a 25% increase of the ns,0 reduced the relative indentation depth by 30%, whereas a 25% decrease of the ns,0 raised the relative indentation depth by 59% (Figure 3B). Chang and Tang also indicated that the stiffness significantly decreased at the superficial layer of the cartilage after a loss of solid matrix (30). The sensitivity analysis results reveal the important role of the parameter ns,0, coinciding with the suggestion that the mechanical behavior of cartilage under equilibrium conditions can be mainly atrributed to the solid component (1,2).
To our knowledge, this is the first study to include MR T1ρ relaxation time in a FRPE constitutive relation for human cartilage. Similarly, Julkunen et al. studied the correlation between MR T1 and T2 quantifications and the FRPE constitutive relation and suggested that a quantitative relationship exists between the T1 relaxation time and the nonfibrillar matrix modulus as well as between the T2 relaxation time and the initial fibril modulus (21). However, the MR relaxation results averaged over the full thickness of cartilage were used in their work, and the inhomogeneity of MR relaxation times over cartilage depth was thus ignored. The stress and strain relationship of cartilage under physiological loadings is nonuniform in depth, which implies that the role of cartilage tissue in load bearing depends both on its depth and its mechanical behaviors (31). According to the mappings of the T1ρ relaxation times at different anatomical sites and depths, the physiological distribution of the mechanical behaviors can be determined by this T1ρ-based FRPE constitutive relation, especially for abnormal cartilage.
The parameters C1 and C2 in the constitutive relation indicated that the ns,0 reached 73% when the T1ρ relaxation time was approximately 20 ms. This result agrees with the maximal fraction value of hydrated solid volume in cartilage (27). Compared with the fraction of dry solid matrix, the fraction of hydrated solid matrix increases by two times (i.e., 30% at the surface and 70% at the bottom of cartilage). The increase from the dry to the hydrated solid fraction results from the effect of intrafibrillar water, which seems to enlarge the diameter of some thin fibrils. Atomic force microscopy revealed that some thin fibrils (20 nm diameter) occur in hydrated cartilage tissues but disappear when dehydrated (32). The parameter ns,0 in the previous FRPE constitutive relations was all calculated based on some measurements of dry solid component, but the corresponding mechanical coefficients were determined using hydrated samples (21,23-27,29,33). The mechanical properties and volume fraction of the solid component should be determined based on the cartilage samples under the same condition, f.i., the hydrated condition.
Figure 3 shows that no obvious difference existed in the simulated results of indentation depth between the T1ρ-based and common FRPE constitutive relations. In contrast, different stress distributions were found in local regions of the cartilage samples, especially on their articular surface (a typical cartilage sample is shown in Figure 5). The change of the stress distribution between these two constitutive relations may be attributable to the specific T1ρ values of the elements at the indenting site. Comparison of the T1ρ at the sites of obvious stress changes reveals that the stress values from the T1ρ-based relation become higher than those from the common relation when higher T1ρ values exist (130±40 ms) but become lower when lower T1ρ values exist (80±36 ms). Compared with the common FRPE relation, the T1ρ-based relation reveals higher stress at the sites of higher T1ρ values, meaning the initial damaged region of cartilage in early OA is subjected to a more severe local mechanical environment. The results of the comparison between these two constitutive relations also implies that the T1ρ-based constitutive relation can predict changes in the mechanical properties of cartilage in the early stages of OA development, in vivo and noninvasively.
There are some limitations in this study. (I) Limited availability of the current methodology forced us to assume the depth-dependent fraction values of the nonfibrillar matrix and collagen fibrils with respect to the solid volume by previous works (22,26,27,29). Using newly established optical coherence tomography technology (34), the orientation of collagen fibril can, in the future, be in vitro detected for the purpose of exploring a more accurate T1ρ-based constitutive relation. (II) The component “hydrostatic pressure” was not included in the updated constitutive relation because the indentation test data at the transient stage was not used in this study. Both the swelling test and compression tests with varying strain rates need to be performed in the future if one is to include the hydrostatic component in the constitutive relation. (III) The resolution of the medical MR images was approximately 0.3 mm/pixel. Future developments in advanced medical MR scanning systems will provide a more precise distribution of the T1ρ in human cartilage. (IV) The cartilage samples used in this paper are unhealthy under different OA degrees. Some healthy cartilage samples should be included in modeling the T1ρ-based constitutive relation in the future, which could enhance the research significance.
In conclusion, we updated the common FRPE constitutive relation of human cartilage by including MR T1ρ relaxation time. A two-parameter exponential relationship was determined between T1ρ relaxation time and constitutive coefficients by inverse FE simulations of the indentation test in human cartilage samples. Although a similar indentation depth result was obtained between the T1ρ-based and common FRPE constitutive relations, the T1ρ-based FRPE constitutive relation can reveal different local changes of the stress distribution in cartilages compared with the common FRPE constitutive relation (i.e., without T1ρ). By integrating a quantitative MR measure of cartilage, the T1ρ-based constitutive relation will provide a precise in vivo assessment of the mechanical behaviors for cartilage tissues in the setting of joint dysfunction (such as OA and acute injuries) for individual patient joints. As a consequence, the real mechanical environment in the abnormal cartilages during daily and sport activities can be accurately in vivo estimated through the T1ρ-based constitutive relation. This can contribute to understanding damage initiation and development in cartilage, evaluating outcome of clinical treatments, and optimizing design of rehabilitation protocols.
Acknowledgements
Funding: This study was supported by grants from the U.S. National Institutes of Health (NIH/NIAMS P50AR060752 and NIH/NIAMS R21AR056773 to X Li; and R01HL119857 to L Ge) and the National Natural Science Foundation of China (51575299 to Z Hao). The authors also gratefully acknowledge the financial support from the project of the Beijing Joint Care Foundation.
Footnote
Conflicts of Interest: The authors have no conflicts of interest to declare.
Ethical Statement: The experimental protocols were approved by the Committee on Human Research at the University of California, San Francisco.
References
- Gupta S, Lin J, Ashby P, Pruitt L. A fiber reinforced poroelastic model of nanoindentation of porcine costal cartilage: A combined experimental and finite element approach. J Mech Behav Biomed Mater 2009;2:326-37; discussion 337-8. [Crossref] [PubMed]
- Soltz MA, Ateshian GA. Experimental verification and theoretical prediction of cartilage interstitial fluid pressurization at an impermeable contact interface in confined compression. J Biomech 1998;31:927-34. [Crossref] [PubMed]
- Goldring MB, Goldring SR. Osteoarthritis. J Cell Physiol 2007;213:626-34. [Crossref] [PubMed]
- Lohmander LS, Ionescu M, Jugessur H, Poole AR. Changes in joint cartilage aggrecan after knee injury and in osteoarthritis. Arthritis Rheum 1999;42:534-44. [Crossref] [PubMed]
- Price JS, Till SH, Bickerstaff DR, Bayliss MT, Hollander AP. Degradation of cartilage type II collagen precedes the onset of osteoarthritis following anterior cruciate ligament rupture. Arthritis Rheum 1999;42:2390-8. [Crossref] [PubMed]
- Bashir A, Gray ML, Boutin RD, Burstein D. Glycosaminoglycan in articular cartilage: in vivo assessment with delayed Gd (DTPA)(2-)-enhanced MR imaging. Radiology 1997;205:551-8. [Crossref] [PubMed]
- Li X, Kuo D, Theologis A, Carballido-Gamio J, Stehling C, Link TM, Ma CB, Majumdar S. Cartilage in anterior cruciate ligament-reconstructed knees: MR imaging T1ρ and T2—initial experience with 1-year follow-up. Radiology 2011;258:505-14. [Crossref] [PubMed]
- Li X, Majumdar S. Quantitative MRI of articular cartilage and its clinical applications. J Magn Reson Imaging 2013;38:991-1008. [Crossref] [PubMed]
- Nieminen MT, Töyräs J, Laasanen MS, Silvennoinen J, Helminen HJ, Jurvelin JS. Prediction of biomechanical properties of articular cartilage with quantitative magnetic resonance imaging. J Biomech 2004;37:321-8. [Crossref] [PubMed]
- Su F, Hilton JF, Nardo L, Wu S, Liang F, Link TM, Ma CB, Li X. Cartilage morphology and T1ρ and T2 quantification in ACL-reconstructed knees: a 2-year follow-up. Osteoarthritis Cartilage 2013;21:1058-67. [Crossref] [PubMed]
- Wheaton AJ, Dodge GR, Elliott DM, Nicoll SB, Reddy R. Quantification of cartilage biomechanical and biochemical properties via T1ρ magnetic resonance imaging. Magn Reson Med 2005;54:1087-93. [Crossref] [PubMed]
- Xia Y. Relaxation anisotropy in cartilage by NMR microscopy (µMRI) at 14-µm resolution. Magn Reson Med 1998;39:941-9. [Crossref] [PubMed]
- Choi JA, Gold GE. MR imaging of articular cartilage physiology. Magn Reson Imaging Clin N Am 2011;19:249-82. [Crossref] [PubMed]
- Hatcher CC, Collins AT, Kim SY, Michel LC, Mostertz WC 3rd, Ziemian SN, Spritzer CE, Guilak F, DeFrate LE, McNulty AL. Relationship between T1rho magnetic resonance imaging, synovial fluid biomarkers, and the biochemical and biomechanical properties of cartilage. J Biomech 2017;55:18-26. [Crossref] [PubMed]
- Keenan KE, Besier TF, Pauly JM, Smith RL, Delp SL, Beaupre GS, Gold GE. T1rho Dispersion in articular cartilage: relationship to material properties and macromolecular content. Cartilage 2015;6:113-22. [Crossref] [PubMed]
- Li X, Ma CB, Link TM, Castillo DD, Blumenkrantz G, Lozano J, Carballido-Gamio J, Ries M, Majumdar S. In vivo T1ρ and T2 mapping of articular cartilage in osteoarthritis of the knee using 3T MRI. Osteoarthritis Cartilage 2007;15:789-97. [Crossref] [PubMed]
- Pan J, Pialat JB, Joseph T, Kuo D, Joseph GB, Nevitt MC, Link TM. Knee cartilage T2 characteristics and evolution in relation to morphologic abnormalities detected at 3-T MR imaging: a longitudinal study of the normal control cohort from the Osteoarthritis Initiative. Radiology 2011;261:507-15. [Crossref] [PubMed]
- Potter HG, Jain SK, Ma Y, Black BR, Fung S, Lyman S. Cartilage injury after acute, isolated anterior cruciate ligament tear: immediate and longitudinal effect with clinical/MRI follow-up. Am J Sports Med 2012;40:276-85. [Crossref] [PubMed]
- Nissi MJ, Rieppo J, Töyräs J, Laasanen MS, Kiviranta I, Nieminen MT, Jurvelin JS. Estimation of mechanical properties of articular cartilage with MRI - dGEMRIC, T2 and T1 imaging in different species with variable stages of maturation. Osteoarthritis Cartilage 2007;15:1141-8. [Crossref] [PubMed]
- Tang SY, Souza RB, Ries M, Hansma PK, Alliston T, Li X. Local tissue properties of human osteoarthritic cartilage correlate with magnetic resonance T1rho relaxation times. J Orthop Res 2011;29:1312-9. [Crossref] [PubMed]
- Julkunen P, Korhonen RK, Nissi MJ, Jurvelin JS. Mechanical characterization of articular cartilage by combining magnetic resonance imaging and finite-element analysis—a potential functional imaging technique. Phys Med Biol 2008;53:2425-38. [Crossref] [PubMed]
- Julkunen P, Wilson W, Jurvelin JS, Rieppo J, Qu CJ, Lammi MJ, Korhonen RK. Stress-relaxation of human patellar articular cartilage in unconfined compression: Prediction of mechanical response by tissue composition and structure. J Biomech 2008;41:1978-86. [Crossref] [PubMed]
- Li LP, Buschmann MD, Shirazi-Adl A. A fibril reinforced nonhomogeneous poroelastic model for articular cartilage: inhomogeneous response in unconfined compression. J Biomech 2000;33:1533-41. [Crossref] [PubMed]
- Wilson W, van Donkelaar CC, van Rietbergen B, Ito K, Huiskes R. Stresses in the local collagen network of articular cartilage: a poroviscoelastic fibril-reinforced finite element study. J Biomech 2004;37:357-66. [Crossref] [PubMed]
- Wilson W, van Donkelaar CC, van Rietbergen B, Huiskes R. A fibril-reinforced poroviscoelastic swelling model for articular cartilage. J Biomech 2005;38:1195-204. [Crossref] [PubMed]
- Wilson W, Huyghe JM, van Donkelaar CC. A composition-based cartilage model for the assessment of compositional changes during cartilage damage and adaptation. Osteoarthritis Cartilage 2006;14:554-60. [Crossref] [PubMed]
- Wilson W, Huyghe JM, van Donkelaar CC. Depth-dependent compressive equilibrium properties of articular cartilage explained by its composition. Biomech Model Mechanobiol 2007;6:43-53. [Crossref] [PubMed]
- Li X, Han ET, Busse RF, Majumdar S. In Vivo T1ρ Mapping in cartilage using 3D magnetization-prepared angle-modulated partitioned k-space spoiled gradient echo snapshots (3D MAPSS). Magn Reson Med 2008;59:298-307. [Crossref] [PubMed]
- Rieppo J, Hyttinen MM, Lappalainen R, Jurvelin JS, Helminen HJ. Spatial determination of water, collagen and proteoglycan contents by Fourier transform infrared imaging and digital densitometry. 50th Annual Meetings of the Orthopaedic Research Society 2004;Poster No.:1021.
- Chang A, Tang SY. Determination of the depth- and time-dependent mechanical behavior of mouse articular cartilage using cyclic reference point indentation. Cartilage 2018. Epub ahead of print. [Crossref] [PubMed]
- Peña E, Calvo B, Martínez MA, Doblaré M. Computer simulation of damage on distal femoral articular cartilage after meniscectomies. Comput Biol Med 2008;38:69-81. [Crossref] [PubMed]
- Zhu P, Fang M. Nano-morphology of cartilage in hydrated and dehydrated conditions revealed by atomic force microscopy. J Phys Chem Biophys 2012;2:106. [Crossref]
- Shapiro EM, Borthakur A, Kaufman JH. Water distribution patterns inside bovine articular cartilage as visualized by 1H magnetic resonance imaging. Osteoarthritis Cartilage 2001;9:533-8. [Crossref] [PubMed]
- Lu Z, Kasaragod D, Matcher SJ. Conical scan polarization-sensitive optical coherence tomography. Biomedical Optics Express 2014;5:752-62. [Crossref] [PubMed]

