

Discrimination and conversion prediction of mild cognitive impairment using convolutional neural networks
Introduction
Alzheimer’s disease (AD) is an irreversible, progressive, neurodegenerative disease characterized by global cognitive decline, and behavioral and functional changes, which heavily affects the ability of individuals to perform basic activities of daily life (1). As therapeutic intervention is likely more beneficial in the early stage of the disease, mild cognitive impairment (MCI), which has a 10% to 15% risk per year to convert into AD compared with normal elderly persons (2), has attracted more and more attention. Most existing studies of this issue have mainly focused on the classification of NC, MCI and AD using machine learning techniques (3,4). However, due to the heterogeneity of the MCI, there is still difficulty in identifying those who are most likely to convert from MCI to AD, and challenges in further predicting the conversion time for effective risk estimate, which could lead to efficient intervention of pharmacological treatments for early AD (5).
As a non-invasive method to reveal the structure and changes of the brain, neuroimaging such as structural magnetic resonance imaging (MRI), has been verified to be both valid and sensitive for MCI and AD prediction (6,7). Beyond that, development of an assistive tool or algorithm to identify MR-based imaging data, has always been of very interest to clinicians (8). Existing prediction methods could be divided into four categories which include regression algorithm (9), Bayesian methods (10), support vector machine (SVM) (11) and other methods (12). For example, Lee et al. (13) applied logistic regression model with fused lasso regularization for annual changes prediction from MCI to AD in the corpus callosum thickness profile, resulting in an accuracy of prediction of 84% in females and 61% in males. Young et al. (14) introduced Gaussian process (GP) classification to produce naturally probabilistic predictions, which showed 74% accuracy and 0.795 area under curve (AUC) for predicting AD conversion within 3 years in a population of 96 stable MCI (sMCI) and 47 converted MCI (cMCI) subjects. Gavidia-Bovadilla et al. (15) predicted the conversion of cMCI to be 1.9 years earlier for females (accuracy of 72.5%) and 1.4 years earlier for males (accuracy of 69.0%) using residual-based SVM modelling, and Ardekani et al. (12) determined the utility of hippocampal volumetric integrity (HVI) with an accuracy of 82.3% in classification between stable and progressive MCI patients, using the Random Forest classification algorithm. However, these methods had several shortcomings. First, most of the machine learning techniques only worked well in binary classification, and their performances declined sharply when they were extended to multi-classes tasks (16). In consequence, a multi-class classification problem was normally facilitated as a series of binary classification tasks instead of being naturally modeled for diagnosis of AD (10). For instance, a progressive two-class proximal support vector machine based decision (pTCDC-PSVM) classifier was employed to distinguish between AD, and MCI from the NC group (17). Second, the conventional prediction models required large-scale feature engineering with shallow structures and affine data transformation, which were time-consuming in feature computation, extraction and dimensionality reduction.
Recently, with the accessibility of affordable parallel computing resources via graphics processing units (GPUs) for computational acceleration, deep learning architectures have possibly been turned into advanced learning algorithms that extracted high-level features progressively via hidden layers of feature representations. Deep convolutional neural networks (CNNs), which were inspired by the human visual system, have enabled certain properties to be encoded and have also reduced hyper parameters on the basis of the explicit assumption that raw data are comprised of two-dimensional images. The CNNs have made substantial advancements in the multi-classification of natural images (18), as well as in biomedical applications, such as pulmonary nodule detection (19), interstitial lung disease classification (20), and AD early diagnosis (4). In one study, a deep ensemble learning of sparse regression models was reported to classify NC, sMCI, cMCI and AD groups (21); the classification accuracies of AD-NC was 91.02%, MCI-NC was 73.2%, and sMCI-cMCI was 74.82%. Based on the MRI and PET images, a multimodal stacked deep polynomial network was constructed to extract features and the SVM classifier was applied for two-group classification between NC, sMCI, cMCI and AD groups (22). Similar to this study, MRI, PET and cerebrospinal fluid (CSF) biomarkers were considered using a deep sparse multi-task learning scheme (23) for feature selection and a SVM classifier was explored for discriminative analysis on two-group classification for NC, sMCI, cMCI and AD groups (AD-NC 95.09%, MCI-NC 78.77%, cMCI-sMCI 73.04%). The authors also tried three-group and four-group classifications and obtained accuracy measures of 62.93% for AD/MCI/NC classification, and 53.72% for AD/cMCI/sMCI/NC classification. A multimodal neuroimaging feature learning and fusion method (24) was employed for classification and showed a 91.4% accuracy for NC-AD, an 82.1% accuracy for NC-MCI, and a 53.79% accuracy for AD/cMCI/sMCI/NC. A deep belief network was introduced for early diagnosis of AD; the accuracy and AUC were respectively 0.9 and 0.95 for AD-NC classification; 0.84 and 0.91 for sMCI-AD classification, 0.83 and 0.95 for NC-cMCI classification (25). Notably, Liu et al. (26) proposed a landmark-based deep multi-instance learning scheme for NC, sMCI, cMCI and AD classification and MCI conversion prediction. The authors combined landmarks extracted by group-level statistical analysis with patches in 3D CNN models and obtained very promising results.
Nevertheless, most of the existing studies focus on two-group classification and the models did acquire good results, but they performed poorly in multiple-group classification. In addition, MCI conversion prediction still remains to be comprehensively investigated. For data-driven learning methods, a large quantity of well-annotated datasets with representative data distribution characteristics was essential to learning more accurate or generalizable models (18). To alleviate the problem of limited image data for training, data augmentation was proposed to improve the network performance by intentionally producing more training data from the original data, such as the common methods that performed horizontal or vertical flip, rotation or reflection and shift on images (27), or the random sampling of a certain number of slices of 2D images from the 3D MRI volume of each subject (28). Inspired by the image integration method of Shin (20), a novel data augmentation strategy which selects 3 slices from 3D volume data with a certain interval to combine a RGB color image was adopted. This augmentation strategy used the information of training data sufficiently, so as to meet the requirement of 3-channel input by CNN architectures. Furthermore, the transfer learning technique that performed unsupervised pre-training on natural images and fine-tuning on medical target images by deep learning models, was designed and finally proven to overcome limited dataset problem. This accomplishment opened up new perspectives and possibilities in the medical domain (20).
In this paper, we explored the process for early diagnosis of probable AD with multiple states, and further predicted the conversion time point from MCI to AD for effective risk estimate by using CNN architectures, investigated with transfer learning approach. To alleviate the limitation of original MRI, a data augmentation strategy using random views aggregation was adopted to increase the training dataset. It was aimed to provide effective information for early therapeutic intervention of patients with probable AD and AD-related neurodegeneration. Two CNN architectures including CaffeNet and GoogleNet were compared and evaluated in discriminative analysis among compared groups and prediction of conversion risk of patients with MCI.
Methods
Participants
Patients with MCI (n=307) and normal controls (NC) (n=150) from the Alzheimer’s Disease Neuroimaging Initiative (ADNI) database (http://adni.loni.usc.edu/) were followed annually with MR image data, clinical evaluations and neuropsychological testing for at least 3 years, and clinical dementia rating (CDR) and mini-mental state examination (MMSE) were tracked (29). The obtained datasets, including standard T1-weighted images, were acquired according to the ADNI acquisition protocol (30). Scanning from 3 different Tesla scanners, General Electric (GE) Healthcare, Philips Medical Systems, and Siemens Medical Solutions, were based on identical scanning parameters. Anatomical scans were acquired using volumetric 3D MPRAGE sequence (TR =2 s, TE =2.63 ms, FA =9°, TI =900 ms, FOV =25.6 cm, 256×256×160, 1 mm ×1 mm ×1.2 mm). All the images were preprocessed according to a number of steps detailed under the ADNI website (http://adni.loni.usc.edu/methods/mri-analysis/mri-pre-processing/), which included Gradwarp (geometry distortion due to gradient non-linearity), intensity inhomogeneity correction due to B1 filed non-uniformity, and N3 histogram peak sharpening (reduce intensity non-uniformity due to the wave or the dielectric effect). We did not apply any further preprocessing such as grey matter (GM) or white matter (WM) segmentation.
According to whether the MCI subjects were converted into AD within 3 years, they were categorized into sMCI (keep stable) and cMCI (converted into AD) groups. MRI were acquired at 5 time points including the 6th month (6m), the 12th month (12m), the 18th month (18m), the 24th month (24m), and the 36th month (36m). Detailed demographic information and clinical status are shown in Table 1. There was no significant difference in age and gender as revealed via analysis of chi-square test and one-way ANOVA, respectively (P>0.01).

Full table
CNNs
Recently, CNNs have exhibited outstanding image classification performance in the ImageNet Large Scale Visual Recognition Challenge (ILSVRC). The tremendous success of CNNs was attributed to the improved algorithms that learned rich mid-level image representations as opposed to hand-designed low-level features used in other methods. The CNNs primarily were composed of convolutional layers, pooling layers, normalization layers and fully connected (FC) layers. The convolutional layers, specifically, played a major role in the CNN architecture with numbers of weights and biases parameters that consisted of a set of learnable filters, which computed each dot product between its weight and the connected input region as neurons output. Furthermore, it updated the parameters during the back-propagation optimization procedure by optimizing the whole cost function with the stochastic gradient descent (SGD) algorithm. The calculation of a single output of convolutional layer was:
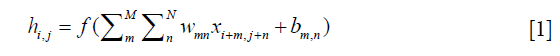
x was the input, w was one set of shared parameters of size M × N, b was the bias, h was the output neuron, m and n denoted the parameter indices, and i and j denoted the input indices. Generally, an element-wise activation function without changing the size of the image volume followed, which was named as the rectified linear unit (ReLU) layer (31). This significantly accelerated the training phase and prevented overfitting, and described as follow:

Afterwards, the pooling layers were usually inserted as max pooling or average pooling to execute a down-sampling operation along the spatial dimensions, in order to simplify network hyper-parameters and avoid overfitting. Here, we considered the max pooling to reduce vector Hk for a single scalar f (Hk), making the output into size P × Q. The down-sampling function was described as follow:

Additionally, the normalization layers applied local response normalization (LRN) to create a competition mechanism of local neuron activity, making the larger value of the response relatively larger, and inhibiting other neurons with smaller feedback; thus, the generalization ability of the model was enhanced. Here was the definition:
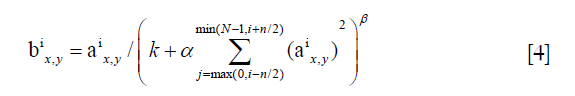
a represented the output after the convolution layer (including the convolution operation and the pooling operation), b represented the output of normalization, i was the ith kernel map, x, y were the indices, n was the number of kernel maps that are adjacent to the same location, N was the total number of kernels, and k, n, α, β were all hyper-parameters, which were usually set to k =2, n =5, α =1×e−4, β =0.75.
Finally, the FC layers made the last generated feature maps link together, and eventually adjusted the output nodes numbers to meet the binary class or multi-class by classification requirements. The input x and the output y were connected by the linear weights WFC that are shown in Equation [5]. Meanwhile, the dropout technique that stochastically set a number of the input neurons or hidden neurons to be zero to reduce the co-adaptations of the neurons, was regarded as a kind of regularization inserted in FC layers.

In this study, we achieved the rapid training of CNN via a fast open source deep learning framework called Caffe (31) and the NVIDIA DIGITS (deep learning GPU training system) tool, based on the operating system of Ubuntu 14.04, using Dell workstation with Intel Xeon E5-2690 v4 (central processing unit, CPU), 128 GB random access memory and NVIDIA Quadro M4000 (GPU). As described in previous studies, deeper CNN architectures with different model training parameter values were developed to recognize target objects from high volume data, such as LeNet-5 (32), AlexNet (ImageNet) (18), ZF Net (33), GoogleNet (34), VGGNet (35) and ResNet (36). Among them, CaffeNet, an adaptation of the well-known AlexNet, and GoogleNet have been commonly used for object recognition and classification.
CaffeNet
As a slightly modified version of the typical CNN architecture of AlexNet, the CaffeNet demonstrated a better performance by switching some layers to reduce the memory footprint and increasing the bias-filter value (31). This network with approximately 60 million free parameters consists of 5 convolutional layers (conv1 to conv5), 3 following pooling layers (pool1, pool2 and pool5), 3 CF layers (FC6 to FC8), and a softmax (multinomial logistic regression) classifier, as shown in Figure 1. In this study, the model was set for 400 epochs and initiated for SGD with gamma =0.1, momentum =0.9 and base learning rate =0.001, which dropped in steps by a factor of gamma in each iteration. The final CF layer FC8 was replaced by three-output class, and it was initialized with random weights and freshly trained in order to accommodate the new object categories.

GoogleNet
The GoogleNet model as the current state-of-the-art CNN framework proposed for the ILSVRC challenge, achieved 5.5% top-5 classification error on the ImageNet challenge in 2014, compared to AlexNet’s 15.3% top-5 classification error. As shown in Figure 2, the architecture of GoogleNet is significantly complex and deep, consisting of a 22-layer architecture. Despite the improvement of accuracy by increasing the size of layers, two major issues arose, including the overfitting for the numbers of hyper parameters and the increase of interactions with computational resources for uniform increases in network size. The GoogleNet worked by creating an inception architecture as a sparsely connected architecture rather than a FC network, which allowed for a noteworthy increase in unit amount at each layer through global dimensionality reduction prior to costly convolutions with larger patch sizes, thus keeping the computational complexity under control at later stages. Composed of 6 convolution layers and one pooling layer in each module, 9 inception modules, together with convolution layers and pooling layers, formed the GoogleNet network (Figure 2). The detailed structure of inception modules is shown in Figure 3. Also, we employed the model with 400 epochs and hyper-parameters of gamma =0.1, momentum =0.9 and base learning rate =0.001, and step learning rate decreased progressively with a factor of gamma from learning rate were employed.


Transfer learning strategy
CaffeNet and GoogleNet can be either learned from scratch or fine-tuned from pre-trained models. On account of the requirements to a large amount of annotated image samples for estimating millions of learning parameters from scratch, problems with limited training data prompted the emergence of transfer learning, which aimed to transfer knowledge between one domain-specific task to another analogical task (37). In a practical setting, the CNN network was pre-trained on the source task of ImageNet for the optimized weights of its layers, and then transferred to another target task to avoid the need for large amounts of data. It has been proved to be effective for achieving state-of-the-art performance in many medical applications (20,38-40). Due to the limited data set in this study, this technique was employed to learn the appropriate salient features for MR-based imaging classification, where all CNN layers except for the last were fine-tuned with a learning rate using 1/10 of the default learning rate. The last fully-connected layer was randomly initialized and freshly trained, in order to accommodate the new object categories in this study. Its learning rate was set to 1/100 of the default value.
Data augmentation
In addition to the initialization parameters with a transform learning approach, deep learning also requires a large number of training data to fine-tune the complex network parameters so as to achieve the best classification accuracy. We adopted a novel strategy that combined 3 slices into an RGB color image as 3-channel data to meet the requirement of the CNN architectures. First, the MR scans with Neuroimaging Informatics Technology Initiative (NIfTI) format were loaded into the Matlab (version R2013a) platform. Then, from among about 160 slices of raw MR scans of each subject, we discarded the first and last 15 slices without anatomical information, resulting in about 130 slices for each subject. Next, we selected 48 different slices randomly from the remaining slices with the interval of 4, and thus generated 16 RGB color images for each subject. Third, the selected slices were converted into portable network graphics (PNG) format. Finally, all of the RGB color images were resized to 256×256 pixels and converted to the Lightning Memory-Mapped Database (LMDB) for high throughput of the CaffeNet deep learning platform. To ensure the robustness of the model, five random datasets were created to repeat the training and testing of the CNN classifiers (5-fold cross-validation). The flow chart for this is shown as in Figure 4.

Results
Differential diagnosis of MCI
According to aforementioned data augmentation, all baseline MR data were expanded to up to 7,200 slices (4,800 for training, 2,400 for testing) for 150 NC subjects, 7,200 slices (4,800 for training, 2,400 for testing) for 150 patients with sMCI, and 7,536 slices (5,024 for training, 2,512 for testing) for 157 patients with cMCI. During the training model, embedded five-fold cross validation was employed to train a robust model. The performance of multi-class classification is displayed in Figure 5 and Table 2, which illustrates that the GoogleNet acquired accuracy scores of 97.58%, 67.33% and 84.71% in NC, sMCI and cMCI discrimination respectively, whereas the CaffeNet obtained high accuracy scores of 98.71%, 72.04% and 92.35% in the NC, sMCI and cMCI classification respectively.


Full table
Conversion time prediction of MCI
For the cMCI group, from 157 subject’s data, a total of 2,512 baseline images were produced and converted from NIfTI format to PNG format. These data were divided into 368 images for the 6m group, 720 images for the 12m group, 480 images for the 18m group, 544 images for the 24m group and the remaining 400 images were placed in the 36m group. Using the similar parameters in the aforementioned classification, the traces of training, validation loss and validation accuracy of CaffeNet (Table 3, Figure 5A) and GoogleNet (Figure 5B) were obtained. It exhibits a validation accuracy of more than 95% for CaffeNet, and about 85% for GoogleNet.

Full table
In the prediction task, 5-fold validation was also applied in 2 CNN models. Prediction accuracy scores and detailed predictions of two CNN models are shown in Table 3.
The conversion time point from MCI to AD on the basis of baseline data was predicted with a higher accuracy from 95.42% to 97.01% respectively, by CaffeNet and from 71.25% to 83.25% respectively, by GoogleNet.
Discussion
In this study, two robust pipelines were explored for discriminative analysis between patients with different MCI and healthy controls, and further conversion risk estimation from MCI to AD. So as to meet the requirement of the 3-channel input by CNN architectures, an alternative to the conventional data augmentation methods (such as flipping, rotating and reflecting) was adopted. This novel data augmentation strategy selects 3 slices from the 3D volume data with a certain interval to randomly create a RGB color image. Using this approach, the augmentation could not only use information of training data efficiently, but also avoid overfitting in the training procedure.
In the 3-way classification of sMCI, cMCI and healthy NCs from the ADNI dataset, the overall accuracy scores of 87.78% and 83.23% were obtained by CaffeNet and GoogleNet respectively. Notably, the CaffeNet acquired the highest accuracy of 98.71%, 72.04% and 92.35% in NC, sMCI and cMCI classification respectively. With regard to the relative low accuracy of sMCI recognition, some images belonging to sMCI were incorrectly identified as cMCI, whereas a few of images belonging to cMCI were misidentified as sMCI, and almost all of images belonging to the NC group were identified successfully. These misidentifications can be attributed to the similarities of brain structure and changes at baseline between sMCI and cMCI. As a prodromal stage of AD, sMCI exhibited similar structural brain changes with cMCI at baseline (41,42), and the differences increased among groups in longitudinal studies (43-45). However, the morphological brain features of both sMCI and cMCI exhibited significant differences with the NC group at baseline. Furthermore, differing from the regression analysis of previous studies, a novel risk estimation approach was proposed for early prediction from cMCI to AD based on two CNN architectures. These cutting-edge networks achieved an average accuracy of 96.18% with CaffeNet and 79.18% with GoogleNet in predicting the status of patients in the 3-year follow-up, and even predicted the conversion time points effectively, which exceeded the cross-validated accuracy of 72% via logistic regression models (46).
In addition, the two CNNs were compared for disease classification and progressive prediction. The results showed that the CaffeNet with 8-layers was superior to the GoogleNet with 22-layers, which was contrary to the compared results of pulmonary tuberculosis classification on chest radiographs (47). Since both CaffeNet and GoogleNet were trained and tested on an abundant number of routine images rather than medical images, the two networks showed exceptional performance in natural image analysis including segmentation and recognition. However, the limited amount of medical data in this study restricted us from exploiting the full advantages of GoogleNet and caused difficulties in finding the optimal parameters of the network with deep layers.
Although an increased sample amount would improve the performance of GoogleNet, it is usually difficult to obtain a large amount of medical images, and thus data augmentation and transfer learning are instead considered in most studies. Another possible alternative is ROI (region of interest) selection instead of common patch, as the ROI can reveal salient anatomical information and facilitate the discriminative analysis for the CNNs; thus, the performance might be enhanced through the speeding up of the convergence rate or improving accuracy.
Using data augmentation and transfer learning, we were able to train the CNNs with training data of 7,312 color images in this study. The transfer learning and data augmentation techniques were verified to be effective, and enhance generality and offer promising potential in clinical application.
Finally, although our proposed CNN architectures achieved promising results in both MCI multi-classification and conversion risk prediction, the work had several limitations. First, similar to most of the research in this area, the sample size was still too small for deep CNNs; 457 subjects including 150 NC, 150 sMCI and 157 cMCI were investigated. Second, preprocessing such as skull removing, tissue segmentation and normalizing was not performed. A couple of studies reported that data normalization can improve performance, however, the challenge was the high complexity and inconsistency due to complicated procedures and a large number of control parameters. Third, only structural MRI were explored, but PET images and other biomarkers such as Tau protein, Aβ protein could have provided supplementary information for discriminative analysis and development prediction. Finally, the CNN architectures were based on patch classification, where the anatomical location of the patch was often unknown to the network, even though anatomical information is essential to focus localization and accurate diagnosis.
In future work, we need emphasize the ROI (region of interest) instead of the common patch. In this way, the ROIs can be extracted from the group-level statistical analysis, which contains the most discriminative ability. These ROIs are considered as patches for training and testing in CNN models, and can reveal salient anatomical information, while providing effective explanation in diagnosis. ROIs’ extraction also requires more preprocessing including skull removing, tissue segmentation and normalization. It remains to be verified if the performance can be enhanced through speeding up the convergence rate or improving accuracy. In addition, 3D CNN architecture will further be explored since it involves three-dimensional topological structures, which are discarded in common 2D CNN models.
Conclusions
We exploited two different architectures of CNN framework, CaffeNet and GoogleNet, to differentiate sMCI and cMCI from the NC group, and extensively evaluated the conversion risk from MCI to AD. The CaffeNet and GoogleNet architectures, using the proposed transfer learning strategy, achieved 87.78% and 83.23% average accuracy scores in three-way classification respectively. Moreover, conversion time point was effectively predicted with an overall accuracy of 96.18%. To conclude, these findings open up a new perspective in risk assessment of patients with MCI in early stages. As they exhibited great potential in differentiating 3 groups, and assessing the conversion risk at assigned time points of MCI, our proposed pipelines could serve as promising algorithms in characterizing objective biomarkers.
Acknowledgements
Funding: This work was supported by the National Natural Science Foundation of China (31371008), the Science and Technology Planning Project of Guangdong Province (2015A02024006), the Science and Technology Program of Guangdong (2016B010108003), the Guangzhou Bureau of Science and Technology (201604020170) and the China Scholar Council. Data collection and sharing for this project was funded by the Alzheimer’s Disease Neuroimaging Initiative (ADNI) (National Institutes of Health Grant U01 AG024904) and DOD ADNI (Department of Defense award number W81XWH-12-2-0012). The ADNI is funded by the National Institute on Aging, the National Institute of Biomedical Imaging and Bioengineering, and from generous contributions from the following: the Alzheimer’s Association; the Alzheimer’s Drug Discovery Foundation; BioClinica, Inc.; Biogen Idec Inc.; Bristol-Myers Squibb Company; Eisai Inc.; Elan Pharmaceuticals, Inc.; Eli Lilly and Company; F. Hoffmann-La Roche Ltd and its affiliated company Genentech, Inc.; GE Healthcare; Innogenetics, N.V.; IXICO Ltd.; Janssen Alzheimer Immunotherapy Research & Development, LLC.; Johnson & Johnson Pharmaceutical Research & Development LLC.; Medpace, Inc.; Merck & Co.,Inc.; Meso Scale Diagnostics, LLC.; NeuroRx Research; the Novartis Pharmaceuticals Corporation; Pfizer Inc.; Piramal Imaging; Servier; Synarc Inc.; and the Takeda Pharmaceutical Company. The Canadian Institutes of Health Research is providing funds to support ADNI clinical sites in Canada. Private sector contributions are facilitated by the Foundation for the National Institutes of Health (www.fnih.org).
Footnote
Conflicts of Interest: The grantee organization is the Northern California Institute for Research and Education, and the study is coordinated by the Alzheimer’s Disease Cooperative Study at the University of California, San Diego. ADNI data are disseminated by the Laboratory for NeuroImaging at the University of Southern California. The other authors have no conflicts of interest to declare.
References
- Alzheimer's A. 2015 Alzheimer's disease facts and figures. Alzheimers Dement 2015;11:332-84. [Crossref] [PubMed]
- Petersen RC, Smith GE, Waring SC, Ivnik RJ, Tangalos EG, Kokmen E. Mild cognitive impairment: clinical characterization and outcome. Arch Neurol 1999;56:303-8. [Crossref] [PubMed]
- Tong T, Gray K, Gao QQ, Chen L, Rueckert D, Initia ADN. Multi-modal classification of Alzheimer's disease using nonlinear graph fusion. Pattern Recognition 2017;63:171-81. [Crossref]
- Saman S, Tofighi G. DeepAD: Alzheimer's Disease Classification via Deep Convolutional Neural networks using MRI and fMRI. Available online: https://www.biorxiv.org/content/biorxiv/early/2016/08/21/070441.full.pdf
- Jack CR Jr. Alzheimer disease: new concepts on its neurobiology and the clinical role imaging will play. Radiology 2012;263:344-61. [Crossref] [PubMed]
- Eskildsen SF, Coupe P, Garcia-Lorenzo D, Fonov V, Pruessner JC, Collins DL. Initi AsDN. Prediction of Alzheimer's disease in subjects with mild cognitive impairment from the ADNI cohort using patterns of cortical thinning. Neuroimage 2013;65:511-21. [Crossref] [PubMed]
- Park M, Moon WJ, Structural MR. Imaging in the Diagnosis of Alzheimer's Disease and Other Neurodegenerative Dementia: Current Imaging Approach and Future Perspectives. Korean J Radiol 2016;17:827-45. [Crossref] [PubMed]
- Tripoliti EE, Fotiadis DI, Argyropoulou M. A supervised method to assist the diagnosis and classification of the status of Alzheimer's disease using data from an fMRI experiment. Conf Proc IEEE Eng Med Biol Soc 2008;2008:4419-22. [PubMed]
- Lee SH, Yu D, Bachman AH, Lim J, Ardekani BA. Application of fused lasso logistic regression to the study of corpus callosum thickness in early Alzheimer's disease. J Neurosci Methods 2014;221:78-84. [Crossref] [PubMed]
- Zhang D, Wang Y, Zhou L, Yuan H, Shen D. Alzheimer's Disease Neuroimaging I. Multimodal classification of Alzheimer's disease and mild cognitive impairment. Neuroimage 2011;55:856-67. [Crossref] [PubMed]
- Guyon I, Weston J, Barnhill S, Vapnik V. Gene Selection for Cancer Classification using Support Vector Machines. Mach Learn 2002;46:389-422. [Crossref]
- Ardekani BA, Bermudez E, Mubeen AM, Bachman AH. Alzheimer's Disease Neuroimaging I. Prediction of Incipient Alzheimer's Disease Dementia in Patients with Mild Cognitive Impairment. J Alzheimers Dis 2017;55:269-81. [Crossref] [PubMed]
- Lee SH, Bachman AH, Yu D, Lim J, Ardekani BA. Predicting progression from mild cognitive impairment to Alzheimer's disease using longitudinal callosal atrophy. Alzheimers Dement (Amst) 2016;2:68-74. [Crossref] [PubMed]
- Young J, Modat M, Cardoso MJ, Mendelson A, Cash D, Ourselin S. Alzheimer's Disease Neuroimaging I. Accurate multimodal probabilistic prediction of conversion to Alzheimer's disease in patients with mild cognitive impairment. Neuroimage Clin 2013;2:735-45. [Crossref] [PubMed]
- Gavidia-Bovadilla G, Kanaan-Izquierdo S, Mataro-Serrat M, Perera-Lluna A. Alzheimer's Disease Neuroimaging I. Early Prediction of Alzheimer's Disease Using Null Longitudinal Model-Based Classifiers. PLoS One 2017;12:e0168011. [Crossref] [PubMed]
- Shi B, Wang Z, Liu J. Distance-informed metric learning for Alzheimer's disease staging. Conf Proc IEEE Eng Med Biol Soc 2014;2014:934-7. [PubMed]
- Bin Tufail A, Abidi A, Siddiqui AM, Younis MS. Multiclass classification of initial stages of Alzheimer's disease using structural MRI phase images. 2012:317-21.
- Krizhevsky A, Sutskever I, Hinton GE. ImageNet classification with deep convolutional neural networks. International Conference on Neural Information Processing Systems: Curran Associates Inc., 2012:1097-105.
- Setio AA, Ciompi F, Litjens G, Gerke P, Jacobs C, van Riel SJ, Wille MM, Naqibullah M, Sanchez CI, van Ginneken B. Pulmonary Nodule Detection in CT Images: False Positive Reduction Using Multi-View Convolutional Networks. IEEE Trans Med Imaging 2016;35:1160-9. [Crossref] [PubMed]
- Shin HC, Roth HR, Gao M, Lu L, Xu Z, Nogues I, Yao J, Mollura D, Summers RM. Deep Convolutional Neural Networks for Computer-Aided Detection: CNN Architectures, Dataset Characteristics and Transfer Learning. IEEE Trans Med Imaging 2016;35:1285-98. [Crossref] [PubMed]
- Suk HI, Lee SW, Shen D. Alzheimer’s Disease Neuroimaging Initiative. Deep ensemble learning of sparse regression models for brain disease diagnosis. Med Image Anal 2017;37:101-113. [Crossref] [PubMed]
- Shi J, Zheng X, Li Y, Zhang Q, Ying SH. Multimodal Neuroimaging Feature Learning With Multimodal Stacked Deep Polynomial Networks for Diagnosis of Alzheimer's Disease. IEEE J Biomed Health Inform 2018;22:173-183. [Crossref] [PubMed]
- Suk HI, Lee SW, Shen D. Alzheimer’s Disease Neuroimaging Initiative. Deep sparse multi-task learning for feature selection in Alzheimer's disease diagnosis. Brain Struct Funct 2016;221:2569-87. [Crossref] [PubMed]
- Liu S, Liu S, Cai W, Che H, Pujol S, Kikinis R, Feng D, Fulham MJ. ADNI. Multimodal Neuroimaging Feature Learning for Multiclass Diagnosis of Alzheimer's Disease. IEEE Trans Biomed Eng 2015;62:1132-40. [Crossref] [PubMed]
- Ortiz A, Munilla J, Gorriz JM, Ramirez J. Ensembles of Deep Learning Architectures for the Early Diagnosis of the Alzheimer's Disease. Int J Neural Syst 2016;26:1650025. [Crossref] [PubMed]
- Liu M, Zhang J, Adeli E, Shen D. Landmark-based deep multi-instance learning for brain disease diagnosis. Med Image Anal 2018;43:157-68. [Crossref] [PubMed]
- Dong H, Yang G, Liu F, al. e. Automatic Brain Tumor Detection and Segmentation Using U-Net Based Fully Convolutional Networks. Conference on Medical Image Understanding and Analysis, Cham: Springer, 2017:506-17.
- Liu F, Shen C. Learning Deep Convolutional Features for MRI Based Alzheimer's Disease Classification. Available onlie: https://arxiv.org/abs/1404.3366
- Arevalo-Rodriguez I, Smailagic N, Roque IFM, Ciapponi A, Sanchez-Perez E, Giannakou A, Pedraza OL, Bonfill Cosp X, Cullum S. Mini-Mental State Examination (MMSE) for the detection of Alzheimer's disease and other dementias in people with mild cognitive impairment (MCI). Cochrane Database Syst Rev 2015.CD010783. [PubMed]
- Jack CR Jr, Bernstein MA, Fox NC, Thompson P, Alexander G, Harvey D, Borowski B, Britson PJ. J LW, Ward C, Dale AM, Felmlee JP, Gunter JL, Hill DL, Killiany R, Schuff N, Fox-Bosetti S, Lin C, Studholme C, DeCarli CS, Krueger G, Ward HA, Metzger GJ, Scott KT, Mallozzi R, Blezek D, Levy J, Debbins JP, Fleisher AS, Albert M, Green R, Bartzokis G, Glover G, Mugler J, Weiner MW. The Alzheimer's Disease Neuroimaging Initiative (ADNI): MRI methods. J Magn Reson Imaging 2008;27:685-91. [Crossref] [PubMed]
- Jia Y, Shelhamer E, Donahue J, Karayev S, Long J, Girshick R, Guadarrama S, Darrell T. Caffe: Convolutional Architecture for Fast Feature Embedding. Available online: https://arxiv.org/pdf/1408.5093.pdf
- Haykin S, B. K. GradientBased Learning Applied to Document Recognition. Wiley-IEEE Press, 2009.
- G LD. Distinctive Image Features from Scale-Invariant Keypoints. Kluwer Academic Publishers, 2004.
- Szegedy C, Liu W, Jia Y, Sermanet P, Reed S, Anguelov D, Erhan D, Vanhoucke V, Rabinovich A. Going deeper with convolutions. 2015 IEEE Conference on Computer Vision and Pattern Recognition (CVPR) 2015;1-9.
- Simonyan K, Zisserman A. Very Deep Convolutional Networks for Large-Scale Image Recognition. Computer Science 2014. Available online: https://arxiv.org/abs/1409.1556
- He K, Zhang X, Ren S, Sun J. Deep Residual Learning for Image Recognition. Available online: https://www.cv-foundation.org/openaccess/content_cvpr_2016/papers/He_Deep_Residual_Learning_CVPR_2016_paper.pdf
- Pan SJ, Yang Q. A Survey on Transfer Learning. IEEE Trans Knowl Data Eng 2010;22:1345-59. [Crossref]
- Tajbakhsh N, Shin JY, Gurudu SR, Hurst RT, Kendall CB, Gotway MB, Liang J. Convolutional Neural Networks for Medical Image Analysis: Full Training or Fine Tuning? IEEE Trans Med Imaging 2016;35:1299-312. [Crossref] [PubMed]
- Wimmer G, Vécsei A, Uhl A, editors. CNN transfer learning for the automated diagnosis of celiac disease. 2016 Sixth International Conference on Image Processing Theory, Tools and Applications (IPTA), 2016:12-15.
- Cheng PM, Malhi HS. Transfer Learning with Convolutional Neural Networks for Classification of Abdominal Ultrasound Images. J Digit Imaging 2017;30:234-43. [Crossref] [PubMed]
- Wu C, Guo S, Lai C, Wu Y, Zhao D, Jiang X. Discriminant analysis of multiple cortical changes in mild cognitive impairment. Tokyo, Japan: Eighth International Conference on Graphic and Image Processing, 2016.
- Arbabshirani MR, Plis S, Sui J, Calhoun VD. Single subject prediction of brain disorders in neuroimaging: Promises and pitfalls. Neuroimage 2017;145:137-65. [Crossref] [PubMed]
- Guo S, Lai C, Wu C, Cen G. Alzheimer's Disease Neuroimaging I. Conversion Discriminative Analysis on Mild Cognitive Impairment Using Multiple Cortical Features from MR Images. Front Aging Neurosci 2017;9:146. [Crossref] [PubMed]
- Chetelat G, Landeau B, Eustache F, Mezenge F, Viader F, de la Sayette V, Desgranges B, Baron JC. Using voxel-based morphometry to map the structural changes associated with rapid conversion in MCI: a longitudinal MRI study. Neuroimage 2005;27:934-46. [Crossref] [PubMed]
- Misra C, Fan Y, Davatzikos C. Baseline and longitudinal patterns of brain atrophy in MCI patients, and their use in prediction of short-term conversion to AD: results from ADNI. Neuroimage 2009;44:1415-22. [Crossref] [PubMed]
- Teipel SJ, Kurth J, Krause B, Grothe MJ. Alzheimer's Disease Neuroimaging I. The relative importance of imaging markers for the prediction of Alzheimer's disease dementia in mild cognitive impairment - Beyond classical regression. Neuroimage Clin 2015;8:583-93. [Crossref] [PubMed]
- Lakhani P, Sundaram B. Deep Learning at Chest Radiography: Automated Classification of Pulmonary Tuberculosis by Using Convolutional Neural Networks. Radiology 2017;284:574-82. [Crossref] [PubMed]

