
Quantification of liver iron concentration using the apparent susceptibility of hepatic vessels
Introduction
Iron is a necessary component of human physiology. However, excessive iron accumulation may lead to damage due to the formation of toxic free radicals (1-3). Particularly, iron overload in the liver may cause cirrhosis, tissue damage or liver failure (4). Quantification of the liver iron concentration (LIC) is indispensable in the monitoring of chelation therapy for patients with iron overload resulting from hereditary hemochromatosis or chronic blood transfusion (4,5). Conventionally, MRI based LIC measurement is done by mapping the R2 or R2* relaxation rates (6-8). However, the accuracy and precision of the R2 mapping based method is affected by the long scan time and the non-linear relation between relaxation rate and iron concentration, while the accuracy of the R2* mapping based method is limited by the rapid signal decay for high iron concentration (4,8). Furthermore, both R2 and R2* are dependent on the main field strength (4,9).
Quantitative susceptibility mapping (QSM) is a method for extracting tissue susceptibility from the magnetic field variation using data collected with a gradient-echo sequence (10-13). It has great potential in improving both the accuracy and precision in the quantification of in vivo iron content, as demonstrated in various studies focused on the brain (14-18). However, there are a few technical challenges in applying the conventional QSM algorithms to the abdomen, including the difficulties in removing the background field in the presence of multiple air-tissue interfaces and solving the ill-posed inverse problem of QSM (19,20). Several methods have been proposed to overcome these obstacles, mainly by using a simplified model of the relationship between the susceptibility distribution and magnetic field variation (19,21,22). In a recent study, the conventional 3D dipole kernel based QSM algorithm was adapted for quantifying LIC, using the abdominal fat as the reference for estimating the susceptibility of liver tissue (20). Both phase unwrapping and background field removal was performed in the whole abdominal region and the robustness could be compromised by the noisy regions outside the liver. Furthermore, 3D full coverage of the liver was required by that method, which was achieved by lowering the imaging resolution. As a result, even though the susceptibility measured using QSM correlated linearly with that measured using superconducting quantum interference device (SQUID), the former was found to be severely under-estimated (23).
In fact, QSM only provides a relative estimation of susceptibility, since the field variation of a vessel is dependent on the difference between susceptibilities inside and outside that vessel (24). Hence, we hypothesize that the liver vessels can be used as in vivo probes for estimating LIC. This idea was used in an earlier study, but in that study the susceptibility was calculated using a simplified model, instead of using the 3D dipole kernel (21). In this paper, we present a QSM based LIC quantification method, by measuring the apparent susceptibilities of the hepatic vessels. This method has the potential to improve the accuracy of LIC quantification.
Methods
In QSM, the susceptibility map  is calculated from the field variation map based on the following equation (10,11,25):
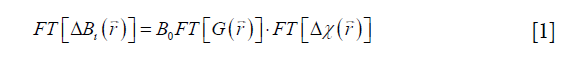
where FT represents the Fourier transform, the local field variation,
  the point-dipole response, and “∙” the point-wise multiplication. Specifically,
 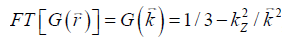 , assuming that the main field is in the z direction. Due to the zeros in
  along the magic angles, extracting from is an ill-posed inverse problem. This can be solved efficiently by using the geometry constrained iterative susceptibility weighted imaging and mapping (iSWIM) algorithm (26). The only a priori information required by this algorithm is the vessel geometry which be extracted from the magnitude images. For a vessel in the liver, (referred to as the apparent susceptibility in this paper) actually reflects the difference between the susceptibilities inside and outside that vessel (24):

With  obtained from Eq. [2], LIC can be estimated using the linear relationship between iron concentration and the susceptibility. Particularly, in this paper, the LIC was calculated as:

where the unit of LIC is mg iron/g dry tissue, 4.1 is the conversion factor from (g wet tissue) to (g dry tissue) (27), and 0.92 is the conversion factor between susceptibility and iron determined using ferritin phantoms in an earlier study (16).
Simulations
To validate the proposed algorithm, a 3D numerical liver model (Figure 1) was built using one dataset collected on a healthy volunteer. First, the geometry of the liver was extracted from the magnitude images with voxel size 1.125×1.125×3 mm3 and then interpolated to 0.5625 mm isotropic resolution. The susceptibility of the vessels was set to 0.45 ppm, corresponding to the susceptibility of venous blood with 70% oxygen saturation and Hct 0.44 (10), while the susceptibility of the liver tissue surrounding the vessels was varied from 0 to 5 ppm, with a step size 0.1 ppm. The susceptibility of the air in both the lung and the regions outside the body was set to 9.4 ppm, and the susceptibility in the abdominal regions outside the liver was set to 0. Next, the phase images were created using the fast forward field calculation (25,28). For generating the magnitude images, the R2* of the veins was set to 40 s−1 (29), while the R2* of the liver tissue was calculated using the relationship between R2* and iron concentration reported in earlier studies which employed truncation based fitting for reducing the background noise (9,30):


To evaluate the influence of resolution and the differences between 3D and 2D acquisition, lower resolution magnitude and phase images were created by collapsing the high-resolution complex data. Specifically, two resolutions were simulated: (I) 3D data acquisition with 1.125 mm isotropic resolution with TE =2.5 ms; (II) 2D data acquisition with in-plane resolution =1.125 mm, slice thickness =2.8125 mm, spacing between slices =3.375 mm, and TEs ranged from 2.5 to 15 ms with an echo spacing 2.5 ms. The gap in the 2D data was created by averaging 5 in every 6 slices of the original complex data with 0.5625 mm slice thickness. For each LIC, the simulation was performed 10 times with Gaussian noise added to real and imaginary channels of the complex data in each echo, and the signal-to-noise ratio (SNR) in the abdominal tissue regions on the magnitude images was set to 20:1. Susceptibility maps and R2* maps were generated, and the accuracy of estimating iron concentration was evaluated, as described later in the Data Processing section.

In vivo data acquisition
Eight healthy controls and 11 patients (11 females and 8 males, age ranged from 8 to 60 years, mean ± standard deviation: 37±15 years) were included in this study, with all the patients being treated with blood transfusion. This study was approved by the local Institutional Review Board and informed consents were obtained from all the subjects. In vivo data were collected on a 3T scanner (Trio, Siemens Healthcare, Erlangen, Germany), using both 2D and 3D gradient-echo sequences with breath holding. For the 2D multi-echo sequence, water/fat in-phase echo times were used. Specifically, TE ranged from 2.5 to 15 ms with echo spacing 2.5 ms, TR =154 ms, flip angle =20o, BW/pixel = 465 Hz/pixel, voxel size = 1.48×1.48×3 mm3, spacing between slices =3.6 mm, matrix size =192×256×15. For the 3D double-echo sequence, TEs =5 and 10 ms, 3D full flow compensation was used for the first echo only. TR =15 ms, FA =15o, BW/pixel =427 Hz/pixel, voxel size = 1.67×1.67×2 mm3, matrix size =192×144×16. For 12 subjects, including 8 healthy controls and 4 patients, both 2D and 3D data were acquired, in order to evaluate the effects of data acquisition on LIC quantification. For the other 7 patients, only 2D multi-echo data were acquired.
Data processing
The data processing steps for the in vivo data are illustrated in Figure 2. For the 3D double-echo data, only the phase images in the first echo were unwrapped for QSM reconstruction, using Laplacian phase unwrapping (10). For the 2D multi-echo data, the echoes with SNR >3:1 were used in the data processing. When only the first echo or the first two echoes had sufficiently high SNR, QSM reconstruction was done using the first echo’s phase images with Laplacian phase unwrapping. When more than two echoes were available, a temporal domain phase unwrapping algorithm was used (31), due to the presence of cusp artifacts (phase singularities) in the phase images. First, the inter-echo phase difference images (Δϕ) were calculated for every two neighboring echoes using complex division. Then a 3D phase unwrapping algorithm (32) was used to unwrap Δϕ. The linear phase components in Δϕ due to the bipolar readout was estimated through 3D linear fitting and was removed from both the original phase images and Δϕ, to provide the same baseline for phase images at different echoes. Next, the phase images from all the later echoes were unwrapped using both the phase images in the first echo and the unwrapped Δϕ. Finally, the field variation map was obtained using a least-squares fitting on a pixel-by-pixel basis, weighted by the square of the magnitude at different echoes. The background field induced by the air-tissue interface was removed using the Sophisticated Harmonic Artifact Reduction for Phase data (SHARP) algorithm (14) with kernel radius 2 pixels and Fourier domain threshold 0.04. The susceptibility maps were generated using the iSWIM algorithm (26,33) which consists of two steps: reconstruction of an initial susceptibility map using truncated k-space division (with k-space threshold 0.1) and an iterative update of the k-space data in the cone-of-singularities (where ). In the second step, the geometry of the vessels, extracted from the magnitude images in the longest echo included in the calculation, was used to reduce the streaking artifacts surrounding the vessels. R2* maps were generated on a pixel-by-pixel basis by first fitting the magnitude images at multiple echoes using the following model
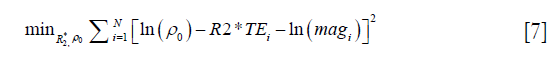
where ρ0 represents the effective proton density, and magi the magnitude at TEi. For the 2D multi-echo data, N is the total number of echoes with SNR >3:1. For the 3D double-echo data, N=2. Then the R2* maps generated using the 2D multi-echo data were refined through non-linear least squares fitting using the Levenberg-Marquardt algorithm (34).

For the simulated 3D data, QSM was performed using the phase images in the first echo with TE =2.5 ms (denoted as 3D single-echo QSM); for the simulated 2D data, QSM was performed in two ways: one using the phase images in the shortest echo (denoted as 2D single-echo QSM), and the other using the phase images in all the echoes with SNR >3:1 (denoted as 2D multi-echo QSM). The R2* maps were generated using the 2D multi-echo data only. The other data processing steps were the same as those in the in vivo data processing.
For both simulations and in vivo data, a section of the hepatic vein was chosen such that it was visible on both 2D multi-echo and 3D double-echo data, and the mean and standard deviation of Δχ of the vein were measured. The R2* values were measured in regions within 3 to 5 pixels to the edge of the selected vein. The susceptibility of the liver tissue (χliver) was estimated using Eq. [2], assuming a constant susceptibility of 0.45ppm for the veins, and was converted to LIC using Eq. [3], while the R2* were converted to LIC using Eqs. [4] and [5]. The correlation between the apparent susceptibility and the LIC estimated using R2* were evaluated. For the simulations, the measurements obtained in the 10 repetitions were averaged. For the in vivo data, a Bland-Altman analysis was also performed to study the agreement of QSM and R2* based LIC estimates (35). The data reconstruction was performed using Matlab (MathWorks, Natick, MA) on a laptop with i7 CPU and 16G RAM. The QSM reconstruction speed was around 14 s/case for 3D in vivo data and 16 s/case for 2D in vivo data.
Results
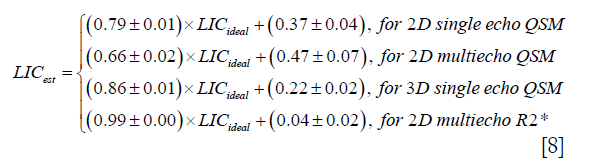
In the simulations, the apparent susceptibility of the veins (Δχ) decreased as the susceptibility of the liver tissue increased (Figure 3A). For both 2D and 3D data, under-estimation of Δχ was observed. Particularly, more severe under-estimation was observed in the 2D data than in the 3D data. For the 2D data, Δχ estimated using the first echo has higher accuracy than that estimated using multiple echoes. On the other hand, the measured R2* agreed well with the expected R2* values (Figure 3B), when at least two echoes with SNR >3:1 were available. This corresponds to LIC <6.0 mg iron/g dry tissue in the simulated data. This is also the upper limit for LIC quantification when the TE of the first echo is 5 ms, as in the 3D double-echo data in the in vivo studies. For higher LIC, only the first echo has sufficiently high SNR and R2* mapping was not possible, but single-echo QSM can still be obtained. When LIC >12.45 mg iron/g dry tissue (χliver >3.3 ppm), the SNR was not sufficient even in the shortest echo at 2.5 ms (Figure 3A,C). The LICs estimated using different methods correlated with the expected LICs well, although different levels of under-estimation were observed, especially for the QSM based methods. Specifically, the linear relationships were found to be:

As shown in Figure 3D, the uncertainties in the LICs estimated using the 3D single echo QSM approach were close to those obtained using the R2* mapping based approach, for relatively low LICs. When only 3 or even 2 echoes were available, the uncertainties for the 2D multi-echo QSM and the R2* mapping were much higher than for the 3D single-echo QSM. Additionally, the 2D single-echo QSM led to the highest uncertainties among all the methods, for relatively low LICs; however, for high LICs, the uncertainties associated with the 2D single-echo QSM and 3D single-echo QSM were similar.
In the in vivo data, the apparent susceptibilities of the hepatic veins measured from the 2D multi-echo data (Δχ2D) correlated well with those measured from the 3D double-echo data (Δχ3D) (r2=0.93), but the magnitude of Δχ2D were under-estimated relative to that of Δχ3D (Figure 4A,B). This is consistent with the simulation results. On the other hand, the R2* values of the liver tissue obtained from the 2D data agreed well with those obtained from the 3D data (Figure 4C,D). For both 3D double-echo and 2D multi-echo in vivo data, the apparent susceptibility of the hepatic vein (Δχ) correlated well with the measured R2* values of the liver tissue (Figure 5A-C). Furthermore, the LICs estimated using QSM agreed with those obtained using the R2* mapping (Figure 5D-F). Again, under-estimations in LICs were observed for the 2D multi-echo QSM (Figure 5E). The Bland-Altman plots (Figure 5G-I) demonstrates that the best agreement on LIC estimation was achieved between 3D QSM and 2D R2* mapping. Slightly worse agreement was obtained between 2D QSM and 2D R2* mapping (Figure 5H). When all subjects’ data were included, the agreement between 2D QSM and 2D R2* mapping for LIC estimation was even worse (Figure 5I). This is due to the wider range of LICs of the included subjects. This is also partly due to that R2* mapping was performed using two echoes only in several patients’ data, which leads to larger uncertainties in R2* quantification.


Compared to the healthy control, the iron overload in the patient was reflected by both the reversed sign of the apparent susceptibilities of the vessels and the increased R2* values (Figure 6). As shown a more extreme case in Figure 7, the SNR was low even in the shortest echo (2.5 ms in the 2D data). In this case, R2* mapping was not possible. Despite the low SNR of the QSM image, Δχ of the hepatic vein indicated by the red arrow can still be quantified. Specifically, Δχ was measured as −2.03±0.08 ppm. Considering the under-estimation caused by the 2D single-echo QSM, using Eqs. [2], [3] and [8], this corresponds to a LIC of 11.32 mg iron/g dry tissue. This is consistent with the observation in simulations that the upper limit of LIC which can be reliable estimated using QSM is around 12 mg iron/g dry tissue, using data collected at 2.5 ms.


Discussion
The quantification of LIC using MRI based methods has great potential, because of the non-invasiveness of these methods, the accessibility of MRI scanners, and the high resolution and local distribution of iron concentration these methods can provide. Conventionally, LIC is measured using either R2 or R2* mapping based methods. It has been shown that R2* has superior sensitivity to changes in cerebral iron content than R2 (36), and QSM has even better sensitivity than R2* (10,37,38). The great potential of QSM has already been demonstrated in a recent study, in which the conventional QSM algorithms were adapted for liver iron quantification. In that study, background field removal and the reconstruction of susceptibility map were performed in the whole abdominal region. Although strong correlation between the susceptibility of the liver and LIC was obtained, still the susceptibility was significantly under-estimated. This is largely due to partial volume effects caused by the low imaging resolution (23).
In this paper, we present an alternative QSM approach which provides more flexibility for liver imaging. Instead of quantifying the susceptibility of the liver tissue directly, the apparent susceptibility of the vessels in the liver was estimated. This makes it possible to estimate the susceptibility of the liver tissue without full coverage of the liver, and higher accuracy in susceptibility quantification can be achieved with higher imaging resolution. By restricting the QSM reconstruction to the liver region, many sources of potential artifacts in QSM are eliminated, such as the various air-tissue interfaces outside the liver and the requirement of water-fat separation to certain extent. Consequently, the data processing is significantly simplified, which leads to improved robustness. Additionally, the geometries of the vessels can be easily extracted from the magnitude images, due to both the time-of-flight effect and the relatively short T2* of the liver tissue. Using the geometries as constraints, the iSWIM algorithm can effectively reduce the streaking artifacts surrounding the vessels and improve the quantification accuracy. This method can be used on data with either single or multiple echoes. Furthermore, we demonstrated that even for data collected with 2D sequences, reasonable estimation of the apparent susceptibility of the vessels can be obtained. The under-estimation associated with 2D data was studied by simulations. Hence, the flexibility of the proposed method makes it a promising tool for both prospective and retrospective studies.
In addition, the accuracies of liver QSM using data acquired with 2D multi-echo and 3D double-echo sequences were evaluated. For QSM, the 3D double-echo sequence is preferred because of its ability to achieve higher imaging resolution and the better preserving of phase information. This is critical because the accuracy of QSM relies on the quality of phase. On the other hand, 2D sequences may lead to reduced reliability of phase information, especially when there is gap between two neighboring slices. The simulation results showed that the LICs estimated using the 2D data correlated well with the expected LICs, and the significant under-estimation can be considered as a systematic error. Although flow compensation was not applied for the 2D data acquisition, it is unlikely that this under-estimation was caused by flow induced effects, considering the relatively slow flow velocity in the hepatic vessels and the short echo time. Instead, this is more due to the lower resolution, the gap between slices and the partial volume effects. Moreover, we found that there could be more under-estimation in the measured susceptibilities, when the field variation map was extracted from multiple echoes in the 2D data instead of from the shortest echo. Being affected by partial volume effects, the relationship between phase and TE may not be linear and this could in turn caused error in estimating the field variation map from the multi-echo data, especially for structures with relatively small size, such as the vessels. Hence, it will be better to use the shortest echo than using all the echoes in data with low resolution.
Compared to the R2* mapping based method, the main advantage of QSM based method for quantifying iron concentration is related to the improved accuracy and sensitivity. As a fundamental property of tissues, magnetic susceptibility is more directly related to iron concentration than R2* (20). Particularly, while both R2 and R2* are dependent on main field strength, magnetic susceptibility is not dependent on imaging parameters and this may provide better reproducibility in LIC quantification (4,9,10). The advantage of QSM over R2* mapping is also attributed to the fact that QSM can be performed using single-echo data, while R2* mapping requires at least two echoes with sufficiently high SNR. Thus, QSM based method may help to extend the range of LIC that can be reliably determined. Based on the simulation results, the highest LIC that can be estimated is around 12 mg iron/g dry tissue (corresponding to liver tissue susceptibility around 3 ppm and R2* around 780 s−1), with TE of the shortest echo being 2.5 ms. When the TE of the shortest echo is 5 ms, the highest LIC that can be estimated is around 6 mg iron/g dry tissue. To cover the full range of LIC in patients with severe hepatic iron overload (can be up to around 40 mg iron/g dry tissue in thalassemia patients), a much shorter echo time is needed (39). For severe iron overload, there will not be sufficient SNR for regions outside the vessels even in the shortest echo. However, there will be sufficiently high SNR inside the vessels, because of their relatively longer T2*. It might be possible to use the phase inside the vessels only to estimate its susceptibility, if the air-tissue interface induced background phase components could be removed. Another way to handle these high LICs is to preserve the phase surrounding the whole liver and reconstruct the susceptibility map of the liver as a single object (40,41). Meanwhile, for the subjects involved in this paper, the LICs estimated using the proposed QSM based approach agreed well with those estimated using the R2* based approach, despite the fact that the conversion factors, used to convert susceptibility and R2* to iron concentration, were obtained in independent studies (8,9,16).
There are several limitations in this study. First, the imaging parameters were optimized for QSM only, and the R2* mapping used in this study was mainly for validation purpose. For R2* mapping based LIC quantification, usually a much shorter TE for the first echo together with short echo spacing is required. This is again achieved mainly by reducing the imaging resolution which may lead to reduced reliability due to partial volume effects. Second, the effects of water-fat chemical shift were not considered, since we used multiple water-fat in-phase echo times. Although this has simplified the data processing, there may be remnant chemical-shift induced phase components which may reduce the accuracy in the susceptibility quantification. As shown by Hernando et al., the presence of fat may cause bias in R2* estimation, even for water-fat in-phase echo spacing (42). This may partly explain the discrepancies between the LICs estimated from R2* and from QSM. Third, only the LICs of the liver tissues near the hepatic veins were estimated. For the liver tissue far away from the hepatic veins, the estimation of the LIC may not be reliable. It has been shown that the reliability of LIC quantification can be affected by the variation in the biological distribution of the iron content, especially for subjects with high LIC (43). Nonetheless, it is possible to select other vessels in the liver to estimate the LIC of the liver tissue close to that selected vessel. Fourth, it was assumed that the changes in oxygen saturation of the hepatic veins were negligible from healthy controls to patients. This assumption can be validated by the correlation between the apparent susceptibility of the hepatic veins and the LIC estimated from R2* mapping. However, assuming a 5% variation in the venous susceptibility in the patients, a variation of 0.08 mg/g dry tissue can be expected for LIC. This variation is at the same level of the uncertainties of LIC quantification, as demonstrated in simulation results. Finally, the proposed method was tested on a limited number of healthy controls and patients. Nonetheless, the in vivo data results agreed well with the simulation results, and we have evaluated the systematic under-estimations due to both the data acquisition and the QSM reconstruction.
In conclusion, LIC can be estimated by measuring the apparent susceptibility of the vessels in the liver. The accuracy of this QSM method was demonstrated using both simulations and in vivo data. This method offers a flexible way to measure LIC using data acquired with different protocols and has the potential to extend the range of LIC that can be reliably measured using MRI.
Acknowledgements
Funding: This work was supported in part by the Tianjin Bureau of Public Health Projects, through Grant Number 15KG134, and by the National Cancer Institute, NIH, through Grant Number R21CA184682. Its contents are solely the responsibility of the authors and do not necessarily represent the official views of the NIH.
Footnote
Conflicts of Interest: The authors have no conflicts of interest to declare.
References
- Gordeuk VR, Bacon BR, Brittenham GM. Iron overload: causes and consequences. Annu Rev Nutr 1987;7:485-508. [Crossref] [PubMed]
- Haacke EM, Cheng NY, House MJ, Liu Q, Neelavalli J, Ogg RJ, Khan A, Ayaz M, Kirsch W, Obenaus A. Imaging iron stores in the brain using magnetic resonance imaging. Magn Reson Imaging 2005;23:1-25. [Crossref] [PubMed]
- Andrews NC, Schmidt PJ. Iron homeostasis. Annu Rev Physiol 2007;69:69-85. [Crossref] [PubMed]
- Hernando D, Levin YS, Sirlin CB, Reeder SB. Quantification of liver iron with MRI: state of the art and remaining challenges. J Magn Reson Imaging 2014;40:1003-21. [Crossref] [PubMed]
- Brittenham GM, Badman DG. Noninvasive measurement of iron: report of an NIDDK workshop. Blood 2003;101:15-9. [Crossref] [PubMed]
- Clark PR, St Pierre TG. Quantitative mapping of transverse relaxivity (1/T(2)) in hepatic iron overload: a single spin-echo imaging methodology. Magn Reson Imaging 2000;18:431-8. [Crossref] [PubMed]
- St Pierre TG, Clark PR, Chua-anusorn W, Fleming AJ, Jeffrey GP, Olynyk JK, Pootrakul P, Robins E, Lindeman R. Noninvasive measurement and imaging of liver iron concentrations using proton magnetic resonance. Blood 2005;105:855-61. [Crossref] [PubMed]
- Wood JC, Enriquez C, Ghugre N, Tyzka JM, Carson S, Nelson MD, Coates TD. MRI R2 and R2* mapping accurately estimates hepatic iron concentration in transfusion-dependent thalassemia and sickle cell disease patients. Blood 2005;106:1460-5. [Crossref] [PubMed]
- Storey P, Thompson AA, Carqueville CL, Wood JC, de Freitas RA, Rigsby CK. R2* imaging of transfusional iron burden at 3T and comparison with 1.5T. J Magn Reson Imaging 2007;25:540-7. [Crossref] [PubMed]
- Haacke EM, Liu S, Buch S, Zheng W, Wu D, Ye Y. Quantitative susceptibility mapping: current status and future directions. Magn Reson Imaging 2015;33:1-25. [Crossref] [PubMed]
- Wang Y, Liu T. Quantitative susceptibility mapping (QSM): Decoding MRI data for a tissue magnetic biomarker. Magn Reson Med 2015;73:82-101. [Crossref] [PubMed]
- Liu C, Li W, Tong KA, Yeom KW, Kuzminski S. Susceptibility-weighted imaging and quantitative susceptibility mapping in the brain. J Magn Reson Imaging 2015;42:23-41. [Crossref] [PubMed]
- Reichenbach JR, Schweser F, Serres B, Deistung A. Quantitative Susceptibility Mapping: Concepts and Applications. Clin Neuroradiol 2015;25:225-30. [Crossref] [PubMed]
- Schweser F, Deistung A, Lehr BW, Reichenbach JR. Quantitative imaging of intrinsic magnetic tissue properties using MRI signal phase: An approach to in vivo brain iron metabolism? Neuroimage 2011;54:2789-807. [Crossref] [PubMed]
- Langkammer C, Schweser F, Krebs N, Deistung A, Goessler W, Scheurer E, Sommer K, Reishofer G, Yen K, Fazekas F, Ropele S, Reichenbach JR. Quantitative susceptibility mapping (QSM) as a means to measure brain iron? A post mortem validation study. Neuroimage 2012;62:1593-9. [Crossref] [PubMed]
- Zheng W, Nichol H, Liu S, Cheng YC, Haacke EM. Measuring iron in the brain using quantitative susceptibility mapping and X-ray fluorescence imaging. Neuroimage 2013;78:68-74. [Crossref] [PubMed]
- Li W, Wu B, Batrachenko A, Bancroft-Wu V, Morey RA, Shashi V, Langkammer C, De Bellis MD, Ropele S, Song AW, Liu C. Differential developmental trajectories of magnetic susceptibility in human brain gray and white matter over the lifespan. Hum Brain Mapp 2014;35:2698-713. [Crossref] [PubMed]
- Liu M, Liu S, Ghassaban K, Zheng W, Dicicco D, Miao Y, Habib C, Jazmati T, Haacke EM. Assessing global and regional iron content in deep gray matter as a function of age using susceptibility mapping. J Magn Reson Imaging 2016;44:59-71. [Crossref] [PubMed]
- Hernando D, Cook RJ, Diamond C, Reeder SB. Magnetic susceptibility as a B0 field strength independent MRI biomarker of liver iron overload. Magn Reson Med 2013;70:648-56. [Crossref] [PubMed]
- Sharma SD, Hernando D, Horng DE, Reeder SB. Quantitative susceptibility mapping in the abdomen as an imaging biomarker of hepatic iron overload. Magn Reson Med 2015;74:673-83. [Crossref] [PubMed]
- Chu Z, Cohen AR, Muthupillai R, Chung T, Wang ZJ. MRI measurement of hepatic magnetic susceptibility—Phantom validation and normal subject studies. Magn Reson Med 2004;52:1318-27. [Crossref] [PubMed]
- Taylor BA, Loeffler RB, Song R, McCarville MB, Hankins JS, Hillenbrand CM. Simultaneous field and R 2* mapping to quantify liver iron content using autoregressive moving average modeling. J Magn Reson Imaging 2012;35:1125-32. [Crossref] [PubMed]
- Sharma SD, Fischer R, Schoennagel BP, Nielsen P, Kooijman H, Yamamura J, Adam G, Bannas P, Hernando D, Reeder SB. MRI-based quantitative susceptibility mapping (QSM) and R2* mapping of liver iron overload: Comparison with SQUID-based biomagnetic liver susceptometry. Magn Reson Med 2017;78:264-70. [Crossref] [PubMed]
- Haacke EM, Brown RW, Thompson MR, Venkatesan R. Magnetic Resonance Imaging: Physical Principles and Sequence Design. 1st ed. Wiley-Liss; 1999.
- Marques JP, Bowtell R. Application of a Fourier-based method for rapid calculation of field inhomogeneity due to spatial variation of magnetic susceptibility. Concepts Magn Reson Part B Magn Reson Eng 2005;25B:65-78. [Crossref]
- Tang J, Liu S, Neelavalli J, Cheng YC, Buch S, Haacke EM. Improving susceptibility mapping using a threshold-based K-space/image domain iterative reconstruction approach. Magn Reson Med 2013;69:1396-407. [Crossref] [PubMed]
- Zuyderhoudt FM, Hengeveld P, van Gool J, Jörning GG. A method for measurement of liver iron fractions in needle biopsy specimens and some results in acute liver disease. Clin Chim Acta 1978;86:313-21. [Crossref] [PubMed]
- Neelavalli J, Cheng YN, Jiang J, Haacke EM. Removing background phase variations in susceptibility-weighted imaging using a fast, forward-field calculation. J Magn Reson Imaging 2009;29:937-48. [Crossref] [PubMed]
- Zhao JM, Clingman CS, Närväinen MJ, Kauppinen RA, van Zijl PC. Oxygenation and hematocrit dependence of transverse relaxation rates of blood at 3T. Magn Reson Med 2007;58:592-7. [Crossref] [PubMed]
- Garbowski MW, Carpenter JP, Smith G, Roughton M, Alam MH, He T, Pennell DJ, Porter JB. Biopsy-based calibration of T2* magnetic resonance for estimation of liver iron concentration and comparison with R2 Ferriscan. J Cardiovasc Magn Reson 2014;16:40. [Crossref] [PubMed]
- Feng W, Neelavalli J, Haacke EM. Catalytic multiecho phase unwrapping scheme (CAMPUS) in multiecho gradient echo imaging: removing phase wraps on a voxel-by-voxel basis. Magn Reson Med 2013;70:117-26. [Crossref] [PubMed]
- Abdul-Rahman HS, Gdeisat MA, Burton DR, Lalor MJ, Lilley F, Moore CJ. Fast and robust three-dimensional best path phase unwrapping algorithm. Appl Opt 2007;46:6623-35. [Crossref] [PubMed]
- Haacke EM, Tang J, Neelavalli J, Cheng YC. Susceptibility mapping as a means to visualize veins and quantify oxygen saturation. J Magn Reson Imaging 2010;32:663-76. [Crossref] [PubMed]
- Nocedal J, Wright SJ. Numerical Optimization. Springer; 1999. 670 p.
- Bland JM, Altman DG. Measuring agreement in method comparison studies. Stat Methods Med Res 1999;8:135-60. [Crossref] [PubMed]
- Langkammer C, Krebs N, Goessler W, Scheurer E, Ebner F, Yen K, Fazekas F, Ropele S., Quantitative MR. Imaging of Brain Iron: A Postmortem Validation Study. Radiology 2010;257:455-62. [Crossref] [PubMed]
- Barbosa JH, Santos AC, Tumas V, Liu M, Zheng W, Haacke EM, Salmon CE. Quantifying brain iron deposition in patients with Parkinson’s disease using quantitative susceptibility mapping, R2 and R2*. Magn Reson Imaging 2015;33:559-65. [Crossref] [PubMed]
- Du G, Liu T, Lewis MM, Kong L, Wang Y, Connor J, Mailman RB, Huang X. Quantitative Susceptibility Mapping of the Midbrain in Parkinson’s Disease. Mov Disord 2016;31:317-24. [Crossref] [PubMed]
- Krafft AJ, Loeffler RB, Song R, Tipirneni-Sajja A, McCarville MB, Robson MD, Hankins JS, Hillenbrand CM. Quantitative ultrashort echo time imaging for assessment of massive iron overload at 1.5 and 3 Tesla. Magn Reson Med 2017;78:1839-51. [Crossref] [PubMed]
- Buch S, Liu S, Ye Y, Cheng YC, Neelavalli J, Haacke EM. Susceptibility mapping of air, bone, and calcium in the head. Magn Reson Med 2015;73:2185-94. [Crossref] [PubMed]
- Sun H, Kate M, Gioia LC, Emery DJ, Butcher K, Wilman AH. Quantitative susceptibility mapping using a superposed dipole inversion method: Application to intracranial hemorrhage. Magn Reson Med 2016;76:781-91. [Crossref] [PubMed]
- Hernando D, Kramer JH, Reeder SB. Multipeak fat-corrected complex R2* relaxometry: Theory, optimization, and clinical validation. Magn Reson Med 2013;70:1319-31. [Crossref] [PubMed]
- Emond MJ, Bronner MP, Carlson TH, Lin M, Labbe RF, Kowdley KV. Quantitative study of the variability of hepatic iron concentrations. Clin Chem 1999;45:340-6. [PubMed]

