
Incidental detection of sinus mucosal abnormalities on CT and MRI imaging of the head
Introduction
Previous studies on various population subsets have reported the prevalence of sinus abnormality to range from 16% to 60% (1). Bolger et al. however, suggested that the incidence rate on CT may not be reflective of the true rate of sinus mucosal abnormalities, due to the undocumented concurrent use of antibiotics for other reasons (2). Diagnosis of rhinosinusitis is still primarily done clinically (3), whereas the function of CT and MRI in these cases is supplementary, usually as a pre-surgical tool (4).
Several systems on sinus abnormality staging based on cross-sectional imaging have been developed and studied. In 2004, Zinreich compared 4 different staging systems for rhinosinusitis, namely, the Kennedy, Levine and May, Harvard, and Lund-Mackay (LM) systems and concluded that the Lund-Mackay system was the most objective and reproducible system due to its simplicity and widespread acceptance (3,4). Ashraf et al. attempted to study this staging system to determine what score should be considered an incidentally normal range. They concluded that a LM score of 3 or less was most likely normal, above 6 was most likely pathological, and 4-5 indeterminate (5).
Various symptomatology questionnaire-based tools have been used by ENT surgeons to score the severity of patients’ sinus-related symptoms, especially in pre- and post-treatment (for rhinosinusitis) situations. The Sinonasal Outcome Test (SNOT-20) has been widely used before, but is now shown to be less sensitive than the recently developed Sino Nasal Assessment Questionnaire (SNAQ-11) (6).
Attempts have also been made to seek a correlation between patients’ symptoms and imaging findings. An early study reported no such correlation, but it was limited by its small sample size and a long interval between imaging and questionnaire answering (7). The purpose of this study was to investigate the prevalence of incidental findings of sinus abnormalities on CT and MRI scans in all age groups, who were requested for non-ENT indications in a tertiary medical centre. We also sought a correlation between the imaging findings (graded by the L-M system) and the patient symptoms (based on the SNAQ-11 questionnaire), and between imaging findings and their clinical assessment, with the aim of overcoming limitations of previous studies.
Materials and methods
Patient data and CT/MRI scans
This is a prospective cross-sectional study of patients with non-sinus related diagnoses referred to our imaging department for CT or MRI imaging of the head. The total sample population was 115 patients, with 54 (47%) of them undergoing CT scans. The patients were randomly selected from the elective and emergency CT and MRI list from 2007 to 2008. Apart from answering a standard questionnaire and having their images analysed for this study, these patients were also given the option to have their sinuses evaluated clinically. In order to meet the inclusion criteria, indications for imaging must not be sinus-related. Trauma patients and patients deliberately referred for imaging of the paranasal sinuses were excluded.
The CT scans were performed in either one of the two CT scanners: Siemens Somatom Sensation 16-slice scanner (Siemens Healthcare, Forchheim, Germany) and the GE Lightspeed 16-slice CT (GE Healthcare, Milwaukee, WI, USA). The MRI scans were done in a 1.5 Tesla Siemens Magnetom scanner (Siemens Healthcare, Forchheim, Germany).
On the examination day, the patients were required to answer a standard questionnaire, the SNAQ-11 assessment form (6). This questionnaire attempts to grade the patients’ symptoms concerning sinusitis and scores were given over a total of 55. The minimum score is 11. The questionnaires were filled on the day of examination to ensure the highest chance of correlation with the current imaging findings.
Image assessment
Each image was analysed twice, once by a trainee radiologist and another by one of the two senior radiologists (with more than 10 years of experience) involved in the study. Assessors were blinded to the SNAQ-11 scores and the patients’ symptomatology. The images were reviewed electronically on the picture archiving and communication system (PACS). Images consisted of standard axial images on CT and 3-plane images on MRI scans. Image manipulation other than that would be employed during regular reporting of the cases were not allowed, as these findings are incidental. Windowing (contrast adjustment) of the images were allowed. Images were graded using the LM grading system (1,3), and a consensus LM score (from the two reviewers) was given for each case.
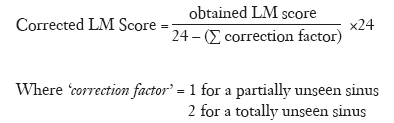
The LM sinus grading system grades the sinuses based on abnormality and grossly categorizes them into either normal, partially opacified (including small polyps and mucosal thickening) and totally opacified (3). Each sinus is graded separately and a total score from 0 to 24 is given to each case. Since we expected that most cases would not have included all of the paranasal sinuses in their entirety, a correction factor was applied (based on the number of partially unseen or totally unseen sinuses) and a corrected (prorated) LM score was given, based on the formula below:
The patients were then given the option to have their sinuses reviewed by an otorhinolaryngologist at the earliest appointment available.
The data obtained for each case were the LM scores with their corresponding SNAQ-11 scores. For those patients who underwent clinical examination, their anterior rhinoscopy results were obtained.
Statistical analysis
All data were entered into SPSS V 12.0 for statistical analysis (SPSS, Inc., Chicago, ILL). Continuous variables were expressed as mean value ± SD. Student’s T-test was used for analysis of difference between the means of quantitative data, while chi-square test was used to look for associations between different sets of categorical data and correlation coefficients (Spearman’s rank correlation test) were used to seek out significant correlation patterns between the patient’s symptomatology and their incidental sinus imaging findings. A P value less than 0.05 was defined as statistically significant difference.
Results
Demographic data and patients’ symptomatology
A total of 115 patients with 54 undergoing CT and 61 undergoing MRI scans were analysed. The mean age for CT patients (52.3±22.4 years) was significantly higher than that of the MRI patients (38.5±18.4 years).
For symptoms, the mean SNAQ-11 score for the whole population was 13.83 (±4.21) and they were independent of imaging modality used or different age groups (P>0.05).
Image analysis
There was no significant inter-observer variability between the 2 image assessors (P=0.82). Deficiencies in the completeness of sinus imaging have been taken care of by applying a correction algorithm. MRI showed a larger percentage of incompletely imaged paranasal sinuses (24.6% vs. 11.1%).
Table 1 shows that MRI had a significantly (P<0.05) higher incidence of sinus abnormality in the cases of the maxillary, ethmoidal and left frontal sinuses. The incidence rate of sinus mucosal abnormalities for all age groups was variable (depending on which cutoff system was used); which is between 14.8% and 37.0% for CT and 22.6% and 85.2% for MRI scans.

Full Table
Age-group specific incidence rates were also calculated. In the younger age group (<19 years old), the incidence rates were between 16.7% and 33.3% for CT and 16.7% and 83.3% for MRI imaging. For the adult-only age group (≥19 years old), the incidence rates were between 14.6% and 37.5% for CT and 32.7% and 85.7% (significantly higher) for MRI. We also found that the incidence rates of sinus mucosal abnormalities were not influenced by age group or gender.
We studied and compared the incidence of sinus mucosal abnormalities between the asymptomatic and symptomatic patients, and found that the asymptomatic patients had a significantly lower prevalence than the symptomatic patients (33.3% vs. 66.7%).
Correlating the patients’ symptomatology with imaging findings
This analysis shows that symptomatic patients had a significantly higher (P<0.01) LM score (4.3±4.3) than that of asymptomatic group (2.2±2.9). Correlation analysis utilizing Spearman’s rank correlation test was performed to detect associations between the LM and SNAQ-11 scores. No significant correlation between the SNAQ-11 and LM scores was seen among the CT cases. A very significant, moderate correlation was seen in the MRI group of cases (r=0.59, P<0.001). Further correlation analysis was done for the MRI cases, excluding the adult patients, and a significant, very strong correlation was found between their SNAQ-11 and LM scores (r=0.7, P<0.05) in the younger age group.
Detailed account of the sinus abnormalities
The ethmoid sinuses showed the highest rate of incidental sinus abnormality (mean LM score range, 0.5-0.54) compared to the rest of the sinuses. The osteomeatal complexes are the most frequently unseen, partially or completely (73.8% of all the MRI cases). Conversely, the sphenoid sinuses had the highest incidence of completely visualized sinuses (1.6% of the sinuses were incompletely/partially unseen on MRI).
Table 2 shows, in descending order, the mean LM scores given to each sinus on CT. The ethmoid sinuses again had the highest scores (0.19-0.28). The osteomeatal complexes were the most frequently unseen, either partially or completely (79.6% on the left and 81.5% on the right). Of the osteomeatal complexes that were visualized, all were normal. The frontal, sphenoid and ethmoid sinuses were seen in their entirely in all CT scans. Table 3 compares the mean LM scores for the individual sinuses on MRI scans. A higher detection rate of sinus abnormality (consistently higher LM score compared to the corresponding score on CT) was shown on MRI images.

Full Table

Full Table
Correlation of imaging findings with clinical sinus assessment
Eight patients (7% of the sample population) agreed to have their sinuses examined clinically by an otorhinolaryngologist. The mean time between imaging and clinical assessment was 5 days. Five out of the eight were found positive for sinusitis.
There was no statistically significant relationship between the LM scores and the clinical diagnosis. Although there was no statistical significance (P value was 0.80 for CT and 0.25 for the overall group), patients who were found to be clinically positive for sinusitis are prone to have a higher LM score. Figures 1,2 are examples showing the abnormal sinus observed on CT and MRI images.


Discussion
This study shows significant association between MRI findings and patient’s symptomatology. Symptomatic patients exhibited a higher incidence of sinus abnormalities compared to the asymptomatic patients. This is expected, as it further validates the LM grading system in detecting sinus mucosal abnormalities and also infers that significance sinus mucosal abnormalities, when exceeding a threshold LM score of 3, is abnormal and requires ENT assessment as the patient is likely to be symptomatic.
Many studies using CT and MRI imaging confirmed the high prevalence of incidental sinus findings without initial clinical symptoms. Havas et al. reported radiological abnormalities in one or more of the paranasal sinuses in up to 42.5% of MRI and CT scans of asymptomatic patients with an average age of 55 years (8). Lim et al. registered 32.3% sinus abnormalities in non-ENT MRI images of children below the age of 16 years (1). In contrast, symptomatic sinus patients are much more likely to have positive sinus CT scan findings than asymptomatic patients (9). This is confirmed in this study to some extent, as there is a significant correlation between MRI findings and patients’ symptoms. Although no significant association was found between CT findings and symptoms, symptomatic patients tend to have a higher LM score. Correlation of clinical symptoms with imaging findings represents the strength of this study compared to previous reports (10).
The good correlation between the SNAQ-11 scores and the MRI LM scores is a novel finding of this study. Furthermore, this study has overcome the limitation of small sample size in previous studies. However, despite using the same system for grading, no significant correlation was seen on CT imaging. This is most likely due to the fact that correlation studies depend on both variables which increased at a constant given rate, while MRI can detect sinus mucosal thickening at very early stage, thus, it is more likely to give a positive LM score even when the patient is mildly symptomatic. In contrast, CT is less sensitive than MRI in detecting sinus mucosal thickening, thus, the patient would have to be quite symptomatic before manifesting any changes on CT; i.e. the SNAQ-11 has a value (>11) showing symptoms, but yet the LM scores still remain at zero, which is unable to detect the minimal sinus mucosal thickening.
A recent systematic review reported that incidental findings occurred with a mean frequency of 23.6% in 44 reviewed papers (11). The frequency of incidental findings are even higher in studies involving CT technology (31.1%). Our results are consistent with these findings. However, CT is associated with high radiation dose, which raises a major concern in the literature (12-14). Therefore, application of a low-dose CT protocol or using an alternative imaging technique such as cone beam CT (CBCT) could be an effective option for detection of incidental sinus abnormalities. Pazera et al. in their recent study concluded that incidental maxillary sinus findings were present in almost half of the CBCT scans with a limited field of view in the younger orthodontic patients. CBCT has become available for maxillofacial radiographic imaging over the last decade, and it has addressed the issue of high radiation exposure associated with conventional CT (15,16).
Some limitations in this study should be addressed. Firstly, only 8 patients underwent the ENT assessment, and 5 of them were diagnosed with sinusitis. To determine any association between the clinical diagnosis and imaging findings, more patients are needed to verify our results. Secondly, there was a trend showing that patients with sinusitis had a higher LM score than those without sinusitis with a mean difference of approximately 4 LM score points. This could be interpreted as a difference between having mucosal thickening in only 2 paranasal sinuses as opposed to 6, and on the outset, appears promising. Nevertheless, the small sample size in this study prevented any statistically significant results from being obtained. Lastly, CT scans were performed on a 16-slice scanner, which limited image quality to some extent, despite satisfactory results having been achieved. In addition, radiation dose was not recorded in these patients undergoing CT scans. Further studies with use of recent CT models and low-dose protocols are recommended.
In conclusion, from the findings of this study, it can be concluded that the frequency of incidental sinus findings seem not to be directly related to gender or age. This study demonstrates that MRI detects incidental sinus abnormality at a higher prevalence when compared to CT imaging, indicating the superiority of MRI. MRI findings are significantly related to the patient’s symptomatology, although further research is needed to confirm the clinical significance of these results.
Acknowledgements
Disclosure: The authors declare no conflict of interest.
References
- Lim WK, Ram B, Fasulakis S, et al. Incidental magnetic resonance image sinus abnormalities in asymptomatic Australian children. J Laryngol Otol 2003;117:969-72.
- Bolger WE, Butzin CA, Parsons DS. Paranasal sinus bony anatomic variations and mucosal abnormalities: CT analysis for endoscopic sinus surgery. Laryngoscope 1991;101:56-64.
- Zinreich SJ. Imaging for staging of rhinosinusitis. Ann Otol Rhinol Laryngol Suppl 2004;193:19-23.
- Lund VJ, Kennedy DW. Staging for rhinosinusitis. Otolaryngol Head Neck Surg 1997;117:S35-40.
- Ashraf N, Bhattacharyya N. Determination of the “incidental” Lund score for the staging of chronic rhinosinusitis. Otolaryngol Head Neck Surg 2001;125:483-6.
- Fahmy FF, McCombe A, McKiernan DC. Sino nasal assessment questionnaire, a patient focused, rhinosinusitis specific outcome measure. Rhinology 2002;40:195-7.
- Basu S, Georgalas C, Kumar BN, et al. Correlation between symptoms and radiological findings in patients with chronic rhinosinusitis: an evaluation study using the Sinonasal Assessment Questionnaire and Lund-Mackay grading system. Eur Arch Otorhinolaryngol 2005;262:751-4.
- Havas TE, Motbey JA, Gullane PJ. Prevalence of incidental abnormalities on computed tomographic scans of the paranasal sinuses. Arch Otolaryngol Head Neck Surg 1988;114:856-9.
- Wittkopf ML, Beddow PA, Russell PT, et al. Revisiting the interpretation of positive sinus CT findings: a radiological and symptom-based review. Otolaryngol Head Neck Surg 2009;140:306-11.
- Pazera P, Bornstein MM, Pazera A, et al. Incidental maxillary sinus findings in orthodontic patients: a radiographic analysis using cone-beam computed tomography (CBCT). Orthod Craniofac Res 2011;14:17-24.
- Lumbreras B, Donat L, Hernández-Aguado I. Incidental findings in imaging diagnostic tests: a systematic review. Br J Radiol 2010;83:276-89.
- Brenner DJ, Hall EJ. Computed tomography--an increasing source of radiation exposure. N Engl J Med 2007;357:2277-84.
- Sun Z, Ng KH. Multislice CT angiography in cardiac imaging. Part III: radiation risk and dose reduction. Singapore Med J 2010;51:374-80.
- Sun Z. Cardiac CT imaging: current status and future directions. Quant Imaging Med Surg 2012;2:98-105.
- Farman AG, Scarfe WC, van Genuchten M. Multidimensional imaging: immediaten and imminent issues. Compend Contin Educ Dent 2010;31:648-51.
- Cağlayan F, Tozoğlu U. Incidental findings in the maxillofacial region detected by cone beam CT. Diagn Interv Radiol 2012;18:159-63.

