
Estimating extraction fraction and blood flow by combining first-pass myocardial perfusion and T1 mapping results
Introduction
Dynamic contrast enhanced cardiovascular magnetic resonance (DCE-CMR) is a commonly used tool for examining myocardial blood flow (MBF) in patients with coronary artery disease. Many clinicians favor DCE-CMR because it provides high spatial and temporal resolution and does not require ionizing radiation. In DCE-CMR perfusion, a paramagnetic contrast agent is injected as a bolus. The passage of this contrast agent is tracked from the blood to the myocardium using T1-weighted imaging. Pharmacokinetic modelling techniques are then used to quantify the MBF (1). Quantifying MBF through DCE-CMR studies has been validated by comparison against gold standards such as microspheres and positron emission tomography (PET) (2-6). This technique of MBF quantification has been shown to complement visual assessment of perfusion images (2,7,8), as well as being valuable for the study of other cardiac diseases. However, while several quantification methods have been developed, fully quantitative myocardial perfusion magnetic resonance imaging (MRI) is still considered to be challenging and not completely understood.
A particularly challenging component in MBF quantification is the “extraction fraction”. In the case of a gadolinium (Gd)-based tracer, the extraction fraction is the percentage of the tracer moving from the vascular space to the extracellular extravascular space (EES) (9). The compartmental model-based approach to quantify DCE-CMR perfusion provides an estimate of forward transfer coefficient (Ktrans), which is a product of MBF and the extraction fraction (Ktrans= MBF × E). Thus, Ktrans must be corrected for the extraction fraction, and failing to do so leads to an underestimation of the actual MBF (10). Animal studies have calculated the extraction fraction in the canine myocardium (11,12), and many studies on human myocardial perfusion use these published values. However, there have been studies to indicate that extraction fraction changes with flow (10). Furthermore, studies using 99mTc-DTPA and 51CR-EDTA show that extraction fraction varies with flow in human and canine myocardium (13-15) and these inert diffusible tracers are similar to Gd-DTPA in terms of extraction fraction (16). Thus, using published values for extraction fraction in perfusion studies is questionable.
In their pioneering work, Larsson et al. tried to estimate extraction fraction as a parameter during pharmacokinetic modelling, but they were limited by the noise in the measured tissue curve signal and the complexity of the model they used (17). A shortcoming with complex pharmacokinetic models is that identical tissue curves can be generated using a single arterial input function and multiple sets of perfusion model parameters.
The goal of this study is to develop a novel technique that gives reliable estimates of extraction fraction during pharmacokinetic modelling. With the use of prior information from T1 mapping, it may be possible to improve quantitative blood flow estimates.
Theory
Developments in cardiac MRI have made it possible to estimate extracellular volume (ECV) fraction using T1 mapping (18,19). ECV has been validated as a marker of myocardial fibrosis and infarction. Studies have shown good accuracy and repeatability for ECV estimation using T1 mapping (20-22). Over these years, pharmacokinetic modelling of myocardial perfusion has also evolved. The possibility of estimating EES or myocardial distribution volume using myocardial perfusion images has been studied with promising results (23,24). However, the prior studies have not looked at using ECV measured separately with T1 mapping to improve the perfusion studies. In this current study, we study the possibility of using ECV maps from T1 mapping to reduce the degrees of freedom when fitting a myocardial perfusion model. With the particular model chosen here, this also enables estimation of extraction fraction, along with MBF.
Pharmacokinetic modelling
Gd-based extracellular contrast agent permeates into the EES via the capillary membrane. The contrast agent dynamics across the capillary membrane can be written as:
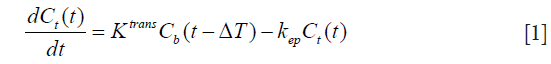
where Cb and Ct represent the contrast concentration in blood [arterial, measured in the left ventricular (LV) blood pool] and tissue respectively. Ktrans and kep represent the forward transfer coefficient from blood to EES and the backward transfer coefficient from EES to blood, respectively. ΔT represents the time delay between LV blood enhancement and myocardial tissue enhancement, as blood passes through the coronary arteries.
Solving the differential equation, we get:

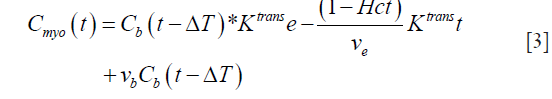
In the case of the myocardium, an additional term corresponding to the vascular component vb should be considered. This pharmacokinetic model with the additional vascular component term included is known as the extended Kety-Tofts model (25). Moreover, the ratio of the forward and backward transfer constant, scaled by the blood hematocrit (Hct) value, represents the EES volume: 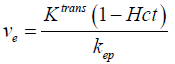 (23). Thus Eq. [2] can be modified and written as:
Since the Gd-based contrast agent permeates into the EES, the above Eq. has to be corrected for the extraction (17). Thus, we get:
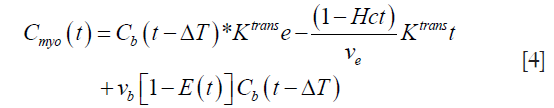
where E(t) is the extraction of the contrast agent from the intravascular space to the EES. This extraction can be written as:
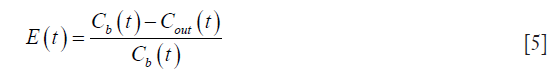
where Cout represents the contrast concentration in blood on the venous side.
Using Fick’s principle, we can write:
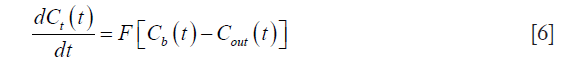
where F represents the blood flow.
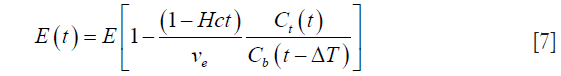
Moreover, it is known that the forward transfer coefficient Ktrans is related to the blood flow as: F = Ktrans/E, where E represents the extraction fraction. Using Eq. [6] along with the definition of extraction, we can write:
Substituting this value of E(t) from Eq. [7] into Eq. [4], we get:
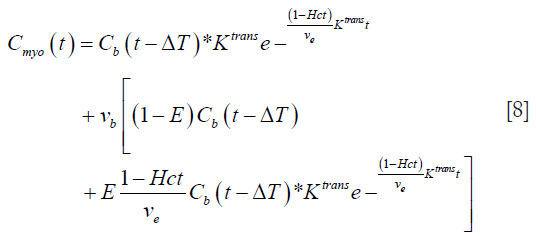
Eq. [8] represents a 5-parameter model with Ktrans, ve, ΔT, vb, and E as the parameters to be estimated.
Such a 5-parameter model was previously investigated by Larsson et al. (17). They reported that such a 5-parameter model does not have a unique convergence (17) and was not useful as a pharmacokinetic model for estimating MBF in humans. However, due to the developments in cardiac MRI, it is now possible to estimate ECV using T1 mapping. This additional information about ECV may improve MBF estimates using the 5-parameter model.
Estimating ECV using T1 mapping
The ECV in the myocardium can be estimated by taking the ratio of contrast agent concentration in the myocardium and the blood at dynamic steady-state (18).
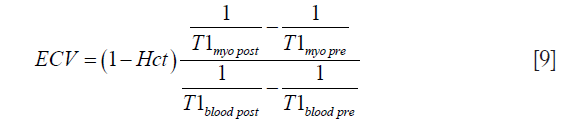
where Hct represents the measured Hct. This dynamic steady-state between the interstitium and the blood can be achieved by imaging approximately 15 min after the contrast agent injection. However, ECV includes the components corresponding to the EES and also the extracellular intravascular space (26).
Hence, for accurate estimation of the EES, the component corresponding to extracellular intracellular volume needs to be subtracted (26):

where ve represents the EES volume fraction, vp represents the volume fraction of blood plasma, vb represents the blood volume fraction and ρ represents the specific gravity of myocardial tissue (1.05 mL/g).
With measured ECV, the 5-parameter model from Eq. [8] reduces to a problem of estimating 4 parameters. This 5-parameter model with the use of ECV information will be referred to as a 4-parameter model in this article. This approach of fixing ECV in the model was evaluated using simulations and human studies.
Methods
Simulation study
Simulations were conducted to test the feasibility of using the 4-parameter model with known ECV and the 5-parameter model without known ECV. Physiologically realistic tissue residue curves were generated using the multiple path, multiple tracer indicator dilution 4 region model (MMID4) perfusion model (National Simulation Resource, Department of Bioengineering, University of Washington, Seattle, WA, USA). The MMID4 was run in the XSIM environment. MMID4 is an axially distributed, physiologically realistic blood tissue exchange model that accounts for multiple parallel flow pathways. The model considers various parameters such as vascular flows, dispersion and the volume fractions for capillaries, arterioles, and arteries. MMID4 has been described in detail in (27,28).
To simulate realistic tissue residue curves, parameters for MMID4 were set using previously validated experiments with healthy canine hearts (29). These values have also been previously used for MMID4 simulations in studies for humans (30). The large conduit vessel volume was fixed at 0.05 mL/g (Vtube). The large vessel arterial (Vart) and arteriolar volumes (Vartl) were set to 0.02 and 0.03 mL/g, respectively. The capillary volume (vb) was set to 0.05 mL/g for resting flows and was changed to 0.09 mL/g for stress flows. The large vessel volumes were not changed. Previous studies indicate that large vessel volumes do not change between rest and stress (31). Relative dispersion (RD) was set to 0.48 for the upstream conduit vessel and the large vessels.
For the simulation of tissue residue curves at rest and stress, flow values of 1.0 and 2.8 mL/min/g were selected, respectively. Values for permeability-surface area (PS) were adjusted according to the Renkin-Crone equation to represent physiologically realistic values for extraction fraction as described in previous studies (10). The value for interstitial volume EES (ve) was set and was assumed to be known. During model fitting, this known value of EES volume was allowed to vary by 5% of its actual value. This process of allowing the EES volume to vary slightly was found to give better model fits to the acquired data.
Arterial input functions (AIF) corresponding to rest and stress were obtained from the same human study. These two input functions were then used to generate the tissue residue curves for flows during rest and stress. Figure 1 shows the AIF and tissue curves generated.

Varying levels of Gaussian noise were added to the MMID4 tissue curves (17). The noisy tissue residue curves were fit to the described four parameter model by minimizing the least squared error. Experiments were repeated without providing the model any information about EES (5 parameters were fit in this case). Figure 1 shows the example tissue curves corresponding to noise levels of 5%, 10% and 15% noise during rest and stress.
Monte-Carlo simulations were done to evaluate the reliability of the perfusion parameter estimated by fitting the MMID4 tissue curves to the 4-parameter model as described above. One thousand experiments were performed at each noise level. Analysis of the results are described in the Statistical Analysis section below.
In vivo study
Overview
The study protocol involved acquisition of rest and stress perfusion data along with pre-contrast and post-contrast T1 mapping. Pre-contrast MOLLI T1 mapping was performed first, followed by a rest perfusion scan and phase contrast imaging to estimate coronary sinus (CS) flow. The rest perfusion scan was then followed by a stress perfusion scan and phase contrast imaging to estimate CS flow during stress. The rest and stress perfusion scans were separated by 20±5 minutes. Post-contrast MOLLI T1 mapping with scan parameters and slices similar to pre-contrast T1 mapping was performed approximately 12 minutes after the contrast injection for stress perfusion. Figure 2 shows the summary of the acquisition protocol. The perfusion and T1 mapping portions of this dataset were also used in a previous study by our research group (20).

Data acquisition
Ten subjects (48±12 years, eight males, two females) were imaged on a Siemens 3T Verio scanner (Erlangen, Germany). Informed consent from the patients was obtained in accordance with the University of Utah Institutional Review Board. Hct information was recorded for each subject.
Pre- and post-contrast T1 maps were acquired using a MOLLI work-in-progress package on the Siemens platform. The sequence employed the standard MOLLI technique that acquires images at 11 images at different inversion times. Each MOLLI slice was acquired within an end-expiration breath-hold by using an ECG-triggered acquisition with a balanced steady-state free precession (SSFP) readout (TR =2.8 ms, TE =1.0 ms, flip angle =35°, slice thickness =8 mm, spatial resolution =1.8 mm × 1.8 mm). The T1 mapping images were acquired in basal, mid and apical short-axis (SA) slices. Post-contrast MOLLI T1 images were obtained approximately 10–15 min after the last injection of gadoteridol.
The perfusion scans were performed using an ungated saturation recovery prepared TurboFLASH pulse sequence with golden angle radial acquisition. The acquisition parameters for the scans were 24 rays per image, TR =2.2 ms, TE =1.2 ms, flip angle =10°, resolution =1.8×1.8×8 mm3 voxels. Four SA slices were acquired after a single saturation pulse with a saturation recovery time of ~25 ms before the first slice. Gadoteridol (ProHance; Bracco Diagnostic, Princeton, NJ, USA) 0.05 mmoL/kg at a rate of 5 mL/s was injected and ~240 frames were acquired over a minute with shallow breathing and no ECG gating. This was followed 20±5 minutes later by an injection of regadenoson to induce stress. Contrast was injected ~70 s after regadenoson injection to ensure maximal stress and the scan protocol was repeated to acquire 4 slices at stress. Slices were acquired from base to apex. The slices were positioned such that slice 1 was as basal as possible without cutting through the valve plane.
The radial k-space data were reconstructed offline using a multi-coil spatio-temporally constrained reconstruction with total variation constraint (32,33). Figure 3 shows a single frame for reconstructed rest and stress perfusion images for two subjects.

In addition to the perfusion scans, mean MBF at rest and during stress was estimated using phase contrast cine images of the CS (34). The CS was localized using the basal slices of the SA stack and the 4-chamber view in the atrio-ventricular groove. Velocity-encoded imaging was then acquired with ECG gating during breath holds. The scan parameters were slice thickness 6 mm and velocity encoding 70 cm/s. CS flow quantification was performed using commercial software (CVI42, Circle Cardiovascular Imaging Inc., Calgary, Canada). Phase-contrast magnitude images were used for contouring the CS throughout the cardiac cycle. Integration of flow rate from each cardiac phase over the entire cardiac cycle and mean heart rate during acquisition was used to calculate the CS flow both at rest and immediately after stress.
Quantification of MBF in the human datasets
CS flow estimates could only be acquired in a subset of six subjects. Hence data from these six subjects was processed further for this study. Table 1 shows the characteristics (not mutually exclusive) of the six subjects in the study. The ungated datasets were self-gated into two discrete bins namely self-gated systole and self-gated diastole using the self-gating technique described in (35). Only the self-gated systolic datasets were used for further analysis during this study. This was done to minimize error due to the thinner walls in the diastolic datasets. The self-gated systolic datasets were registered automatically to account for respiratory motion and any residual cardiac motion after self-gating. The steps for processing self-gated datasets were described in detail in (35).

Full table
The most basal slice (the slice with the lowest saturation recovery time, 25 ms) was used to obtain the AIF. This acquisition of a short saturation recovery time (SRT) AIF is similar to the dual sequence method. This process of obtaining a non-saturated AIF was validated in (35). The remaining 3 slices were used to quantify MBF (20). The slices were segmented by drawing the epicardial and endocardial contours. The segmented myocardium was circumferentially divided into six segments. Tissue curves were obtained by recording the average signal intensity in each region over time. Tissue and AIF signal intensity tissue curves were converted to (Gd) assuming fast exchange of water (36).
The tissue curves and AIF thus obtained were fit to the 4-parameter model as described in Eq. [8]. The pre-contrast and post-contrast MOLLI T1 mapping images were used to estimate ECV in 3 slices: basal, mid-ventricular and apical. This information about ECV and Hct was supplied to the model during model fitting. The value of Hct was provided as a constant during the model fitting process. The value of ECV was allowed to vary by 5% of its actual value during model fitting. This process of allowing the ECV to vary slightly was found to give better model fits to the acquired data. During model fitting, the value of ECV was converted to EES volume using Eq. [10].
The same processing pipeline was followed for the rest and the stress datasets. The mean flows at rest and stress were compared to the CS flows.
Statistical analysis
Simulation study
Mean and standard deviation (SD) were computed for the estimated perfusion parameters at various noise levels for the simulated tissue curves at rest and stress. 95% confidence intervals (CI) were calculated. Similar simulations were repeated with no prior information about ECV being supplied during model fitting.
Sensitivity analysis was performed using the noise-free tissue curves. This was done to study the effect of variation of the perfusion parameters on their estimates. Three sets of tissue curves were generated using MMID4. In the first set, 16 tissue curves were generated by varying MBF between 0.4–3.4 mL/min/g in steps of 0.2 mL/min/g and E and vb were kept constant. A fixed value of E =0.5 and vb =0.05 mL/g was used to generate all tissue curves with MBF ≤1.6 mL/min/g. The values of E and vb were updated to 0.35 and 0.09 mL/g for all tissue curves with MBF >1.6 mL/min/g. This was done to generate physiologically realistic tissue curves representing rest and stress. For the second set, nine tissue curves were generated. The value of E wasvaried between 0.1–0.9 (in steps of 0.1). MBF =3 mL/min/g and vb =0.09 mL/g was used to generate tissue curves with E ≤0.5.The values of MBF and vb were changed to 1 mL/min/g and 0.05 mL/g for tissue curves with E >0.5. A total of 15 tissue curves were generated in the third set by varying the value of vb between 0.01–0.15 mL/g (in steps of 0.01 mL/g). For reasons described earlier, MBF =1 mL/min/g and E =0.5 were used for tissue curves generated with vb ≤0.08 mL/g. MBF =3 mL/min/g and E =0.35 were used for tissue curves with vb >0.08 mL/g. The generated tissue curves were fit to the 4-parameter model described above to estimate the perfusion parameters. Relative error, represented as a percentage, was determined as the ratio of difference between the estimated value and true value to the true value of the parameter.
In vivo study
Quantification of MBF was done in a total of 108 myocardial segments (6 subjects, 3 slices and 6 regions per slice) at rest and stress. MBF was estimated as the forward transfer coefficient (Ktrans) divided by the extraction fraction (E). Mean and SD were reported for MBF, E and vb during rest and stress. Differences in these perfusion parameters during rest and stress were evaluated using the paired sample t-test. A value of P<0.05 was considered to be statistically significant.
Global MBF was calculated as the average of MBF estimates over all slices and all regions for each subject. This process gave us a single global MBF value for each subject. The global MBF estimates for each subject were compared to their corresponding global CS flow using a paired-sample t-test.
Results
Simulation study
Figure 4 shows the model fits to the noisy tissue curves (10% noise) generated using MMID4 with and without prior information about ECV. It can be seen that the model fits the measured noisy tissue curves correctly when additional information about ECV is provided. Table 2 compares the statistics such as mean, SD and the 95% CI for the perfusion parameter estimates with and without prior information about ECV at rest and stress. With space constraints in mind, only the results for 5% and 10% noise were presented in Table 2. It was seen that the 5% and 10% noise added tissue curves had a contrast to noise ratio (CNR, CNR = SIpeak/SDbaseline) comparable to the CNR calculated for the tissue curves from human datasets in this study. The boxplots and t-test show that the 4-parameter model converges to a unique solution and reliably estimates the perfusion parameters in presence of prior information on ECV. However, in absence of information on ECV, the 5-parameter model fails to converge to a unique solution and thus gives incorrect estimates for the perfusion parameters. The results of the simulation study show that the use of prior information makes it possible to reliably estimate extraction fraction as a perfusion parameter using the 4-parameter model.


Full table
Figure 5 shows the sensitivity analysis plots. The horizontal black line represents minimum error of 0%. A positive value for error indicates that the estimated value was more than the true value and vice versa.

The noise added simulated tissue curves (blue) with the 4-parameter model fits (red) with and without additional information about ECV. The model fits the data by minimizing the least square error in all cases. However, in the absence of the prior information about ECV, the model fails to estimate the perfusion parameters correctly. ECV, extracellular volume; MBF, myocardial blood flow; E, extraction fraction; Vb, blood volume fraction.
The statistics such as mean, SD and 95% CI for the perfusion parameters estimated using simulations at 5% and 10% noise during rest and stress
MBF, myocardial blood flow; E, extraction fraction; Vb, blood volume fraction; Ve, the EES volume fraction; SD, standard deviation; CI, confidence interval; EES, extracellular extravascular space.
The results of sensitivity analysis. MBF, myocardial blood flow; Vb, blood volume fraction.
In vivo study
Figure 6 shows an example of the 4-parameter model fit to measured tissue curves in a single myocardial region for two subjects during rest and stress. The mean MBF estimates for all six subjects during rest and stress were 0.9±0.1 and 2.3±0.6 mL/min/g respectively. The mean extraction fraction estimates were 0.49±0.04 and 0.34±0.05 during rest and stress respectively. The estimates of extraction fraction at vasodilation were lower than those during rest. These estimates of extraction fraction are comparable to those found by other researchers in human and canine myocardium (10-12,37). Table 3 summarizes the values of extraction fraction reported by prior studies. Figure 7 shows a histogram representing the distribution of the different perfusion parameter estimates using the 4-parameter model. Figure 8 shows a comparison of the global MBF estimates to the CS flows. The paired sample t-test between the global MBF estimates and CS flows gave a P value of P=0.65 and P=0.67 during rest and stress respectively, indicating that the global MBF estimates are not significantly different from the CS flows in this study.


Full table


Discussion
The main aim of this study is to look at the possibility of improved simultaneous estimation of forward transfer coefficient (Ktrans) and extraction fraction (E) by using ECV values from T1 measurements. The study makes use of a compartmental model approach and exploits the overlap in information provided by DCE-MRI and T1 mapping imaging techniques. The major findings of this study are: (I) extraction fraction and forward transfer coefficient can be simultaneously estimated when ECV is obtained separately; (II) the model is robust to ECV variations within 10% of actual value; (III) consistent with more invasive findings, the extraction fraction estimates using the model were found to be lower at stress compared to rest (10,13-15).
The major advantage of using a compartmental model based approach for quantification of perfusion is the physiological interpretation for the model parameters (9). However, compartment model based approaches can be questioned when extraction fraction of the contrast agent is not part of the model. More complicated perfusion models such as the distributed parameter model, adiabatic tissue homogeneity (ATH) model, and MMID4Jeny (38-40) make it possible to estimate the extraction efficiency along with the many other perfusion parameters. However, these models are complicated and sensitive to noise, and so the perfusion estimates using these complicated models may not be reliable. A recent work by Kunze et al. studied the estimation of microvascular perfusion characteristics such as ECV and PS along with blood flow using ATH and gamma capillary transit time model (24). They agree that, despite being scan-time and contrast media dose efficient, such advanced models have higher implementation effort and post-processing complexity.
Central volume principle based models do not require the use of an extraction fraction to report absolute MBF (30,41). However, these approaches do not have a physiological interpretation of the parameters. Also, the central volume principle based approaches require expert knowledge during model fitting. For example, during Fermi model based analysis, care has to be taken to only include the first pass of the contrast agent. It is during this first pass that the signal changes are more sensitive to flow and not capillary permeability (41). Hence an improper choice of the truncation point for the tissue curves may introduce errors. Similarly, the model-independent approach requires expert choice of regularization parameters. The myocardial perfusion estimates are dependent on the choice of these regularization parameters (42).
Some two-compartment model based studies make an assumption that the value for extraction fraction is fixed (34,43). Even if flow indices (44,45) rather than MBF are considered, this would bias myocardial perfusion reserve (MPR) estimates. That is, using non-extraction corrected compartment model based flow indices may result in underestimation of MPR. However, some investigators have shown that non-extraction corrected compartment models give flows comparable to other validated models at rest (44). Thus, further studies are needed to examine whether extraction fraction correction at rest and stress is necessary when using compartment models.
The model fitting used in this study makes use of ECV estimates from MOLLI T1 mapping for improving the perfusion estimates. The T1 mapping adds little time to the scan protocol. Moreover, according to the 2013 standardized protocols (46), pre-contrast and post-contrast T1 mapping should be included in the protocol for a cardiac MR exam. Estimation of ECV using MOLLI T1 mapping has been validated with high levels of precision and accuracy (20-22). There have been studies indicating that use of MOLLI leads to an underestimation of T1, however a systematic bias in T1 measurements leads to an error of 1% or less in ECV measurements (18).
One of the limitations of this study is the number of subjects in the study. Six subjects with reliable CS flow estimates and rest and stress perfusion studies were used as a proof of concept to estimate extraction fraction and perfusion index jointly. Ten subjects were initially imaged using the protocol described. However, accurate CS flow data could not be obtained in 4 out of the 10 subjects. This may have been due to incorrect prescription of the imaging plane, motion effects, or other phase contrast artifacts. Further study with more subjects, including more with infarct and with other types of cardiac disease, is recommended. Such a study would be helpful to better understand the changes in extraction fraction and flow with disease.
The estimated value of vb for the human datasets was found to be lower compared to that reported by others at rest. The estimated values for vb showed an increase at stress as anticipated. Moreover, the sensitivity analysis plots show that the 4-parameter model tends to underestimate vb compared to its true value during rest. Although this does not affect the estimates of MBF and extraction fraction (as seen from the simulation study), a study focusing on estimation of vb and its comparison with a gold standard could be useful.
For the perfusion sequence in this study, multiple slices were acquired after a single saturation pulse. As a result, different slices have a different saturation recovery time and thus different signal intensities. To account for the difference in signal intensities between slices, the tissue curves were converted to (Gd) using Bloch equations and assuming fast exchange of water. This conversion assumes a saturation efficiency of 100% and that the prescribed flip angle is correct. A study by Broadbent et al. (47) found that a proton density based signal conversion technique as used here is robust to variations in saturation efficiency and flip angle. The assumption of fast water exchange may lead to errors in estimates of perfusion indices (48-50). However, a systematic study by Larsson et al. looking at the effect of water exchange in DCE-MRI concluded that water exchange has negligible effect on estimates of perfusion parameters in the myocardium when a realistic dose of Gd-DTPA is used and extraction fraction is greater than 0.3 (51). The effects of water exchange were considered to be negligible during the current study.
A prior study by Booker et al. (52), looking at time-resolved CS flows after regadenoson administration, found that maximal CS flows were obtained ~75 s (median, with a mean of ~102 s) post administration. Another study by DiBella et al. (53) found that contrast injection ~90 s post regadenoson administration gave blood flow estimates comparable to those using adenosine. In light of these findings, we injected the contrast agent ~70 s after regadenoson administration to image during maximal stress. However, the response to regadenoson may vary between people (54). Similarly, the CS flow imaging following the stress perfusion scan may not be at maximal stress. Based on the results presented in (52), this difference between the actual recorded CS stress flows and CS maximal stress flows may be between 6–18% if imaged 1–3 min after regadenoson administration. Further studies looking at time-resolved CS flows after regadenoson administration may help reduce the margin of error on measured flows.
It is known that ve is significantly different between normal and infarcted myocardium. Two subjects in the study had a focused sub-endocardial infarct. The estimates of ve for these two subjects were obtained by excluding the infarct area. This study shows that it is possible to estimate extraction fraction and forward transfer coefficient simultaneously in large regions without infarct. The findings from this study may be extended into a separate study that looks at the effects of spatially varying ECV on perfusion estimation, and the variation of extraction fraction in regions of fibrosis and infarct.
Conclusions
A new approach combining the information from T1 mapping and DCE-MRI is studied to try and reliably estimate perfusion parameters using a complex pharmacokinetic model. The initial results showing the proof of concept are presented in this article. The technique shows that it may be possible to quantify absolute MBF and extraction using a compartment model based approach. The technique exploits the overlap of information provided by two different cardiac MR imaging techniques. The approach presented opens the prospect of combining different imaging techniques to maximize the information obtained from a single patient study. Further studies should be done to better understand and use such inter-relations between different techniques or modalities.
Acknowledgements
The authors thank Michael Mozdy for technical writing assistance.
Funding: This research was supported by NIH grant (No. R01 HL113224).
Footnote
Conflicts of Interest: The authors have no conflicts of interest to declare.
Ethical Statement: The study was approved by the University of Utah Institutional Review Board (FWA number 00003745). Informed consent from the patients was obtained in accordance with the University of Utah Institutional Review Board.
References
- Jerosch-Herold M, Seethamraju RT, Swingen CM, Wilke NM, Stillman AE. Analysis of myocardial perfusion MRI. J Magn Reson Imaging 2004;19:758-70. [Crossref] [PubMed]
- Christian TF, Rettmann DW, Aletras AH, Liao SL, Taylor JL, Balaban RS, Arai AE. Absolute myocardial perfusion in canines measured by using dual-bolus first-pass MR imaging. Radiology 2004;232:677-84. [Crossref] [PubMed]
- Schuster A, Sinclair M, Zarinabad N, Ishida M, van den Wijngaard JP, Paul M, van Horssen P, Hussain ST, Perera D, Schaeffter T, Spaan JA, Siebes M, Nagel E, Chiribiri A. A quantitative high resolution voxel-wise assessment of myocardial blood flow from contrast-enhanced first-pass magnetic resonance perfusion imaging: microsphere validation in a magnetic resonance compatible free beating explanted pig heart model. Eur Heart J Cardiovasc Imaging 2015;16:1082-92. [Crossref] [PubMed]
- Tomiyama Y, Manabe O, Oyama-Manabe N, Naya M, Sugimori H, Hirata K, Mori Y, Tsutsui H, Kudo K, Tamaki N, Katoh C. Quantification of myocardial blood flow with dynamic perfusion 3.0 Tesla MRI: Validation with (15) O-water PET. J Magn Reson Imaging 2015;42:754-62. [Crossref] [PubMed]
- Fritz-Hansen T, Hove JD, Kofoed KF, Kelbaek H, Larsson HB. Quantification of MRI measured myocardial perfusion reserve in healthy humans: a comparison with positron emission tomography. J Magn Reson Imaging 2008;27:818-24. [Crossref] [PubMed]
- Schmitt M, Horstick G, Petersen SE, Karg A, Hoffmann N, Gumbrich T, Abegunewardene N, Schreiber WG. Quantification of resting myocardial blood flow in a pig model of acute ischemia based on first-pass MRI. Magn Reson Med 2005;53:1223-7. [Crossref] [PubMed]
- Mordini FE, Haddad T, Hsu LY, Kellman P, Lowrey TB, Aletras AH, Bandettini WP, Arai AE. Diagnostic accuracy of stress perfusion CMR in comparison with quantitative coronary angiography: fully quantitative, semiquantitative, and qualitative assessment. JACC Cardiovasc Imaging 2014;7:14-22. [Crossref] [PubMed]
- Patel AR, Antkowiak PF, Nandalur KR, West AM, Salerno M, Arora V, Christopher J, Epstein FH, Kramer CM. Assessment of advanced coronary artery disease: advantages of quantitative cardiac magnetic resonance perfusion analysis. J Am Coll Cardiol 2010;56:561-9. [Crossref] [PubMed]
- Tofts PS, Brix G, Buckley DL, Evelhoch JL, Henderson E, Knopp MV, Larsson HB, Lee TY, Mayr NA, Parker GJ, Port RE, Taylor J, Weisskoff RM. Estimating kinetic parameters from dynamic contrast-enhanced T(1)-weighted MRI of a diffusable tracer: standardized quantities and symbols. J Magn Reson Imaging 1999;10:223-32. [Crossref] [PubMed]
- Ishida M, Ichihara T, Nagata M, Ishida N, Takase S, Kurita T, Ito M, Takeda K, Sakuma H. Quantification of myocardial blood flow using model based analysis of first-pass perfusion MRI: extraction fraction of Gd-DTPA varies with myocardial blood flow in human myocardium. Magn Reson Med 2011;66:1391-9. [Crossref] [PubMed]
- Diesbourg LD, Prato FS, Wisenberg G, Drost DJ, Marshall TP, Carroll SE, O'Neill B. Quantification of myocardial blood flow and extracellular volumes using a bolus injection of Gd-DTPA: kinetic modeling in canine ischemic disease. Magn Reson Med 1992;23:239-53. [Crossref] [PubMed]
- Tong CY, Prato FS, Wisenberg G, Lee TY, Carroll E, Sandler D, Wills J, Drost D. Measurement of the extraction efficiency and distribution volume for Gd-DTPA in normal and diseased canine myocardium. Magn Reson Med 1993;30:337-46. [Crossref] [PubMed]
- Haunsø S, Paaske WP, Sejrsen P, Amtorp O. Capillary permeability in canine myocardium as determined by bolus injection, residue detection. Acta Physiol Scand 1980;108:389-97. [Crossref] [PubMed]
- Svendsen JH, Kelbaek H, Efsen F, Saunamäki KI, Høilund-Carlsen PF, Haunsø S. Myocardial blood flow rate and capillary permeability for 99mTc-DTPA in patients with angiographically normal coronary arteries. Evaluation of the single-injection, residue detection method with intracoronary indicator bolus injection and the use of a mobile gamma camera. Cardiology 1994;85:161-70. [Crossref] [PubMed]
- Svendsen JH, Efsen F, Haunsø S. Capillary permeability of 99mTc-DTPA in canine myocardium determined by intracoronary bolus injection and residue detection. Cardiovasc Res 1989;23:512-9. [Crossref] [PubMed]
- Prato FS, Wisenberg G, Marshall TP, Uksik P, Zabel P. Comparison of the biodistribution of gadolinium-153 DTPA and technetium-99m DTPA in rats. J Nucl Med 1988;29:1683-7. [PubMed]
- Larsson HB, Fritz-Hansen T, Rostrup E, Søndergaard L, Ring P, Henriksen O. Myocardial perfusion modeling using MRI. Magn Reson Med 1996;35:716-26. [Crossref] [PubMed]
- Kellman P, Wilson JR, Xue H, Ugander M, Arai AE. Extracellular volume fraction mapping in the myocardium, part 1: evaluation of an automated method. J Cardiovasc Magn Reson 2012;14:63. [Crossref] [PubMed]
- Kellman P, Wilson JR, Xue H, Bandettini WP, Shanbhag SM, Druey KM, Ugander M, Arai AE. Extracellular volume fraction mapping in the myocardium, part 2: initial clinical experience. J Cardiovasc Magn Reson 2012;14:64. [Crossref] [PubMed]
- Likhite D, Suksaranjit P, Adluru G, Hu N, Weng C, Kholmovski E, McGann C, Wilson B, DiBella E. Interstudy repeatability of self-gated quantitative myocardial perfusion MRI. J Magn Reson Imaging 2016;43:1369-78. [Crossref] [PubMed]
- Singh A, Horsfield MA, Bekele S, Khan JN, Greiser A, McCann GP. Myocardial T1 and extracellular volume fraction measurement in asymptomatic patients with aortic stenosis: reproducibility and comparison with age-matched controls. Eur Heart J Cardiovasc Imaging 2015;16:763-70. [Crossref] [PubMed]
- Roujol S, Weingärtner S, Foppa M, Chow K, Kawaji K, Ngo LH, Kellman P, Manning WJ, Thompson RB, Nezafat R. Accuracy, precision, and reproducibility of four T1 mapping sequences: a head-to-head comparison of MOLLI, ShMOLLI, SASHA, and SAPPHIRE. Radiology 2014;272:683-9. [Crossref] [PubMed]
- Pack NA, Dibella EV, Wilson BD, McGann CJ. Quantitative myocardial distribution volume from dynamic contrast-enhanced MRI. Magn Reson Imaging 2008;26:532-42. [Crossref] [PubMed]
- Kunze KP, Rischpler C, Hayes C, Ibrahim T, Laugwitz KL, Haase A, Schwaiger M, Nekolla SG. Measurement of extracellular volume and transit time heterogeneity using contrast-enhanced myocardial perfusion MRI in patients after acute myocardial infarction. Magn Reson Med 2017;77:2320-30. [Crossref] [PubMed]
- Tofts PS. Modeling tracer kinetics in dynamic Gd-DTPA MR imaging. J Magn Reson Imaging 1997;7:91-101. [Crossref] [PubMed]
- Jerosch-Herold M, Sheridan DC, Kushner JD, Nauman D, Burgess D, Dutton D, Alharethi R, Li D, Hershberger RE. Cardiac magnetic resonance imaging of myocardial contrast uptake and blood flow in patients affected with idiopathic or familial dilated cardiomyopathy. Am J Physiol Heart Circ Physiol 2008;295:H1234-42. [Crossref] [PubMed]
- Bassingthwaighte JB, Goresky CA. Modeling in the analysis of solute and water exchange in the microvasculature. In: Renkin EM, Michel CC. editors. Handbook of Physiology. Section 2. The Cardiovascular System. Bethesda, MD: American Physiological Society, 1984:549-626.
- Kroll K, Wilke N, Jerosch-Herold M, Wang Y, Zhang Y, Bache RJ, Bassingthwaighte JB. Modeling regional myocardial flows from residue functions of an intravascular indicator. Am J Physiol 1996;271:H1643-55. [PubMed]
- Kuikka J, Levin M, Bassingthwaighte JB. Multiple tracer dilution estimates of D- and 2-deoxy-D-glucose uptake by the heart. Am J Physiol 1986;250:H29-42. [PubMed]
- Jerosch-Herold M, Wilke N, Stillman AE. Magnetic resonance quantification of the myocardial perfusion reserve with a Fermi function model for constrained deconvolution. Med Phys 1998;25:73-84. [Crossref] [PubMed]
- Crystal GJ, Downey HF, Bashour FA. Small vessel and total coronary blood volume during intracoronary adenosine. Am J Physiol 1981;241:H194-201. [PubMed]
- Adluru G, McGann C, Speier P, Kholmovski EG, Shaaban A, Dibella EV. Acquisition and reconstruction of undersampled radial data for myocardial perfusion magnetic resonance imaging. J Magn Reson Imaging 2009;29:466-73. [Crossref] [PubMed]
- Rudin LI, Osher S, Fatemi E. Nonlinear total variation based noise removal algorithms. Physica D 1992;60:259-68. [Crossref]
- Ichihara T, Ishida M, Kitagawa K, Ichikawa Y, Natsume T, Yamaki N, Maeda H, Takeda K, Sakuma H. Quantitative analysis of first-pass contrast-enhanced myocardial perfusion MRI using a Patlak plot method and blood saturation correction. Magn Reson Med 2009;62:373-83. [Crossref] [PubMed]
- Likhite D, Adluru G, Hu N, McGann C, DiBella E. Quantification of myocardial perfusion with self-gated cardiovascular magnetic resonance. J Cardiovasc Magn Reson 2015;17:14. [Crossref] [PubMed]
- Donahue KM, Weisskoff RM, Burstein D. Water diffusion and exchange as they influence contrast enhancement. J Magn Reson Imaging 1997;7:102-10. [Crossref] [PubMed]
- Tong CY, Prato FS, Wisenberg G, Lee TY, Carroll E, Sandler D, Wills J. Techniques for the measurement of the local myocardial extraction efficiency for inert diffusible contrast agents such as gadopentate dimeglumine. Magn Reson Med 1993;30:332-6. [Crossref] [PubMed]
- Papanastasiou G, Williams MC, Kershaw LE, Dweck MR, Alam S, Mirsadraee S, Connell M, Gray C, MacGillivray T, Newby DE, Semple SI. Measurement of myocardial blood flow by cardiovascular magnetic resonance perfusion: comparison of distributed parameter and Fermi models with single and dual bolus. J Cardiovasc Magn Reson 2015;17:17. [Crossref] [PubMed]
- Chung S, Shah B, Storey P, Iqbal S, Slater J, Axel L. Quantitative Perfusion Analysis of First-Pass Contrast Enhancement Kinetics: Application to MRI of Myocardial Perfusion in Coronary Artery Disease. PLoS One 2016;11:e0162067. [Crossref] [PubMed]
- Schmitt M, Mohrs OK, Petersen SE, Kreitner KF, Voigtländer T, Wittlinger T, Horstick G, Ziegler S, Meyer J, Thelen M, Schreiber WG. Evaluation of myocardial perfusion reserve in patients with CAD using contrast-enhanced MRI: a comparison between semiquantitative and quantitative methods. Rofo 2002;174:187-95. [Crossref] [PubMed]
- Jerosch-Herold M, Swingen C, Seethamraju RT. Myocardial blood flow quantification with MRI by model-independent deconvolution. Med Phys 2002;29:886-97. [Crossref] [PubMed]
- Pack NA, DiBella EV, Rust TC, Kadrmas DJ, McGann CJ, Butterfield R, Christian PE, Hoffman JM. Estimating myocardial perfusion from dynamic contrast-enhanced CMR with a model-independent deconvolution method. J Cardiovasc Magn Reson 2008;10:52. [Crossref] [PubMed]
- Cullen JH, Horsfield MA, Reek CR, Cherryman GR, Barnett DB, Samani NJ. A myocardial perfusion reserve index in humans using first-pass contrast-enhanced magnetic resonance imaging. J Am Coll Cardiol 1999;33:1386-94. [Crossref] [PubMed]
- Pack NA, DiBella EV. Comparison of myocardial perfusion estimates from dynamic contrast-enhanced magnetic resonance imaging with four quantitative analysis methods. Magn Reson Med 2010;64:125-37. [Crossref] [PubMed]
- Kim TH, Pack NA, Chen L, DiBella EV. Quantification of myocardial perfusion using CMR with a radial data acquisition: comparison with a dual-bolus method. J Cardiovasc Magn Reson 2010;12:45. [Crossref] [PubMed]
- Kramer CM, Barkhausen J, Flamm SD, Kim RJ, Nagel E. Society for Cardiovascular Magnetic Resonance Board of Trustees Task Force on Standardized Protocols. Standardized cardiovascular magnetic resonance (CMR) protocols 2013 update. J Cardiovasc Magn Reson 2013;15:91. [Crossref] [PubMed]
- Broadbent DA, Biglands JD, Ripley DP, Higgins DM, Greenwood JP, Plein S, Buckley DL. Sensitivity of quantitative myocardial dynamic contrast-enhanced MRI to saturation pulse efficiency, noise and t1 measurement error: Comparison of nonlinearity correction methods. Magn Reson Med 2016;75:1290-300. [Crossref] [PubMed]
- Wedeking P, Sotak CH, Telser J, Kumar K, Chang CA, Tweedle MF. Quantitative dependence of MR signal intensity on tissue concentration of Gd(HP-DO3A) in the nephrectomized rat. Magn Reson Imaging 1992;10:97-108. [Crossref] [PubMed]
- Donahue KM, Burstein D, Manning WJ, Gray ML. Studies of Gd-DTPA relaxivity and proton exchange rates in tissue. Magn Reson Med 1994;32:66-76. [Crossref] [PubMed]
- Donahue KM, Weisskoff RM, Chesler DA, Kwong KK, Bogdanov AA Jr, Mandeville JB, Rosen BR. Improving MR quantification of regional blood volume with intravascular T1 contrast agents: accuracy, precision, and water exchange. Magn Reson Med 1996;36:858-67. [Crossref] [PubMed]
- Larsson HB, Rosenbaum S, Fritz-Hansen T. Quantification of the effect of water exchange in dynamic contrast MRI perfusion measurements in the brain and heart. Magn Reson Med 2001;46:272-81. [Crossref] [PubMed]
- Booker OJ, Bandettini P, Kellman P, Wilson J, Leung S, Vasu S, Shanbhag S, Henry J, Lowrey T, Mancini C, Arai AE. Time resolved measure of coronary sinus flow following regadenoson administration. J Cardiovasc Magn Reson 2011;13:O74. [Crossref]
- DiBella EV, Fluckiger JU, Chen L, Kim TH, Pack NA, Matthews B, Adluru G, Priester T, Kuppahally S, Jiji R, McGann C, Litwin SE. The effect of obesity on regadenoson-induced myocardial hyperemia: a quantitative magnetic resonance imaging study. Int J Cardiovasc Imaging 2012;28:1435-44. [Crossref] [PubMed]
- Bhave NM, Freed BH, Yodwut C, Kolanczyk D, Dill K, Lang RM, Mor-Avi V, Patel AR. Considerations when measuring myocardial perfusion reserve by cardiovascular magnetic resonance using regadenoson. J Cardiovasc Magn Reson 2012;14:89. [Crossref] [PubMed]

