
Automated registration and enhanced processing of clinical optical coherence tomography angiography
Introduction
Optical coherence tomography angiography (OCTA) is a novel technique that provides depth-resolved images of circulation in the retina and choroid (1-4). Using the motion of blood cells as intrinsic imaging contrast, it produces high-resolution angiography without the need for dye injection (5,6). Recent advances in computational efficiency (7), removal of projections between different vascular plexuses (8), precise segmentation of retinal layers (9) and quantification of ocular pathologies (5,10,11) have strengthened the potential of OCTA for clinical evaluation. All OCTA algorithms, however, are susceptible to motion artifacts (12).
Although small axial motion can usually be tolerated, transverse eye movements such as microsaccades introduce uncorrectable motion artifacts that manifest as white stripes on en face OCTA. These artifacts can be removed by registering and merging OCT volumes collected at perpendicular scanning directions. This technique, called motion correction technology (MCT) developed by Kraus et al. (13), has been adopted on commerical OCTA systems. Although MCT attenuates motion artifacts, residual line artifacts frequently remain. Additionally, MCT can occasionally introduce new distorted stripes, quilting defects and stretch artifacts (14). In this study, we propose a scheme to automatically detect and eliminate residual lines and distorted stripe artifacts remaining after MCT resulting in enhanced visualization of the retinal vasculature.
Methods
Study population
This study was conducted at the Casey Eye Institute at the Oregon Health & Science University (OHSU). The protocol was approved by the Institutional Review Board/Ethics Committee of OHSU (IRB # 10949 and 10535) and the research adhered to the tenants of the Declaration of Helsinki in the treatment of human participants. Ten healthy participants (age 28±3.4 years), 31 diagnosed with non-proliferative DR, and 5 diagnosed with neovascular age-related macular degeneration (AMD) were recruited and imaged. Participants provided written informed consent prior to their participation in the study.
Data acquisition
The subjects were imaged with the Avanti RTVue-XR OCT system (Optovue, Inc., Fremont, CA, USA), operating at a central wavelength of 840 nm, a bandwidth of 45 nm, and an A-scan rate of 70 kHz. Scans (3 mm × 3 mm) centered at the fovea were acquired on one eye of each participant. Each data set consisted of two volumetric scans acquired at alternative orthogonal scanning directions (X-fast priority and Y-fast priority). A volume consisted of two repeated B-scans at 304 locations (608 B-scans total) with each B-scan consisting of 304 A-scans. Structural and angiography data were acquired simultaneously on each volumetric scan. Blood flow was detected utilizing the split-spectrum amplitude-decorrelation angiography (SSADA) algorithm, which computes the decorrelation between consecutive B-scans at the same position. OCT structural images were generated by averaging two repeated B-scans.
Data processing
For each data set, X-fast and Y-fast volumetric scans were registered and merged through MCT, an orthogonal registration algorithm, which detects displacements between volumes based solely on three dimensional (3D) structural OCT (Figure 1A-C). The transformation recognized by MCT is applied to the SSADA data, forming a registered OCTA volume. En face visualization of flow and artifacts in original and MCT datasets is shown in Figure 1D-F.

Then we removed the shadowgraphic flow projection artifacts from fluctuating shadows of superficial blood flow onto deeper structures (8). The algorithm recognizes the voxels containing in situ flow from the voxels containing projected flow each A-line of the SSADA volume. Then, set the voxels with projected signal to zero. Projection-resolved OCTA (PR-OCTA) allows to differentiates 3 distinct vascular plexuses, prevents overestimation of the perfusion in the deeper plexuses, and enhances the visualization of choroidal neovascularization (CNV) (8).
Then, a directional-graph search method is applied on the structural OCT image for layer segmentation (Figure 2) (9). The inner retinal circulation is segmented into three vascular plexuses: superficial, intermediate and deep. The superficial plexus is located between the nerve fiber layer and the superficial section of the inner plexiform layer (IPL). The intermediate plexus contains the junction of the IPL and the inner nuclear layer (INL). Finally, the deep plexus contains the outer portion of the INL and the outer plexiform layer (9).

En face (2D) angiograms are generated by maximum flow projection of the A-line voxels within the plexus boundaries. En face visualization in Figure 3 confirms that PR-OCTA effectively eliminates the projections of superficial flow casted onto the intermediate and deep plexuses.

Automated detection of remaining artifacts
The resulting en face angiograms of the three plexuses had two remaining artifacts caused by motion: residual lines and distorted stripes. Distorted stripes result from interpolation errors (13). They manifest as pixelated regions where the continuity of vessels is unclear. We identify this artifact by evaluating the correlation of each line with adjacent rows or columns. When a line belongs to a distorted stripe its correlation with the neighbors is lower than in lines unaffected by interpolation. On the other hand, artifacts consisting of residual lines exhibit a larger number of bright pixels than normal lines. To identify them we create a binary map of the angiogram by considering the threshold:
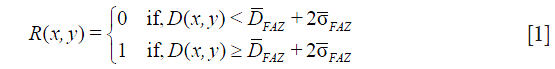
where FAZ is the foveal avascular zone, defined as a 0.6 mm diameter circular region with a center pinpointed by the operator,

Automated registration and selective merging (RSM)
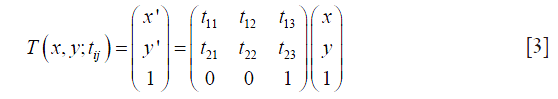
In this step, automated RSM was first applied on the superficial plexuses. Two en face angiograms (D1 and D2) were registered. The image D1 was treated as a reference image and D2 as the source image. D2 was deformed by a geometric transform T such that its points (x,y)' match an analogous point (x,y) in the reference. We identified the optimal transform T with parameters tij that minimizes a least-squares cost function C, expressed as:

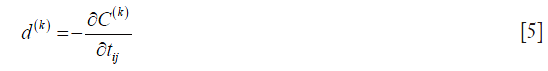
This process was executed by a gradient descent algorithm, where the transformation
was computed iteratively by simultaneously updating the parameters

at each step k where α is the iterative step size and d(k) is a gradient defined as:
Convergence is achieved when the gradient is below a threshold  for all tij(k). After the optimal T is applied to D2, transformed and reference points represent the same anatomical points. Rows and columns of the floating angiogram in the new coordinate frame were selectively merged with the reference by the following protocol:
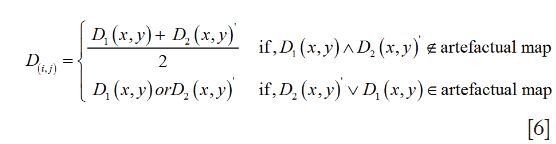
The merged angiogram is represented in Figure 4E. Pixels from overlapping artifacts in both images retained the data from the angiogram containing the lines with highest correlation with neighbors. After this, the same transformation T and merging criteria were applied to the intermediate and deep plexuses.
Dual-scale vesselness filter
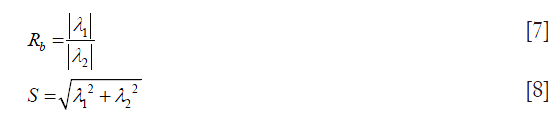
Next, we applied a dual-scale vesselness filter to the RSM image based on the model proposed by Frangi et al. (15), observed in Figure 5. This filter evaluates the prospects of a pixel belonging to a vessel by assessing how “tubular” the structure in its vicinity is. First, we computed the parameters Rb (anisotropy) and S (structure) from the eigenvalues λ of the Hessian matrix:

Then, the vesselness function was calculated by:
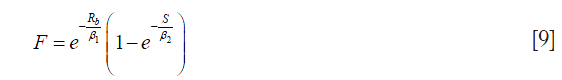
where β1 and β2 are sensitivity constants. Vesselness is low if there is a low intensity change in the vicinity of a pixel (no vessel structure) or the intensity change is large in almost all directions (large anisotropy). We operated in a dual-scale framework in order to ensure adequate response to large vessels and capillaries coexisting in the superficial plexus. The scales were scalars that multiplied the Hessian matrix. They were determined by minimizing the difference between binary masks of the unfiltered and filtered angiograms. A single-scale scheme was applied to the intermediate and deep plexuses, where all vessels exhibit similar diameter. Visualization is shown in the log domain after thresholding FAZ noise.
Image quality assessment
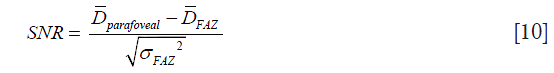
To quantify image quality after RSM and dual-scale vesselness, parafoveal signal-to-noise ratio (SNR) was calculated on angiograms of the three plexuses. We defined the parafovea as the annular ring between diameters 1.3 and 2 mm centered at the FAZ (7).
Additionally, we evaluated the effect of the dual-scale vesselness filter in improving the visualization of angiograms. The entropy of the grayscale images D measured the dispersion of the probability distribution of pixel intensities. Images with high entropy exhibit a large amount of detail and high contrast. It was computed by
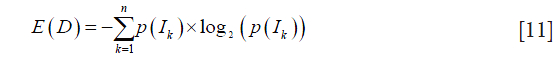
where p(Ik) is the probability of a pixel having the intensity value Ik and n is the number of pixel intensities existing in the image’s histogram.
Furthermore, vessel density was evaluated to determine whether more capillary network can be resolved by the proposed methods. This metric has previously been utilized in the assessment of retinal perfusion in DR (4,16). Vessel density is defined as the percent area occupied by blood flow pixels within the parafoveal annulus. It is calculated by considering all pixels with amplitude greater than the threshold defined in Eq. [1].
Results
Application in healthy OCTA
Three plexuses from ten healthy eyes were evaluated. One example case is depicted in Figure 6. Residual artifacts marked by black arrows in Figure 6A are eliminated in Figure 6B. RSM angiograms exhibit reduction of noise (Figure 6B,E,H) and RSM with dual-scale vesselness further improves the vasculature visualization (Figure 6C,F,I) in all plexuses.

FAZ noise increases with retinal depth, deteriorating the SNR in the intermediate and deep plexuses. However, RSM improves the SNR in all plexuses, as observed in Figure 6 and calculated in Table 1. RSM images are obtained after averaging of angiogram sections during selective merging, conducing to a reduced value of σFAZ and hence, higher SNR.

Full table
In terms of visualization improvement, the entropy of images increases for all plexuses after the application of RSM and vesselness filter, demonstrated in Table 2. The entropy in RMS with vesselness angiograms (Figure 6C,F,I) increases due to the attenuation of background pixels and a more prominent flow signal in capillary pixels, resulting in improved capillary visualization with respect to MCT (Figure 6A,D,G). Table 3 also shows that the larger entropy improvement occurs in the deep plexus.

Full table

Full table
Vessel density from 10 healthy and 10 diabetic participants is quantified in Table 3. We observed a reduced inter-subject variation after RSM and dual-scale vesselness in both groups, as evidenced by the lower standard error. After RSM and filtering, the vessel density in the intermediate and deep plexuses increases with respect to the MCT case, in good correspondence with the improved vessel connectivity observed in Figure 6. A closer look at the vessel connectivity in the deep plexus is shown in Figure 7. Observe that the number of low-intensity flow pixels recuperated after the application of RSM and vesselness is substantially larger than the number of pixels filtered out.

Vasculature integrity in diabetic retinopathy
En face angiograms of the full inner retinal flow can be visualized in Figure 8. Flow corresponding to different plexuses is represented in different colors. Two of the sections with deteriorated flow signal due to a vertical and a horizontal distorted stripe (Figure 8A,B) are selectively retrieved after RSM and vesselness filter (Figure 8C). Resulting from this, an improved vessel connectivity is observed at all artifactual stripes. Moreover, distortion in the sections where vertical and horizontal stripes overlap is undetectable by visual inspection in Figure 8C.

Inner retina of a subject with diabetic retinopathy. Color-coded vascular data is overlaid in a single angiogram representing the superficial plexus (red), intermediate plexus (green) and deep plexus (blue). (A) and (B) show two angiograms of the same eye affected by motion; (C) is the enhanced version after RSM and vesselness filter. RSM, registration and selective merging.
Vasculature integrity in neovascular AMD
Improvement of the vessel connectivity is also observed in subjects with AMD. One case is illustrated in Figure 9. Noise and discontinuities are common problems in the visualization of vasculature detail in CNV, as it can be observed in Figure 9A. Improvement of the SNR after RSM can be appreciated in Figure 9B. In Figure 9C the vesselness filter was applied to one of the MCT images without undergoing RSM. Although it allowed an improved visualization of the CNV architecture with good contrast, a large amount of noise pixels was also amplified by the filter. Noise was largely reduced when the vesselness filter was applied to the RSM angiogram (Figure 9D).

Discussion
We have demonstrated a method that automatically detects and eliminates artifacts that persist on OCTA after MCT. The algorithm is computationally efficient, since it is applied to the en face angiograms instead of volumes. All visually recognizable artifacts can be identified and eliminated by this method. Systems that do not use MCT but rely on eye tracking also have linear motion artifacts (17). The proposed algorithm can synergistically reduce artifacts with either MCT or real-time eye tracking.
Filtering schemes have been used in OCTA to improve visualization (18) and quantification (19). However, all these schemes, including vesselness, can alter the diameter of the vessels or filter out small capillaries. In order to avoid these issues, we adjusted the sensitivity constants a priori, ensuring that the vessel diameter in the intermediate and deep plexuses is equal to a binary mask of the RSM angiograms.
The vessel density based on flow signal after RSM and vesselness showed lower inter-subject variation, as evidenced by the reduced standard error in Table 3. The vessel density is usually calculated by utilizing the threshold defined in Eq. [1] as a condition for vessel affiliation (16). However, elevated noise and residuals of motion artifacts in MCT angiograms can introduce inaccuracies. A recent work by Gadde et al. (19) utilized an alternative method that identifies vessel affiliation after a filtering scheme based on the local fractal dimension. In our approach, we applied RSM before the vesselness filter. Although the RSM angiogram indeed improved SNR, it could not improve the standard error of the calculated vessel density in any of the plexuses. The reduction of the standard error was only achieved after application of the vesselness filter. The standard error of our measurements is similar to that obtained by the method used by Gadde et al. (19), and indicate that these vessel affiliation criteria may allow a better repeatability than simply thresholding using FAZ noise as reference. The accuracy of the different methods discussed here for vessel density calculation can only be verified by a histological study.
In summary, RSM, paired with a 2-dimensional vesselness filter can eliminate residual artifacts in OCTA processed with MCT. The resulting images have improved SNR and reduced inter-subject variation in vessel density among normal subjects. The vessel connectivity and vascular details are improved on all retinal plexuses for healthy eyes and diseased eyes. Applying these techniques may improve quantification of the retinal vasculature and clinical evaluation of OCTA.
Acknowledgements
Funding: This work was supported by grant DP3 DK104397, R01 EY024544, R01 EY023285, P30 EY010572 from the National Institutes of Health (Bethesda, MD, USA), and by unrestricted departmental funding from Research to Prevent Blindness (New York, NY, USA).
Footnote
Conflicts of Interest: Oregon Health & Science University (OHSU), Yali Jia and David Huang have a significant financial interest in Optovue, Inc. David Huang also has a financial interest in Carl Zeiss Meditec. These potential conflicts of interest have been reviewed and managed by OHSU.
Ethical Statement: The study was approved by the Institutional Review Board/Ethics Committee of OHSU (No. 10949 and 10535) and written informed consent was obtained from all patients.
References
- Jia Y, Tan O, Tokayer J, Potsaid B, Wang Y, Liu JJ, Kraus MF, Subhash H, Fujimoto JG, Hornegger J, Huang D. Split-spectrum amplitude-decorrelation angiography with optical coherence tomography. Opt Express 2012;20:4710-25. [Crossref] [PubMed]
- Wang RK, Jacques SL, Ma Z, Hurst S, Hanson SR, Gruber A. Three dimensional optical angiography. Opt Express 2007;15:4083-97. [Crossref] [PubMed]
- Makita S, Jaillon F, Yamanari M, Miura M, Yasuno Y. Comprehensive in vivo micro-vascular imaging of the human eye by dual-beam-scan Doppler optical coherence angiography. Opt Express 2011;19:1271-83. [Crossref] [PubMed]
- Makita S, Hong Y, Yamanari M, Yatagai T, Yasuno Y. Optical coherence angiography. Opt Express 2006;14:7821-40. [Crossref] [PubMed]
- Jia Y, Bailey ST, Hwang TS, McClintic SM, Gao SS, Pennesi ME, Flaxel CJ, Lauer AK, Wilson DJ, Hornegger J, Fujimoto JG, Huang D. Quantitative optical coherence tomography angiography of vascular abnormalities in the living human eye. Proc Natl Acad Sci U S A 2015;112:E2395-402. [Crossref] [PubMed]
- López-Sáez MP, Ordoqui E, Tornero P, Baeza A, Sainza T, Zubeldia JM, Baeza ML. Fluorescein-induced allergic reaction. Ann Allergy Asthma Immunol 1998;81:428-30. [Crossref] [PubMed]
- Gao SS, Liu G, Huang D, Jia Y. Optimization of the split-spectrum amplitude-decorrelation angiography algorithm on a spectral optical coherence tomography system. Opt Lett 2015;40:2305-8. [Crossref] [PubMed]
- Zhang M, Hwang TS, Campbell JP, Bailey ST, Wilson DJ, Huang D, Jia Y. Projection-resolved optical coherence tomographic angiography. Biomed Opt Express 2016;7:816-28. [Crossref] [PubMed]
- Zhang M, Wang J, Pechauer AD, Hwang TS, Gao SS, Liu L, Liu L, Bailey ST, Wilson DJ, Huang D, Jia Y. Advanced image processing for optical coherence tomographic angiography of macular diseases. Biomed Opt Express 2015;6:4661-75. [Crossref] [PubMed]
- Jia Y, Morrison JC, Tokayer J, Tan O, Lombardi L, Baumann B, Lu CD, Choi W, Fujimoto JG, Huang D. Quantitative OCT angiography of optic nerve head blood flow. Biomed Opt Express 2012;3:3127-37. [Crossref] [PubMed]
- Jia Y, Bailey ST, Wilson DJ, Tan O, Klein ML, Flaxel CJ, Potsaid B, Liu JJ, Lu CD, Kraus MF, Fujimoto JG, Huang D. Quantitative optical coherence tomography angiography of choroidal neovascularization in age-related macular degeneration. Ophthalmology 2014;121:1435-44. [Crossref] [PubMed]
- Martinez-Conde S, Macknik SL, Hubel DH. The role of fixational eye movements in visual perception. Nat Rev Neurosci 2004;5:229-40. [Crossref] [PubMed]
- Kraus MF, Potsaid B, Mayer MA, Bock R, Baumann B, Liu JJ, Hornegger J, Fujimoto JG. Motion correction in optical coherence tomography volumes on a per A-scan basis using orthogonal scan patterns. Biomed Opt Express 2012;3:1182-99. [Crossref] [PubMed]
- Spaide RF, Fujimoto JG, Waheed NK. Image artifacts in optical coherence tomography angiography. Retina 2015;35:2163-80. [Crossref] [PubMed]
- Frangi AF, Niessen WJ, Vincken KL, Viergever MA. Multiscale vessel enhancement filtering. Lecture Notes in Computer Science 1998;1496:130-7. [Crossref]
- Hwang TS, Gao SS, Liu L, Lauer AK, Bailey ST, Flaxel CJ, Wilson DJ, Huang D, Jia Y. Automated Quantification of Capillary Nonperfusion Using Optical Coherence Tomography Angiography in Diabetic Retinopathy. JAMA Ophthalmol 2016;134:367-73. [Crossref] [PubMed]
- Staurenghi G, Cunha-Vaz J, Korobelnik JF. Optical Coherence Tomography Angiography of the Retinal Microvasculature using the Zeiss AngioPlex. European Ophthalmic Review 2015;9:147. [Crossref]
- Hendargo HC, Estrada R, Chiu SJ, Tomasi C, Farsiu S, Izatt JA. Automated non-rigid registration and mosaicing for robust imaging of distinct retinal capillary beds using speckle variance optical coherence tomography. Biomed Opt Express 2013;4:803-21. [Crossref] [PubMed]
- Gadde SG, Anegondi N, Bhanushali D, Chidambara L, Yadav NK, Khurana A, Sinha Roy A. Quantification of Vessel Density in Retinal Optical Coherence Tomography Angiography Images Using Local Fractal Dimension. Invest Ophthalmol Vis Sci 2016;57:246-52. [Crossref] [PubMed]

