
Automated quantification of myocardial infarction using graph cuts on contrast delayed enhanced magnetic resonance images
Abstract
In this work, we propose a semi-automated myocardial infarction quantification method for cardiac contrast delayed enhancement magnetic resonance images (DE-MRI). Advantages of this method include that it reduces manual contouring of the left ventricle, obviates a remote myocardium region, and automatically distinguishes infarct, healthy and heterogeneous (“gray zone”) tissue despite variability in intensity and noise across images. Quantitative evaluation results showed that the automatically determined infarct core and gray zone size have high correlation with that derived from the averaged results of the manual full width at half maximum (FWHM) methods (R2=0.99 for infarct core and gray zone size). Compared with the manual method, a much better reproducibility was achieved with the proposed algorithm and it shortens the evaluation time to one second per image, compared with 2-5 min per image for the manual method.
Key words
Cardiac MRI; delayed enhancement; infarct heterogeneity; infarct core; gray zone
Introduction
Delayed enhancement magnetic resonance imaging (DE-MRI) is an imaging method for identifying myocardial infarct (MI) (1). Enhanced signal intensity on DE-MRI images indicates an MI that can be separated into infarct core and heterogeneous periphery (“gray zone”) that is a mixture of viable and non-viable peri-infarct myocardium. Recent studies have shown that in patients with a prior MI, the extent of the gray zone provides incremental prognostic value beyond left ventricular systolic volume index or ejection fraction (2), and correlates with inducibility for ventricular tachycardia (VT) (3). Therefore, it is of great interest to accurately quantify both infarct core and gray zone size in DE-MRI images. Currently, the conventional DE-MRI is acquired with an inversion-recovery gradient echo (IR-GRE) sequence performed after the administration of contrast agent that yields a single image at an inversion time chosen to null the signal from healthy myocardium, such that the MI appears with signal intensity above normal myocardium.
A number of semi-automatic methods have been proposed to quantify infarct from MRI, which can be categorized as threshold-based methods, learning methods and comprehensive methods. (I) The threshold based methods use either standard deviation (SD) (4), full width half maximum (FWHM) (4), or direct thresholds (5), or a mixture model (6). (II) The unsupervised and supervised learning methods use either fuzzy c-mean clustering (7) or support vector machines (8). (III) The comprehensive methods use automated feature analysis and combined thresholds (9), combined intensity and spatial information (10), fast level sets (11), and fast region competition (12).
A common disadvantage of the threshold-based methods and learning methods is the lack of boundary information. Therefore, the results will often include isolated false infarct regions that are due to noise. To ameliorate this issue the proposed comprehensive methods incorporate boundary information. However, these methods are multi-step approaches, whereby the results of thresholds provide an initial segmentation and then remove false regions by energy minimization or feature analysis. Global properties of such techniques may be difficult to analyze and predict.
Currently, SD and FWHM methods are frequently utilized clinically due to their simplicity. For both methods, three manual contours are drawn including endocardial and epicardial contours to exclude non-myocardial regions, and a third contour is required to define signal intensity of healthy myocardium, drawn as a region remote from the infarct. These methods are limited because the manual drawing of contours is time consuming and suffers from interobserver and intraobserver variability. The difficulty in reproducible manual delineation of remote myocardium is an important contributor to overall quantification variability. Furthermore, the dependence on the remote myocardium region statistics is problematic due to the low signal to noise ratio (SNR) of healthy myocardium in this MRI sequence (2).
In this work, we developed semi-automatic infarct quantification of infarct and gray zone with two important contributions. (I) The determination of endocardial and epicardial contours by propagation of automatically delineated contours from the cine steady-state free precession (SSFP) image to the corresponding (same exam and cardiac phase) DE-MRI image. (II) The algorithm also eliminates the requirement for drawing the remote myocardium region by means of a graph cuts based method to optimize the segmentation of infarct from healthy tissue.
Materials and methods
Datasets
Ten patients (9 male, 1 female, age: 66.1±12.1 yr) with chronic MI referred for cardiac MR scans were included in this study. MR imaging was performed on a 1.5 T scanner (CV/i, GE Healthcare, Milwaukee, WI) using an 8-channel cardiac coil. Short axis cine SSFP images were acquired to cover the entire LV. The imaging parameters were as follows: image size, 256×256; contiguous sections, 10-14; section thickness, 8-10 mm; slice gap, 0 mm; and number of phases, 20. DE-MRI was started 10 minutes after the injection of 0.2 mmol/kg of Gd-DTPA (Magnevist, Berlex, Inc., Wayne, NJ). The DE-MRI images were acquired in the same imaging planes as the cine SSFP images. Imaging parameters were: image size, 256×256; slice thickness, 8 mm. The patients consented to research use of their imaging data, with approval by our institutional ethics review board.
Spatial and temporal alignment of cine SSFP and DE-MRI images
DE-MRI series images are normally scanned immediately following cine SSFP series images in a clinical exam. Cine SSFP images provide high contrast visualization of the myocardium with bright blood pool and dark myocardium. A cine SSFP dataset is 4-dimensional (4-D) in that it is comprised of a stack of slices for each cardiac phase of a set sampled from the cardiac cycle. Unlike the cine data, DE-MRI data is 3-dimensional, i.e. comprised of slices at only one phase, temporally located between end-systole and end-diastole. Since the patient is asked to stay still during the entire acquisition process, there is minimal patient torso motion between the cine SSFP and DE MRI series, that will affect the propagation of cine SSFP image contours to the DE images. For a given DE image the corresponding cine image may be found by matching the DICOM meta-information for slice location and trigger time. Slice location is defined as the relative position of the image plane expressed in the same coordinates for both series of the exam. Trigger time is approximately the time interval from the start of the R-wave to the midpoint of the data acquisition for that image. For each DE image, the cine image with nearest slice location and trigger time is selected as the corresponding image.
Cine SSFP image segmentation
First, the LV blood pool is located by calculating the centroid of the LV blood pool on the middle slice at the specified phase based by a roundness metric technique. Second, the endocardial and papillary muscles’ and trabeculations’ contours are detected by applying the optimal threshold method of Otsu and 1-dimensional (1-D) fast Fourier transform method. Finally, the epicardial contour is calculated by mapping the pixels from Cartesian to approximately polar coordinates, and using the multiple seed, region growing method. For a more detailed description please refer to (13). The delineated epicardial and endocardial contours are then propagated to the corresponding DE image.
Infarct segmentation using graph cuts
To separate infarct from healthy myocardium, graph cuts (14) technique was applied. If we define G=(V,E) be a weighted graph with two distinguished verticals called the terminal nodes. A cut E⊂C is a set of edges such that the terminal nodes are separated in the induced graph ), ![]() . The cost
. The cost ![]() of the cut C is defined as the sum of its edges weights. The minimum cut problem is to find the cheapest cut among all cuts that separate the terminal nodes. We can consider each image voxel as a node in the graph. Each of the voxel nodes has edges that connect it to its neighbors (N-links), and the two terminal nodes (T-links). A minimal cut generates a segmentation that depends on the definition of the edge weights and choice of the energy function. In this work, the two terminal nodes are defined as healthy myocardium and infarct myocardium (combined infarct core and gray zone), analogous to the image background and foreground of general image segmentation problems. The energy function is defined as:
of the cut C is defined as the sum of its edges weights. The minimum cut problem is to find the cheapest cut among all cuts that separate the terminal nodes. We can consider each image voxel as a node in the graph. Each of the voxel nodes has edges that connect it to its neighbors (N-links), and the two terminal nodes (T-links). A minimal cut generates a segmentation that depends on the definition of the edge weights and choice of the energy function. In this work, the two terminal nodes are defined as healthy myocardium and infarct myocardium (combined infarct core and gray zone), analogous to the image background and foreground of general image segmentation problems. The energy function is defined as:
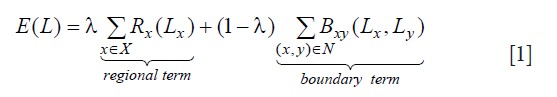
Where, ![]() denotes a segmentation, X is the voxel set, N is the neighboring relations on the voxels. Rx is called the regional (or data) term, which evaluates the fit of the class membership (infarct or healthy myocardium) to the data pixel intensities given our histogram model. We use the probability obtained from the Gaussian mixture model to set the regional term weights:
denotes a segmentation, X is the voxel set, N is the neighboring relations on the voxels. Rx is called the regional (or data) term, which evaluates the fit of the class membership (infarct or healthy myocardium) to the data pixel intensities given our histogram model. We use the probability obtained from the Gaussian mixture model to set the regional term weights:
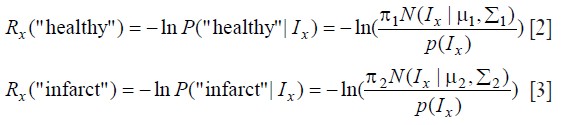
Where, Ix is the intensity at voxel x ![]() , πk is mixture weighting coefficients, μk is the mean, Σk is the covariance matrix, (N(.) is Gaussian probability distribution. k is the Gaussian mixture components (in this work, k=1 corresponds to healthy myocardium and k=2 corresponds to infarct). The boundary term Bxy evaluates the penalty for edges between pixels (8-way connected neighborhood), and it is defined as:
, πk is mixture weighting coefficients, μk is the mean, Σk is the covariance matrix, (N(.) is Gaussian probability distribution. k is the Gaussian mixture components (in this work, k=1 corresponds to healthy myocardium and k=2 corresponds to infarct). The boundary term Bxy evaluates the penalty for edges between pixels (8-way connected neighborhood), and it is defined as:
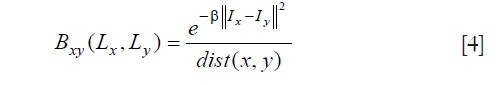
where, dist(x, y) is the Euclidean distance between pixel x and y, and β is the penalty coefficient. In this work, β was fixed to 5 to increase the relative importance of high gradient between pixels of different class. λ was fixed at 0.5, so that both terms had the same weighting in the graph cuts energy functional.
Infarct core and gray zone segmentation
To discriminate the infarct core from the gray zone within the automatically detected infarct area, we apply the FWHM technique, that has the following definition for the signal intensities of the infarct core pixels (SIi):

The SIa is the pixel signal intensity of the detected infarct pixels. The pixels remaining in the total infarct after subtracting the infarct core are defined as gray zone.
Evaluation and statistical analysis
In order to evaluate the performance of the proposed method, the manual FWHM approach was implemented for comparison. Our selection of the manual FWHM method as our approximation of ground truth is due to evidence that it is less sensitive to noise, surface coil intensity variations and is frequently used in the clinical routine.
The endocardial and epicardial contours were propagated from cine SSFP to DE-MRI using in-house software. These were checked by visual assessment of a trained observer, and manual corrections were applied if necessary. A remote myocardium region was also drawn by this observer. Two remote myocardium regions were drawn by a second trained observer (blinded to the remote region of the first observer) using only the endocardial and epicardial contours delineated by the first observer. The first remote myocardium region was used to measure the interobserver variability. Intraobserver variability of the second observer was also measured. The size variability is expressed as the difference in the observers’ measurements of the size as a percentage of the average value of the total size, calculated for infarct core and gray zone.
Linear regression analysis was used to compare the proposed algorithm’s results with the manual FWHM method. The latter method has variability as previously discussed, and therefore this reference standard incorporated the average value of three different remote myocardium regions where two of these regions was obtained from the same observer. Results were assessed with Bland-Altman analyses. The computation time was tested on consumer hardware (2×2.8 GHz Quad-core Intel Xeon Mac Pro, Apple) with a non-optimized Matlab code implementation.
Results
The automatic propagation of endocardial and epicardial contours from cine SSFP to DE-MRI required manual correction for 49% of the contours (66/136). Subsequent quantification used the corrected LV contours. Table 1 shows the interobserver and intraobserver variability of the infarct core and gray zone due to different location of remote myocardium regions. There were excellent correlations of the infarct core mass (y=1.04 x –0.65, R2=0.99) and gray zone mass (y=1.10 x –2.17, R2=0.99) detected, when comparing the proposed algorithm’s results to the manual FWHM reference (Figure 1 A, B). The Bland-Altman analysis confirmed the good agreement (Figure 1 C, D). The mean differences were small (–0.16 g for infarct core and –1.07 g for gray zone) and the limits of agreement (±1.96 SD) were ±1.20 g for infarct core mass, and ±1.92 g for gray zone mass. Representative segmentation results are shown in Figure 2.


| Table 1 Variability in infarct core and gray zone size introduced by remote region | |||||
| FWHM | Proposed method | ||||
| Infarct core (%) | Gray zone (%) | Infarct core (%) | Gray zone (%) | ||
| Interobserver | 1.34 | 7.98 | 0 | 0 | |
| Intraobserver | 0.82 | 18.10 | 0 | 0 | |
With the proposed method, the average computation time of cine SSFP segmentation was 0.8 s per image, and infarct core and gray zone segmentation was 0.1 s per image.
Discussion
In this work, we investigated a novel method for automated infarct quantification. Main characteristics of the proposed method are: (I) Automatic epicardial and endocardial contour segmentation by propagating the automated delineated contours from the corresponding cine SSFP image to the DE-MRI image. (II) Automatic determination of the infarct region without requiring a contoured remote myocardium region, which is beneficial because the remote region has low SNR and significant variability. (III) The proposed method does not generate false infarct regions, that are routinely the result of manual FWHM and similar threshold methods, since graph cuts combines the intensity and boundary information. (IV) The analysis time was shortened to about 1 s per image (0.8 s for cine SSFP segmentation plus 0.1 s for infarct segmentation), compared with the 2-5 min for the manual method.
A limitation of the proposed method is that 49% contours (66/136) required manual corrections because of misalignment and deformations between cine and DE-MRI data due to the respiration and unintentional patient movements. In future work we will apply registration between the cine SSFP and DE-MRI images.
In conclusion, these preliminary results for the proposed semi-automated segmentation technique indicate that it is fast, reproducible, highly correlated to standard manual analysis, and will be beneficial for the quantification of cardiac DE-MRI images in clinical practice.
Acknowledgements
Disclosure: The authors declare no conflict of interest.
References
- Kim RJ, Albert TS, Wible JH, et al. Performance of delayed-enhancement magnetic resonance imaging with gadoversetamide contrast for the detection and assessment of myocardial infarction. Circulation 2008;117:629-37.
- Yan AT, Shayne AJ, Brown KA, et al. Characterization of the peri-infarct zone by contrast-enhanced cardiac magnetic resonance imaging is a powerful predictor of post-myocardial infarction mortality. Circulation 2006;114:32-9.
- Schmidt A, Azevedo CF, Cheng A, et al. Infarct tissue heterogeneity by magnetic resonance imaging identifies enhanced cardiac arrhythmia susceptibility in patients with left ventricular dysfunction. Circulation 2007;115:2006-14.
- Flett AS, Hasleton J, Cook C, et al. Evaluation of techniques for the quantification of myocardial scar of differing etiology using cardiac magnetic resonance. JACC Cardiovasc Imaging 2011;4:150-6.
- Roes SD, Borleffs CJ, van der Geest RJ, et al. Infarct tissue heterogeneity assessed with contrast-enhanced MRI predicts spontaneous ventricular arrhythmia in patients with ischemic cardiomyopathy and implantable cardioverter-defibrillator. Circ Cardiovasc Imaging 2009;2:183-90.
- Hennemuth A, Seeger A, Friman O, et al. A comprehensive approach to the analysis of contrast enhanced cardiac MR images. IEEE Trans Med Imaging 2008;27:1592-610.
- Positano V, Pingitore A, Giorgetti A, et al. A fast and effective method to assess myocardial necrosis by means of contrast magnetic resonance imaging. J Cardiovasc Magn Reson 2005;7:487-94.
- O’Donnell T, Xu N, Setser R, et al. Semi-automatic segmentation of nonviable cardiac tissue using cine and delayed enhancement magnetic resonance images. Proc SPIE 2003;5031:242.
- Hsu LY, Natanzon A, Kellman P, et al. Quantitative myocardial infarction on delayed enhancement MRI. Part I: Animal validation of an automated feature analysis and combined thresholding infarct sizing algorithm. J Magn Reson Imaging 2006;23:298-308.
- Tao Q, Milles J, Zeppenfeld K, et al. Automated segmentation of myocardial scar in late enhancement MRI using combined intensity and spatial information. Magn Reson Med 2010;64:586-94.
- Heiberg E, Engblom H, Engvall J, et al. Semi-automatic quantification of myocardial infarction from delayed contrast enhanced magnetic resonance imaging. Scand Cardiovasc J 2005;39:267-75.
- Elagouni K, Ciofolo-Veit C, Mory B. Automatic segmentation of pathological tissues in cardiac MRI. IEEE International Symposium on Biomedical Imaging: From Nano to Macro 2010;472-5.
- Lu Y, Radau P, Connelly K, et al. Segmentation of Left Ventricle in Cardiac Cine MRI : An Automatic Image-Driven Method. Methods. Functional Imaging and Modeling of the Heart 2009;339-47.
- Boykov Y, Veksler O. Fast approximate energy minimization via graph cuts. IEEE Trans Pattern Anal Mach Intell 2001;23:1222-39.

