
Image segmentation for integrated multiphoton microscopy and reflectance confocal microscopy imaging of human skin in vivo
Introduction
The development of non-invasive diagnostic imaging techniques for examining the microstructure of skin is of great interest for improving clinical diagnosis. Two techniques that have garnered much attention in recent years for dermatology use are reflectance confocal microscopy (RCM) and multiphoton microscopy (MPM). The optical sectioning capability of RCM has allowed in vivo, high resolution morphological images of the skin (1). MPM also has inherent optical sectioning capability due to the nonlinear excitation process that obviates the need for a pinhole to reject out-of-focus light. Different MPM excitation mechanisms are sensitive to different biochemical components of tissue (2-4). Combining both RCM and MPM imaging (hereby called RCM/MPM imaging) potentially allows greater clinical diagnostic utility as complementary information can be revealed using the two techniques (5). We have demonstrated an integrated RCM/MPM instrument capable of simultaneously imaging human skin in vivo at up to 27 fps (5). The new challenges for clinical applications of this multimodality imaging technology are the automatic delineation (i.e., segmentation) of cellular and subcellular architectural features on the RCM and MPM images of human skin in vivo.
Cell segmentation is the essential first step in biomedical image analysis for obtaining information about objects size, area, or shape and other useful properties, as well as for locating their positions. Several algorithms for cell segmentation have been published. Image threshold (6) is the simplest method for high-speed segmentation, but it produces good results only for images with high contrast between object and background (7-9). Another common technique uses the concept of morphological image processing and considers contextual information to produce stable segmentation results (8). And marker-controlled strategies are usually utilized for avoiding over-segmentation of watershed transform (9). Spectral clustering maps the segmentation problem into graph models and uses them to find meaningful objects (10). Deformable models identify the boundaries of the object of interest by gradual development of contours or surfaces guided by internal and external forces, and include snake and balloon algorithms (11-13). Additional algorithms for image segmentation applied to the biomedical field can be found in (14-16). Considering the tradeoff between algorithmic complexity and the precision of segmentation results in our application, we adopted the watershed-based approach and incorporated some principles of the level-set method to segment cells in our in vivo multimodality (RCM/MPM) human skin images.
In this work, we focus on the design and development of an algorithm that automatically isolates and segments individual cells from RCM/MPM images. Detailed experimental setup and discussion of our current RCM/MPM imaging of human skin in vivo can be found in (5) and will not be presented here. Section 2 details the proposed algorithm for cell segmentation. Section 3 shows the experimental results. Section 4 presents the conclusions.
Methods
Cell structure segmentation from RCM image
Cell structure segmentation is a crucial stage in the proposed cell segmentation algorithm because the subsequent stage of nucleus and cytoplasm segmentation references valid cell structure, which can be thought of as the initial condition of the optimization problem of whole cell segmentation in order to guide the algorithm in finding a feasible solution with high performance. Cell structure segmentation is performed using gradient watershed transform to obtain accurate segmented cell structure. Watershed transform, which considers contextual information in an image and identifies the regional minima, is chosen here for cell structure segmentation. In observation of RCM image (e.g., Figure 1A), lower intensity area of a cell locates in the regional minima of images, and cell boundaries with bright intensity are in the regional maxima. Each cell is correlated with homogeneous structure in the RCM image, showing a honey-comb shaped structure in whole image. Therefore, we utilize the gradient map with prior information for the boundaries of cell to help extract and analyze the almost uniform and round cells. Direct application of the watershed segmentation algorithm by flooding from the regional minimums generally leads to over-segmentation due to noise and other local irregularities of the gradient map. To have a robust gradient map, we use the Gaussian filter to calculate gradient maps in order to smooth the noise and merge adjacent regions accordingly, where the radius of Gaussian filter is adjusted according to the average size of cells. After filtering the RCM image, each cell in honey-comb shaped structure is highly correlated with homogeneous regions in the gradient map. Then the classical watershed is used to segment the cell boundaries on RCM image.

Cell nucleus segmentation from MPM image
Based on the accurate position of cell boundary from RCM image, the relative position of each cells on the MPM image can be confirmed corresponding to the RCM image without the need of aligning the two imaging modes (5), which is a significant advantage of our system with simultaneous co-registered RCM and MPM imaging. In observation of the MPM image (e.g., Figure 1B), we see a granulated background distribution in the whole picture. And there is a low dynamic range of the intensities over the MPM images. Cytoplasm is with higher intensity, cell nucleus and other areas have similar intensity and are darker than the cytoplasm. Some cell nucleuses are not surrounded in the cytoplasm in all directions, where cytoplasms were not completely closed. Based on the anatomical features seen in the MPM images in vivo, the global region-based energy level-set method is more suitable for segmenting cell nucleus then other level-set methods. A general expression of the global energy level-set function (EG) to be minimized can be formulated as

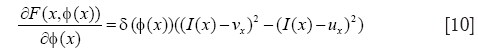
Where I(x) is the intensity at position x of the image, δ is the Dirac function, and F is given by

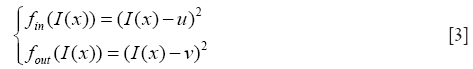
H is the Heaviside function, fin and fout provide energy criteria attached to the inside and outside region delimited by interface, and still given through the Chan-Vese function as
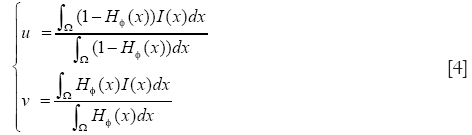
u and v are two parameters of the mean image inside and outside the interface which updated at each iteration as follows:
The first integral of [1] corresponds to a data attachment term and the second is a regularization term that minimizes the length of the curve, thereby, smoothing the evolving contour in the course of its evolution. The evolution equation is

Cytoplasm segmentation from MPM image
After obtained the contour of cell nucleus, cytoplasm can be segmented further. For the homothetic mean intensity of cell nucleus and cell border, and several connected status with them shown in MPM image, level-set method utilizing the localized region-based energy can be used to separate the image into two homogeneous regions, cytoplasm and non-cytoplasm, according to their mean values. A framework of localized region-based energy formulation in level-set segmentation methods is introduced by Lankton and Tannenbaum (17), which overcoming the problems associated with global segmentation functional. The localized strategies can use the nucleus border to set the localized initialization and evolve the energy formulation within each cell structure. First, we consider the general localized region-based energy formulation (EL) proposed in:
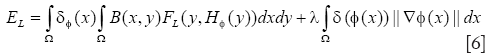
where B(x,y) is a mask function in which the local parameters that crave the evolution of the interface are estimated, and FL(y, H∅(y)) is the image criteria. The energy function FL is given by Eq. [2]. However, the localized parameters now is estimated in neighborhood B. the parameters u and v are replaced by localized value as
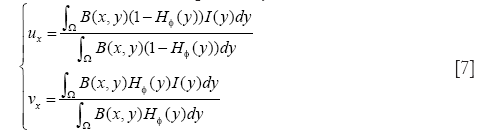
The original method use the radial mask around interface point x under evaluation. In this paper, we defined B to be the set of points belonging to one cell x and the distance to x is smaller than the average radius r which has been calculated by the segmentation result of RCM. The Mask function B(x,y) is defined as
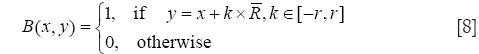
Where R is the vector at position x, and r is the radius of the local neighborhood.
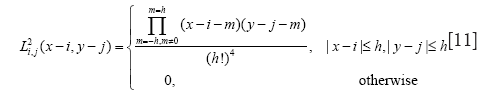
In this work, we used minimization of the energy formulation with Lagrange coefficient, L, indicated in the following expression:
with
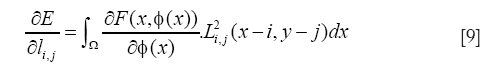
The level-set evolution may then be computed through a gradient descent on the Lagrange coefficients. The corresponding variation of the Lagrange coefficients is given as:

where ρ is the iteration step and ∇l corresponds to the gradient of the energy relative to the Lagrange coefficients given by Eq. [9].
Results and discussion
In order to evaluate the proposed algorithms, several experiments were carried out on the MPM and RCM images. As shown in Figure 1, the MPM and RCM images are obtained from the dorsal forearm of a 41-year-old Asian male volunteer using our in vivo video rate, integrated RCM/MPM imaging system where excitation wavelength λex=720 nm, field of view (FOV) =150×150 µm, resolution =256×256 pixels. The segmentation methods were coded using MATLAB 2012b and the data analysis was performed on a 2.66 GHz Core Duo laptop PC, with 3 GB RAM.
Segment RCM image
The first experiment was aimed at obtaining the cell borders from RCM image. The Gaussian filter is used to calculate gradient maps first where the radius parameter of Gaussian filter is adjusted according to the average size of cells, and the sigma parameter is half of the radius. Estimated from Figure 1A, the radius is set to 10 and the sigma is set to 5. And then, watershed transform is used to segment the cell borders. The only parameter connectivity of watershed transform is set to 8 by default. The results of RCM image segmentation is show in Figure 2A. It can be observed that the cell borders are very well segmented. If the radius parameter is changed to between 7 and 13, the results are similar except the exact locations of the boundary part because the image is fuzzy, so that the boundary cannot be exactly located even by human eyes. Figure 2B shows the Cell borders segmented from the RCM image overlayed onto the MPM image. Figure 2C shows the cell borders segmented from the RCM image overlayed onto the false color overlay of RCM/MPM image. The cell borders segmented from the RCM image also matched the position of cells in the MPM image with high accuracy.

Segment cell nucleus from MPM image
After obtained the cell borders, the regional center of each cell could be calculated. To segment cell nucleus from MPM image, the global region based energy level-set formulation can initialize the zero level-set at the center of each cell. This algorithm has one specific parameter that can be modified from the corresponding panel: the curvature term λ: it weights the influence of the regularization term of Eq. [5] (default value is set to 0.2). The evolution is only computed on the narrow-band of the level-set, and stops at the borders of cell nucleus. Φ is implemented as a signed distance function and is reinitialized at each iteration. Figure 3 shows the result of cell nucleus segmentation from the perspective of the entire graph of the MPM image. And the third column of Figure 4 shows some details of cell nucleus in each sub-image of individual cells.


Segment cytoplasm from MPM image
After obtained the nucleus of a cell, the cytoplasm region could be calculated. To segment cytoplasm from MPM image, after initialized the zero level-set at the location of each cell nucleus, the local region-based Lagrange Continuous level-set modeling is carried out. This algorithm has three specific parameters that can be modified from the corresponding panel: (I) the radius term r: it allows to x the radius size of the neighborhood, and it is set to be the same as the radius parameter of Gaussian filter 10; (II) the curvature term λ: it weights the influence of the regularization term of Eq. [5] (default value is set to 0.2). This algorithm is a locally region-based method for its feature term is computed locally and segments nonhomogeneous objects. Φ is implemented as a signed distance function and is reinitialized at each iteration. The second column of Figure 4 shows some details of cell cytoplasm in subimages of individual cells, segmented using the proposed method. The fourth and fifth columns of Figure 4 show some detail of cell cytoplasm in each subimage of individual cells segmented using two other well-known level-set models (14,15). This demonstrated that our method for cytoplasm segmentation gives better results than those other well-known level-set methods.
Conclusions
In this article, dedicated image segmentations for RCM/MPM imaging of human skin in vivo have been designed and implemented. The methodology incorporates different image segmentation methods to obtaining different cell features from different imaging modalities that are co-registered with each other. Firstly, a segmentation model built by watershed is introduced for obtaining the accurate structure of cell borders from the RCM image. Secondly, a global region based energy level-set model is constructed for extracting the nucleus of each cell from the MPM image. Thirdly, the local region-based Lagrange Continuous level-set approach is used for segmenting cytoplasm from the MPM image. Experimental results demonstrated that the cell borders from RCM image and the boundaries of cytoplasm and nucleus from MPM image can be obtained by our method with better accuracy and effectiveness. The quantitative analysis of MPM and RCM images of in vivo human skin based on this methodology can be used to study the variations of cellular parameters such as cell size, nucleus size and other mophormetric features with pathologies and improve clinical diagnosis.
Acknowledgements
This work was supported by the Canadian Institutes of Health Research (grant # MOP130548) and the Canadian Dermatology Foundation.
Disclosure: The authors declare no conflict of interest.
References
- Rajadhyaksha M, Grossman M, Esterowitz D, Webb RH, Anderson RR. In vivo confocal scanning laser microscopy of human skin: melanin provides strong contrast. J Invest Dermatol 1995;104:946-52. [PubMed]
- Tsai TH, Jee SH, Dong CY, Lin SJ. Multiphoton microscopy in dermatological imaging. J Dermatol Sci 2009;56:1-8. [PubMed]
- Zipfel WR, Williams RM, Christie R, Nikitin AY, Hyman BT, Webb WW. Live tissue intrinsic emission microscopy using multiphoton-excited native fluorescence and second harmonic generation. Proc Natl Acad Sci U S A 2003;100:7075-80. [PubMed]
- König K. Clinical multiphoton tomography. J Biophotonics 2008;1:13-23. [PubMed]
- Wang H, Lee AM, Frehlick Z, Lui H, McLean DI, Tang S, Zeng H. Perfectly registered multiphoton and reflectance confocal video rate imaging of in vivo human skin. J Biophotonics 2013;6:305-9. [PubMed]
- Moo EK, Abusara Z, Abu Osman NA, Pingguan-Murphy B, Herzog W. Dual photon excitation microscopy and image threshold segmentation in live cell imaging during compression testing. J Biomech 2013;46:2024-31. [PubMed]
- Hill PR, Canagarajah CN, Bull DR. Image segmentation using a texture gradient based watershed transform. IEEE Trans Image Process 2003;12:1618-33. [PubMed]
- Zhou X, Li F, Yan J, Wong ST. A novel cell segmentation method and cell phase identification using Markov model. IEEE Trans Inf Technol Biomed 2009;13:152-7. [PubMed]
- Yan J, Zhao B, Wang L, Zelenetz A, Schwartz LH. Marker-controlled watershed for lymphoma segmentation in sequential CT images. Med Phys 2006;33:2452-60. [PubMed]
- Oliveira S, Ribeiro JFF, Seok SC. A spectral clustering algorithm for manufacturing cell formation. Computers & Industrial Engineering 2009;57:1008-14.
- Zhang Z, Zhang P, Mao X, Zhang S. The Application of the Snake Model in Carcinoma Cell Image Segment. Communications in Computer and Information Science 2008;15:455-62.
- Cai H, Xu X, Lu J, Lichtman JW, Yung SP, Wong ST. Repulsive force based snake model to segment and track neuronal axons in 3D microscopy image stacks. Neuroimage 2006;32:1608-20. [PubMed]
- Maksimovic R, Stankovic S, Milovanovic D. Computed tomography image analyzer: 3D reconstruction and segmentation applying active contour models—‘snakes’. Int J Med Inform 2000;58-59:29-37. [PubMed]
- Li C, Kao CY, Gore JC, Ding Z. Minimization of region-scalable fitting energy for image segmentation. IEEE Trans Image Process 2008;17:1940-9. [PubMed]
- Bernard O, Friboulet D, Thévenaz P, Unser M. Variational B-spline level-set: a linear filtering approach for fast deformable model evolution. IEEE Trans Image Process 2009;18:1179-91. [PubMed]
- Liu T, Xu H, Jin W, Liu Z, Zhao Y, Tian W. Medical image segmentation based on a hybrid region-based active contour model. Comput Math Methods Med 2014;2014:890725.
- Lankton S, Tannenbaum A. Localizing region-based active contours. IEEE Trans Image Process 2008;17:2029-39. [PubMed]

