

Challenges in glucoCEST MR body imaging at 3 Tesla
Introduction
Chemical exchange saturation transfer (CEST) is a magnetic resonance imaging (MRI) method that enables detection of exchangeable proton groups in small concentration (1,2). The possibility to non-invasively assess glucose uptake through its exchangeable hydroxyl proton groups by CEST (glucoCEST) (3,4) or chemical exchange sensitive spin lock of glucose (glucoCESL) (5) has come up recently as one of the possibly most interesting CEST applications in cancer. The availability of an MRI-based method to detect glucose delivery, transport into the extravascular extracellular space (EES) or the cell (6) and increased metabolic activity following metabolic reprogramming (7) would open up a completely new field of application for this already very versatile tool.
Preliminary animal data demonstrated a pattern of glucoCEST signal increase using either native glucose (3,4) or the glucose analogues 2-deoxy-D-glucose (2DG) and 3-oxy-D-methyl-Glucose (3OMG) in both normal brain (8) and tumour models (9,10). In addition, recent publications showed the possibility of detecting other metabolites based on their hydroxyl groups, such as Glucosamine and N-Acetyl-Glucosamine (11). While all these studies have successfully detected signal changes following injection of sugars or glucose analogues, a common factor is that they have all been performed at high magnetic field strengths (e.g., >7 T). This detail is important as the detectable hydroxyl groups present on most hexoses have fast exchange rate (kex = ~1.5–15 kHz) with the surrounding water signal (12). Theoretically, such high exchange rates would negatively impact the potential for signal detection at lower field, due to the coalescence phenomenon (13). The CEST theory predicts that the labelling efficiency of exchangeable proton groups is only effective in low-to-intermediate exchange conditions, that is when kex ≤ Δω, with Δω (frequency difference) between the solute and solvent Larmor frequencies. In addition, the direct saturation at clinical field strength further reduces the detectability of hydroxyl groups due to their close proximity to the water peak (within a range of 1.2–3 ppm) (14).
Following early animal studies, several groups have demonstrated signal changes following the injection of native glucose in humans, either using glucoCEST (15,16) or glucoCESL (17-19) at 7 T, while only a few studies were reported at 3 T (20-24), and only a single one of which outside the brain (20). These studies used various methods for CEST acquisition and B0 shift correction as well as other potential confounding factors, such as variations in the applied RF field B1+. The signal responses to glucose injection were irregular, which is likely due to a combination of differences in injection protocol in addition to natural individual variations in the metabolic response of patients. Therefore, there is a need to further refine protocols of glucose injection, MRI acquisition and data post-processing to better understand the variability of the patient response for the glucoCEST method. Additionally, particular care is needed for the assessment of the response to avoid mistaking B0 field-related changes for glucose response. As the hydroxyl groups of interest resonate close to the water (1.2–3.0 ppm range), slight drifts in the magnetic field could lead to potential changes in a signal measured on the flanks of the direct saturation profile near the water peak in the Z-spectrum.
In this study, we set out to characterise the CEST signal in two types of body cancer with varying blood volume and expected metabolic rates at 3 T. A glucose-clamp was used following optimisation of a protocol based on the classic method by DeFronzo et al. (25) to separate perfusion effects from the CEST signal, primarily through simplification of the pharmacokinetic modelling (26). Our aim was to establish protocols for a hyperglycaemic clamp glucose infusion and glucoCEST MRI, based on theoretical simulations of the glucose signal at 3 T, including rapid assessment of B1+ and B0.
Methods
Simulations
A multi-pool model of Bloch-McConnell equations was used to estimate Z-spectra and a corresponding glucoCEST signal increase upon an elevated baseline glucose concentration from 5 millimolar (mM) to 15 mM at 3 T. A complete description of the model can be found in the previous report (26). In short, normally distributed raw (white) noise was introduced in the simulations so that the mean dynamic glucose enhancement (DGE) signal and its standard error of the mean (SEM) could be estimated for a range of parameter values relevant to tumour physiology as described earlier (27). All values used in the simulations (T1, T2 and M0b or size of the MT pool) were taken from Stanisz et al. (28). Based on the combination of parameter values which maximise DGE, glucoCEST sensitivity was defined for 3 T and 9.4 T field strengths. Dependency of T2, B1 saturation power and integration range on DGE signal were explored while pH was kept constant at pH =7.1. Using physiologically relevant parameters, the mean magnetization transfer ratio asymmetry (MTRasym) signal and the SEM were estimated for a range of saturation power, varying noise levels and different offset frequency.
Subjects
The study was approved by the local research ethics committee. Written informed consent was obtained from all subjects. Inclusion criteria were as follows: (I) no previous history of cancer for healthy volunteers, a confirmed or suspected diagnosis of selected cancer types (lymphoma and prostate cancer) for patient volunteers; (II) no known renal impairment or an estimated glomerular filtration rate (eGFR) within a standard reference value in case of unknown renal disease; (III) aged 18 or over with capacity to consent. Any patient with markedly impaired renal function (defined as eGFR <30 mL/min) or known diabetes mellitus (type 1 or type 2) was excluded from recruitment. For optimisation of glucose infusion using a hyperglycaemic clamp, nine healthy volunteers (median 49 years, range; 40–58 years, 2 male and 7 female) were recruited, of which one volunteer was withdrawn due to vasovagal syncope during insertion of an intravenous cannula. No MRI examination of healthy volunteers with glucose infusion was performed due to prohibition by the local ethics committee. For MRI examinations, 6 male patients (median 37 years; range, 27–53 years) with cancer were recruited while data from two patients were excluded due to significant motion artefact of glucoCEST images and a scanner software issue. The local ethics committee restricted further recruitment for patients due to lack of positive results from the initial subjects who underwent glucoCEST procedures. Demographic details of patients are listed in Table 1 as well as the average infusion rate, infusion volume and total amount of administered glucose. Both healthy volunteers and patients were fasted for at least 8 hours before the study.

Full table
Glucose infusion protocol
Hyperglycaemic clamp optimisation
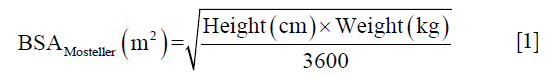
Eight healthy volunteers underwent multiple iterations of infusion experiments outside the scanner. For the first 5 healthy volunteers, subsequent glucose infusion rates were determined by a clinical team mainly based on preceding plasma glucose measurements. The 1st healthy volunteer infusion was carried out under the supervision of a board-certified endocrinologist and a diabetologist with 15 years of experience. Then an infusion protocol for intravenous glucose was optimised with 3 healthy volunteers using a hyperglycaemic clamp based on the consideration of the bi-phasic nature of insulin response, i.e., early burst of insulin followed by a gradual increase in insulin concentration over time (25). On arrival of a volunteer in the morning of the experiment, body surface area (BSA) was calculated from weight and height of the patients measured using the Mosteller formula (29) to estimate a priming dose,
The glucose infusion rates were then calculated using the hyperglycemic clamp glucose infusion rate formula below (25),
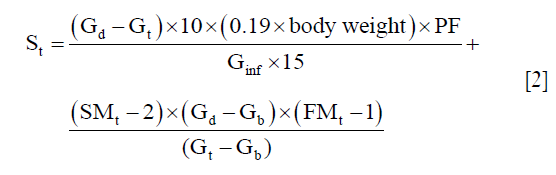
where St is the setting of the infusion pump at time t; Gt is glucose concentration at any time t; Gd and Gb are the desired glucose goal and the basal glucose concentrations respectively; Ginf is the glucose concentration in the infusate (glucose bag); SMt-2 is the metabolic component of the infusion rate calculated two iterations previously (i.e., 10 min prior); FMt is a dimensionless correction factor that compensates for error in plasma glucose concentration; (FMt-1) is the FMt calculated one iteration (5 min) previously; PF is the infusion pump factor that converts the infusion rate in mL/min to that portion of the final dial setting needed for the volume component on the pump (25). The glucose infusion rates were estimated using custom-written scripts in MATLAB (The MathWorks, Natick, MA, USA).
Glucose infusion procedures
A 20 G cannula was placed in the dorsum of the hand for blood sampling and a 3-way tap with extension was attached. A 1 L bag of heparinised 0.9% NaCl infusion was connected to the blood sampling cannula and allowed to infuse slowly to maintain the patency of the vein. A hand-warming unit was used to facilitate arterialization of the venous samples taken (30,31). Baseline blood samples were taken at time points −20, −10 and 0 min relative to the start of the infusion. An 18 G cannula was inserted into the antecubital fossa vein of the other arm and a 500 mL bag of 20% Dextrose infusion (Baxter Healthcare, Norfolk, UK) was connected via an MR compatible 3860 MRidiumTM MR infusion system (IRadimed corporation, Winter Springs, Florida, USA). At 0 min, after drawing the final baseline blood sample, the 20% dextrose infusion was commenced. Blood samples were drawn every 2 min for the first 10 min and then every 5 min, throughout for the assessment of plasma glucose, using a Hemocue glucometer (Hemocue AB, Angelholm, Sweden). The infusion rate of 20% glucose was adjusted in order to target plasma glucose concentration changes in +5 mmol/L steps up to a maximum of 20 mmol/L or no more than 10 mmol/L elevation of glucose relative to baseline whichever was sooner, during the period of infusion. The total infusion time ranged from 30 to 60 min. After the infusion was completed, blood glucose was checked again after 15 min and at regular 15 min intervals until the post-infusion blood glucose was between 4–6 mmol/L, following which the participants were then offered a light meal. Patients were followed up via telephone call 24 hours later for any glycaemic symptoms and were asked to report to a local emergency department in case of feeling unwell.
Data acquisition
All MR measurements were performed on a 3 T clinical MR scanner (Achieva, Philips Healthcare, Best, The Netherlands) using coils appropriate to the anatomy (Table 2). The MR sequence for glucoCEST MRI consisted of a train of 18 sinc-gauss pulses followed by a conventional MRI readout. The parameters of the sinc-gauss pulses were: flip angle =1,200 degrees, pulse duration =40 ms and inter-pulse delay =0.1 ms (equivalent power to 2.5 µT continuous wave B1 pulse). In order to be able to correct static B0 inhomogeneities and drifts during the experiment, glucoCEST data were sampled at six pairs of positive and negative offset frequencies (±1.72, ±2.03, ±2.34, ±2.65, ±2.97 and ±3.28 ppm) in an interleaved manner (Figure 1). In addition, 2 reference scans (non-saturated) were obtained giving a total of 62 dynamics per CEST-block acquisition. Images for each offset (dynamics) were acquired with a temporal resolution of 3 s. For readout, multi-slices were acquired using a single-shot turbo spin echo (TSE) with the parameters listed in Table 2. A SENSE acceleration factor 2 was used. Refocusing control was set to 120° and spectral presaturation with inversion recovery (SPIR) fat suppression was applied. A block pulse of 5 ms duration and flip-angle of 284° (effective B1 =3.7 µT) was used to obtain B1+ and B0 maps by means of the water shift and B1 (WASABI) approach (19). Data was acquired at 20 saturation frequency offsets, evenly spaced between ±3 ppm. The readout parameters and geometry were the same as for the CEST scan. The duration of each WASABI scan was 52 s. Additionally, a stack of high-resolution T2-weighted images were acquired using a multi-shot TSE readout (TSE factor =23, TE =100 ms, TR =2,500 ms) with the same geometry as CEST acquisition.

Full table

Data analysis
Data processing was performed using custom-written scripts in MATLAB (The MathWorks, Natick, MA, USA). B0 field-maps extracted from the multiple WASABI acquisitions (19) were linearly interpolated over the course of time and the corresponding B0 map (at each time point and slice) was used to correct the glucoCEST data for static field inhomogeneities. The magnitude of the CEST effect was quantified as MTRasym:
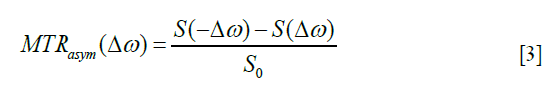
where  is the shift difference between the irradiation frequency and the water frequency. S and S0 are the saturated and non-saturated intensities, respectively. Note that S0 was measured by averaging all the reference scans. The B0 inhomogeneity-corrected MTRasym values were then integrated in the range of 2–3 ppm while the maximum available range (within 2–3 ppm) was used for datasets with large B0 inhomogeneities.
For DGE data, the first 2–3 images were discarded to ensure steady state. The MTRasym value of baseline images was generated by averaging all of the remaining pre-injection images. Glucose dynamic difference images were generated by taking the difference of MTRasym values between each dynamic (t) of post-injection scans and a pre-injection scan. The DGE area-under-curve (AUC) was calculated using:
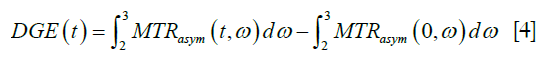
where the integration limits [2,3] are given in ppm. A temporal moving average method of 10 MTRasym measurements was used to increase the temporal SNR.
Results
Optimisation of glucoCEST MRI protocol
Hyperglycaemic clamp
The time taken to reach the target plasma glucose became considerably shorter (12 min) following implementation of the glucose infusion rate formula described in Eq. [2] as compared to the time taken by manual adjustment (38 min) (Figure S1). It is also observed that that manual determination of glucose infusion rates by the clinical team was rather subjective resulting in unstable blood glucose level (Figure S1A) whereas the plasma glucose levels by the DeFronzo method remained stable during infusion (Figure S1B). The infusion rates were reproducible among 3 healthy volunteers who underwent glucose infusion with the DeFronzo method (data omitted). The target plasma glucose defined in the healthy volunteer experiments was found to be safe and potentially feasible for clinical translation. The infusion was well tolerated and there were no adverse events reported in all volunteers except one healthy volunteer who experienced superficial thrombophlebitis in the arm following glucose infusion.

Simulations
A large number of simulations was done to optimise the pulse sequences to be used at 3 T. For illustration, Figure 2 shows a potential optimum combination of offset frequencies and corresponding B1 saturation power for a range of T2 values, which produces the maximum sensitivity of glucoCEST at 3 T using a simple continuous wave excitation at steady-state. The CEST sensitivity map at 3 T indicates that, for instance, a B1 saturation power of 2.7 µT for a tumour tissue with T2 of 160 ms can be used in combination with an offset frequency of ~2.5 ppm in order to achieve optimal signal sensitivity. It also estimates that contrast-to-noise ratio (CNR) of around 1,500:1 is required to detect an increase of 10 mM glucose in the tissue (with 95% CI). The estimated results match well with the experimental data performed on phantoms which show that maximum MTRasym signal was obtained at around 2.5 ppm for B1 power of 2.3 µT (T2 95±7 ms and pH 7.1±0.1 for samples) as described in details previously (26).

Patient experiments
A total of six patients participated in the study, two of which needed to be discarded due to technical issues with the image acquisition. The results from the remaining 4 patients are described here. The average infusion rate for the first 12 min (during which a steady state plasma glucose level was achieved) ranged between 6.2 and 12.1 mL/min while the total volume infused ranged between 74.3 and 144.8 mL during the same period. The total glucose administered in the first 12 min were between 14.9 to 28.9 g for the patient experiments.
Patients with lymphomas: highly metabolic cancers and low blood volume
For three patients with histologically confirmed lymphoma (29±2 years), the glucose average infusion rate ranged between 9.2 and 12.1 mL/min while the total infusion volume over the first 12 min was between 110.8 and 144.8 mL as shown in Table 1. The tumours in the cervical regions were visible on T2w images at baseline (Figure S2A,B,C). The blood glucose level of all patients increased by 10 mmol/L on average and were kept stable during the duration of glucose administration (Figure 3). Patient 1 reached target plasma glucose within 8 min of starting of infusion. This was sustained (though with a dip at 20 min time point) until 42 min time point before the glucose level fell below the target level. In patient 2, the blood glucose level reached target plasma glucose within 12 min of starting of infusion. This was sustained until 40 min time point before the glucose level fell below the target level. Patient 3 reached target plasma glucose within 12 min of starting of infusion and was sustained until 30 min time point. Across three patients with lymphoma, there was no DGE signal increase neither in tumour nor contralateral regions (Figure 3).


Patient with prostate cancer: low cancer metabolism and large blood volume
Patient 4 had a histologically confirmed large prostatic tumour extending across the whole of the prostate and visible on baseline T2w imaging (Figure S2D). The glucose infusion rate and volume over the first 12 min of infusion which were 6.2 mL/min and 74.3 mL. As shown in Figure 3G, target glucose (≥10 mmol/L) was reached within 6 min of commencement of infusion and this was held stable for another 30 min. As similar to patients with lymphoma, no DGE signal increase was seen neither in tumour nor contralateral regions (Figure 3H) of a patient with prostate cancer.
B0 field variations and drift
Significant B0 field variations, up to 2 ppm across the slice for the prostate cancer, and drift over time was observed during all glucoCEST experiments, both in the neck and prostate areas. When using the uncorrected MTRasym integrated over the largest possible range between 2–3 ppm in a patient with prostate cancer as a representative case (Figure 4A), an apparent difference between tumour and contralateral regions become apparent. After B0 correction, this apparent change in MTRasym disappeared leading to no signal enhancement (Figure 4B) and difference in MTRasym between tumour and contralateral regions became negligible. It is worthwhile to notice that the changes due to B0 drift are much larger in the body (i.e., torso area) as compared to the brain, due to the increased drift observed. The B0 drifts across slice and entire scan duration were found to be 25 Hz (0.2 ppm) and 200 Hz (1.56 ppm), respectively (data omitted). It is also observed that field drift causes the tumour signal to increase more than the normal tissue in all patients. This is primarily related to the longer T2 values present in the tumour, leading to a sharper direct saturation effect, and therefore a larger impact upon MTRasym with respect to the normal tissue for the same drift.

Discussion
In this work, we aimed to translate DGE MRI based on the GlucoCEST signal to a clinical field strength. Measurement of glucoCEST signal relies on inherently low signal changes, especially at 3 T. While our simulations based on a change in glucose concentration of 10 mM (data omitted) show a potential signal increase of 2–2.5% in optimal conditions at high field strength (continuous wave (CW) excitation, steady-state, 9.4 T), in practice it is unlikely that the change in glucose would be that high within any given voxels with the exception of those containing pure blood. In addition, the clinical situation would lead to much lower signal changes, due to lower field strengths and the impossibility to use a CW excitation at high power over a long enough time without leading to large SAR issues. Moreover, smaller absolute differences between the resonant frequencies of water and labile protons at clinical field strengths give rise to considerably larger water direct saturation and spill over effects when compared to those observed at higher preclinical field strengths. Intense spill over effects widen the Lorentzian absorption profile thereby reducing the observable signal due to direct saturation, and thereby resulting in lower SNR close to water. Therefore, optimisation of the glucoCEST protocols is crucial for the successful detection of DGE signal at 3 T. First, we optimised an infusion protocol for intravenous glucose using a hyperglycaemic clamp to maximise the exchange-sensitive MRI signal. The use of a glucose-clamp (rather than an infusion of a bolus) based on the classic method by DeFronzo et al. (25) would in principle allow to detect differences in perfusion and metabolism by simplifying the pharmacokinetic analysis (26). In this study, the optimised hyperglycaemic clamp infusion with the DeFronzo method demonstrated higher efficiency and stability of glucose delivery in healthy volunteers as compared to that by the manual determination of glucose infusion rates. Subsequently, we performed the numerical simulations in consideration of physiological condition in order to define the optimum parameters for glucoCEST measurement. Our simulated results show that the DGE signal sensitivity is dependent on T2, B1 saturation power and integration range, and therefore pre-saturation parameters for offset frequencies need to be optimised accordingly. Here we optimised glucoCEST imaging protocols for B1 and integration range of offset frequencies which then were utilized in the data acquisition and post-processing. Note that while our protocol differs slightly from that of Zaiss et al. (12) both protocols share similar recommendations. In particular, both protocols recommend the use of relatively short and intense saturation pulses to achieve a maximum contrast in DGE scans without the need to reach steady-state.
One of the main reasons for the difference in recommendations comes from the fact that the aforementioned paper bases its recommendation on the largest CEST signal from the positive frequency offset, while we performed all our simulations using the MTRasym method. Indeed, when using glucoCEST, it is generally particularly difficult to separate the various contributions, due, e.g., to T2 effects, related or not to the infusion of glucose, or B0 drifts, among others. For this reason, we used here MTRasym, leading, as per Zaiss et al. (12), to a lower detectable signal, however free from secondary and / or unrelated effects.
A few studies on DGE CEST imaging reported motion as a significant contributor to observed signal changes (15,17). Zaiss et al. demonstrated that up to 2% glucoCEST signal can be generated by motion in human brain tumour while the signal dropped to 0.4% after combined motion and B0 correction (32). Their results suggest that any observed CEST effect below 2% without motion correction needs to be verified as it may be artefactual. Previous studies reported that limitations on the motion correction approach due to 2D based data acquisition resulted in erroneous signal (15,17). In the present study, motion corrections were not performed due to lack of a co-registration algorithm for MRI data in body areas beyond the brain. Although development of such algorithms is particularly challenging in body areas, it is essential to explore this field for computing more accurate glucoCEST signal for any types of body cancers beyond the brain.
While motion has been reported as one of the most prominent influence, B0 inhomogeneity can still markedly alter the signal. Our results from body beyond the brain demonstrate that erroneous glucoCEST signal up to 28% can be rectified by B0 correction as observed in all our data while the previous study reported that B0 inhomogeneity affects the signal by 0.5% in the brain (32). This effect could be reproduced in all DGE studies, but may be easily overlooked. Earlier studies demonstrated glucoCEST imaging with a glucose bolus up to a few min using a single frequency offset approach (15) or a whole Z-spectrum based asymmetry method (20) to measure CEST-based signal changes. While a single frequency offset approach can significantly reduce a scan time thereby providing clinical relevance, no correction of motion induced B0 field drift can be performed, which may result in spurious signal. On the other hand, the whole Z-spectrum method, which has been widely used due to possibility of B0 inhomogeneity correction, is unsuitable for DGE imaging due to the time constraints encountered in clinical practice. It is therefore essential to identify a range of offset frequencies, which are most sensitive for the detection of glucose. Sampling a small portion of the offset frequencies instead of the whole Z-spectrum allows more time to repeat acquisitions, therefore increasing the detection power through improved temporal SNR. The simulated results show that an integration range of 2–3 ppm of MTRasym analysis seems to be the optimum to maximise the signal for the pulse sequence and B1 used in the present study and this optimum range is in line with the previous reports (22-24). In spite of this optimisation, no detectable signal could be observed however.
One particular issue encountered here was the large B0 shift [up to 25 Hz (0.2 ppm) and 200 Hz (1.56 ppm) across slice and during entire scan, respectively] assessed in nearly every patient scanned. Once again, the range of B0 drift is much larger in the body as compared to the brain. While large B0 drifts can often be attributed to subject motion (e.g., swallowing in the neck and movement of the torso organs), another possibility is that the relatively low temperature of the MRI scanner in the morning might have caused such a drift, due to the slow heating of the shims during the experiment. All MRI appointments were scheduled early in the morning to avoid prolonged fasting periods (more than 8 hours). As this was intended to reduce the risk of hypoglycaemia and to minimise discomfort, alternative ways to correct for B0 drift might be implemented, such as pre-heating of the gradients and shims (e.g., using a strong diffusion-weighted sequence) during patient preparation outside the scanner room for example. It is also possible to pre-run the scanner to reduce heating of the passive shims during the experiment for future studies.
Compared to the surrounding tissues, most tumours (prostate cancer being an exception) have substantially longer T2 relaxation times. As the Z-spectrum becomes narrower at long T2, accurate field correction becomes even more critical—i.e., the same amount of B0 field inhomogeneity (e.g., 10 Hz) can lead to larger apparent variation of the MTRasym signal in tumour than the in the surrounding tissues, if drifts are not properly corrected (Figure 4A). On the other hand, such prolonged T2 values will lead to a clearer separation of the DGE signal from the water, and generally to a higher intrinsic SNR. These particular counter-balancing effects have not been addressed in most of the literatures, and further experiments are warranted to separate the exchange-mediated effects from the T2 effects in such tissues, as a more detectable signal increase might indeed be the result of a primary change in underlying relaxation effects, rather than a specific increase in glucose signal.
Given the geometry of head and neck in patients with lymphoma, there may be substantial B0 field variations and motion due to frequent swallowing. B0 inhomogeneity leads to a shift in the Z-spectra and affects the magnitude of glucoCEST and the corresponding DGE signal over time (Figure 4). This suggests that the significant glucoCEST enhancement around 5% reported earlier at 3 T (20) might be due to the presence of B0 field inhomogeneity in the human head and neck area. In the present study, after B0 corrections, calculated DGE values based on MTRasym analysis were negligible in patients with lymphoma and prostate cancer at 3 T (Figure 3). Negative results from those cancer patients are in line with results from the preclinical 3 T study (Longo D, 2019, unpublished data) which describe that the CEST contrast following natural glucose administration is dependent on several conditions such as the amount of the injected dose, the administration route and the magnetic field strength, with a disadvantage at clinical field strength (3 T). In particular, they demonstrate that the measured contrast in the tumour region of animal models imaged at 3 T was lower than an arbitrary threshold limit of 1%, independent of glucose administration route and injected dose. A likely explanation for the results of both studies is linked to the smaller chemical shift difference between hydroxyl protons and bulk water signal at 3 T (ca. 125 Hz) that results in higher direct saturation effects and reduced selectivity. As a consequence, CEST signal is less visible and limits in vivo detection of natural glucose. In addition, as mentioned earlier, chemical exchange of hydroxyl protons belongs to the intermediate-fast exchange regime resulting to increased coalescence at lower field strength.
A recent glucoCESL study in human brain cancer (e.g., glioma) by Herz et al. (21) demonstrated that the DGE effect after B0 correction is only 0.4% at 3 T while the signal of approximately 2–6% was observed in the lateral tumour rim after glucose infusion at 7 T (15). Given its magnitude, glucoCEST at high fields such as 7 T holds better promise as a clinically viable technique. However, it is still not clear whether any of the signal could relate directly to glucose metabolism, or be indirectly mediated a physiological response to the sudden glucose surplus such e.g., a drop in pH or reduced water volume that would make the glucoCEST signal more detectable. Other methods such as Biosensor Imaging of Redundant Deviation in Shifts (BIRDS) (33), ratiometric analysis using iopamidol (34) or AcidoCEST (35) can be potentially used to measure pH in the brain and might show changes of pH in tumours or surrounding regions. However, those methods need to be further validated for the use in human subjects.
Conclusions
Our results indicate that B0 field inhomogeneity alterations may be a substantial contributor for false-positive glucoCEST signal observed before B0 correction in patients with cancer at clinical field strengths. In particular, we could not detect any reproducible DGE-based glucoCEST MRI signal in any body cancer. The use of native glucose as a contrast agent in MRI, while attractive, might not be ready for prime time at clinical field strength just yet. In particular, effects of motion, susceptibility to B0 and B1+ alterations in vivo, as well as individual reaction to glucose injection might all contribute to the wide range of results published so far, as well as the less than ideal results of the present study. Further work is therefore required prior to making it a viable clinical alternative for assessment of cancer perfusion and/or metabolism.
Acknowledgments
Funding: This work was supported by funding from the European Union’s Horizon 2020 research and innovation programme under the Grant Agreement (No. 667510) and the National Institute for Health Research (NIHR) University College London Hospitals Biomedical Research Centre (UCLH BRC). F Torrealdea was supported by UCL Grand Challenge scholarship.
Footnote
Conflicts of Interest: The authors have no conflicts of interest to declare.
Ethical Statement: The study was approved by the local research ethics committee. Written informed consent was obtained from all subjects.
References
- Ward KM, Balaban RS. Determination of pH using water protons and chemical exchange dependent saturation transfer (CEST). Magn Reson Med 2000;44:799-802. [Crossref] [PubMed]
- Ward KM, Aletras AH, Balaban RS. A new class of contrast agents for MRI based on proton chemical exchange dependent saturation transfer (CEST). J Magn Reson 2000;143:79-87. [Crossref] [PubMed]
- Chan KW, McMahon MT, Kato Y, Liu G, Bulte JW, Bhujwalla ZM, Artemov D, van Zijl PC. Natural D-glucose as a biodegradable MRI contrast agent for detecting cancer. Magn Reson Med 2012;68:1764-73. [Crossref] [PubMed]
- Walker-Samuel S, Ramasawmy R, Torrealdea F, Rega M, Rajkumar V, Johnson SP, Richardson S, Goncalves M, Parkes HG, Arstad E, Thomas DL, Pedley RB, Lythgoe MF, Golay X. In vivo imaging of glucose uptake and metabolism in tumors. Nat Med 2013;19:1067-72. [Crossref] [PubMed]
- Jin T, Mehrens H, Hendrich KS, Kim SG. Mapping brain glucose uptake with chemical exchange-sensitive spin-lock magnetic resonance imaging. J Cereb Blood Flow Metab 2014;34:1402-10. [Crossref] [PubMed]
- Xu X, Chan KW, Knutsson L, Artemov D, Xu J, Liu G, Kato Y, Lal B, Laterra J, McMahon MT, van Zijl PC. Dynamic glucose enhanced (DGE) MRI for combined imaging of blood-brain barrier break down and increased blood volume in brain cancer. Magn Reson Med 2015;74:1556-63. [Crossref] [PubMed]
- Ward PS, Thompson CB. Metabolic reprogramming: a cancer hallmark even warburg did not anticipate. Cancer Cell 2012;21:297-308. [Crossref] [PubMed]
- Nasrallah FA, Pages G, Kuchel PW, Golay X, Chuang KH. Imaging brain deoxyglucose uptake and metabolism by glucoCEST MRI. J Cereb Blood Flow Metab 2013;33:1270-8. [Crossref] [PubMed]
- Rivlin M, Tsarfaty I, Navon G. Functional molecular imaging of tumors by chemical exchange saturation transfer MRI of 3-O-Methyl-D-glucose. Magn Reson Med 2014;72:1375-80. [Crossref] [PubMed]
- Rivlin M, Horev J, Tsarfaty I, Navon G. Molecular imaging of tumors and metastases using chemical exchange saturation transfer (CEST) MRI. Sci Rep 2013;3:3045. [Crossref] [PubMed]
- Rivlin M, Navon G. Glucosamine and N-acetyl glucosamine as new CEST MRI agents for molecular imaging of tumors. Sci Rep 2016;6:32648. [Crossref] [PubMed]
- Zaiss M, Anemone A, Goerke S, Longo D, Herz K, Pohmann R, Aime S, Rivlin M, Navon G, Golay X, Scheffler K. Quantification of hydroxyl exchange of D-Glucose at physiological conditions for optimization of glucoCEST MRI at 3 T, 7T and 9.4 T. NMR Biomed. 2019;32:e4113. [PubMed]
- van Zijl PCM, Lam WW, Xu J, Knutsson L, Stanisz GJ. Magnetization Transfer Contrast and Chemical Exchange Saturation Transfer MRI. Features and analysis of the field-dependent saturation spectrum. Neuroimage 2018;168:222-41. [Crossref] [PubMed]
- Kim M, Zaiss M, Thust S, Golay X. Quantitative Chemical Exchange Saturation Transfer. In: Cercignani M, Dowell NG, Tofts PS (editors). Quantitative MRI of the Brain: Principles of Physical Measurement, Second edition. Boca Raton: CRC Press, 2018:185-202.
- Xu X, Yadav NN, Knutsson L, Hua J, Kalyani R, Hall E, Laterra J, Blakeley J, Strowd R, Pomper M, Barker P, Chan K, Liu G, McMahon MT, Stevens RD, van Zijl PC. Dynamic Glucose-Enhanced (DGE) MRI: Translation to Human Scanning and First Results in Glioma Patients. Tomography 2015;1:105-14. [Crossref] [PubMed]
- Knutsson L, Seidemo A, Rydhog Scherman A, Markenroth Bloch K, Kalyani RR, Andersen M, Sundgren PC, Wirestam R, Helms G, van Zijl PCM, Xu X. Arterial Input Functions and Tissue Response Curves in Dynamic Glucose-Enhanced (DGE) Imaging: Comparison Between glucoCEST and Blood Glucose Sampling in Humans. Tomography 2018;4:164-71. [Crossref] [PubMed]
- Schuenke P, Paech D, Koehler C, Windschuh J, Bachert P, Ladd ME, Schlemmer HP, Radbruch A, Zaiss M. Fast and Quantitative T1rho-weighted Dynamic Glucose Enhanced MRI. Sci Rep 2017;7:42093. [Crossref] [PubMed]
- Paech D, Schuenke P, Koehler C, Windschuh J, Mundiyanapurath S, Bickelhaupt S, Bonekamp D, Baumer P, Bachert P, Ladd ME, Bendszus M, Wick W, Unterberg A, Schlemmer HP, Zaiss M, Radbruch A. T1rho-weighted Dynamic Glucose-enhanced MR Imaging in the Human Brain. Radiology 2017;285:914-22. [Crossref] [PubMed]
- Schuenke P, Windschuh J, Roeloffs V, Ladd ME, Bachert P, Zaiss M. Simultaneous mapping of water shift and B1 (WASABI)-Application to field-Inhomogeneity correction of CEST MRI data. Magn Reson Med 2017;77:571-80. [Crossref] [PubMed]
- Wang J, Weygand J, Hwang KP, Mohamed AS, Ding Y, Fuller CD, Lai SY, Frank SJ, Zhou J. Magnetic Resonance Imaging of Glucose Uptake and Metabolism in Patients with Head and Neck Cancer. Sci Rep 2016;6:30618. [Crossref] [PubMed]
- Herz K, Lindig T, Deshmane A, Schittenhelm J, Skardelly M, Bender B, Ernemann U, Scheffler K, Zaiss M. T1ρ-based dynamic glucose-enhanced (DGEρ) MRI at 3 T: Method development and early clinical experience in the human brain. Magn Reson Med. 2019;82:1832-47. [Crossref] [PubMed]
- Xu X, Sehgal AA, Yadav NN, Knutsson L, Laterra J, Pomper M, Rosenthal H, Zijl PCMv, editors. Dynamic Glucose Enhanced Imaging at 3 T: First Human Data. Honolulu, Hawai'i, USA: Proceedings of the International Society of Magnetic Resonance in Medicine, 2017.
- Xu X, Bhargava P, Knutsson L, Pomper M, Calabresi P, Zijl PCMv, editors. Imaging Blood Brain Barrier Disruption in Multiple Sclerosis using GlucoCEST MRI. Paris, France: Proceedings of the International Society of Magnetic Resonance in Medicine 2018.
- Xu X, Seidemo A, Sehgal AA, Knutsson L, Yadav NN, Zaiss M, Zijl PCMv, editors. Dynamic Glucose Enhanced Imaging at 3 T: Effects of physiological changes and motion. Montreal, Cananda: Proceedings of the International Society of Magnetic Resonance in Medicine 2019.
- DeFronzo RA, Tobin JD, Andres R. Glucose clamp technique: a method for quantifying insulin secretion and resistance. Am J Physiol 1979;237:E214-23. [PubMed]
- Torrealdea F. Investigation of brain tumour metabolism using naturally occurring chemical exchange saturation transfer agents with magnetic resonance imaging: University College London, 2015.
- Torrealdea F, Rega M, Evans V, Punwani S, Atkinson D, Golay X, editors. Optimisation of glucoCEST MRI signal for applications in tumours. Edinburgh, UK: ESMRMB, 2015.
- Stanisz GJ, Odrobina EE, Pun J, Escaravage M, Graham SJ, Bronskill MJ, Henkelman RM. T1, T2 relaxation and magnetization transfer in tissue at 3 T. Magn Reson Med 2005;54:507-12. [Crossref] [PubMed]
- Mosteller RD. Simplified calculation of body-surface area. N Engl J Med 1987;317:1098. [Crossref] [PubMed]
- Zello GA, Smith JM, Pencharz PB, Ball RO. Development of a heating device for sampling arterialized venous blood from a hand vein. Ann Clin Biochem 1990;27:366-72. [Crossref] [PubMed]
- Elahi D. In praise of the hyperglycemic clamp. A method for assessment of beta-cell sensitivity and insulin resistance. Diabetes Care 1996;19:278-86. [Crossref] [PubMed]
- Zaiss M, Herz K, Deshmane A, Kim M, Golay X, Lindig T, Bender B, Ernemann U, Scheffler K. Possible artifacts in dynamic CEST MRI due to motion and field alterations. J Magn Reson 2019;298:16-22. [Crossref] [PubMed]
- Coman D, Trubel HK, Rycyna RE, Hyder F. Brain temperature and pH measured by (1)H chemical shift imaging of a thulium agent. NMR Biomed 2009;22:229-39. [Crossref] [PubMed]
- Longo DL, Dastru W, Digilio G, Keupp J, Langereis S, Lanzardo S, Prestigio S, Steinbach O, Terreno E, Uggeri F, Aime S. Iopamidol as a responsive MRI-chemical exchange saturation transfer contrast agent for pH mapping of kidneys: In vivo studies in mice at 7 T. Magn Reson Med 2011;65:202-11. [Crossref] [PubMed]
- Chen LQ, Howison CM, Jeffery JJ, Robey IF, Kuo PH, Pagel MD. Evaluations of extracellular pH within in vivo tumors using acidoCEST MRI. Magn Reson Med 2014;72:1408-17. [Crossref] [PubMed]

