

Voxel-wise Optimization of Pseudo Voigt Profile (VOPVP) for Z-spectra fitting in chemical exchange saturation transfer (CEST) MRI
Introduction
Chemical exchange saturation transfer (CEST) is a magnetic resonance imaging (MRI) technique for detecting low-concentration metabolites and molecules with exchangeable protons at specific resonance frequencies, which can be labeled by a saturation pulse allowing signal transfer to water pool for detection (1-3). CEST MRI (1,4) has been applied to detect exogenous or endogenous amine (5), amide (6), creatine (7), glucose (8,9), glutamate (10), glycogen (11) and glycosaminoglycan (12). Additionally, CEST technique can probe the micro-environment of tissue, including temperature (13) and pH (14,15). These unique capabilities of CEST MRI make it a promising target for in vivo imaging applications such as the diagnosis of stroke (16-20) as well as detection and grading of tumors (9,21-31).
CEST MRI often involves a series of images with saturation pulse sweeping over a range of frequency offsets, with the signal changes along the extracted offset, also termed as Z-spectra (32). The most commonly used CEST quantification method, namely, MT ratio asymmetry (MTRasym) analysis (33), takes the difference between two CEST images at opposite frequency offsets (+/−∆ω) as
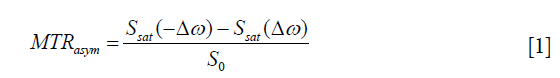
where Ssat(−∆ω) and Ssat(∆ω) are signals with saturated RF irradiation, which applied at the reference frequency and labeled proton frequency; S0 is the reference signal without RF irradiation. MTRasym is simple and easy to be calculated, which has been shown to correlate with tumor grade in case of amide proton transfer (APT) (34-36). However, MTRasym is susceptible to several types of contamination, including B0 inhomogeneity (37), direct saturation (DS) and semisolid macromolecular magnetization transfer (MT). Moreover, it is incapable to separate nuclear overhauser effect (NOE) at resonance frequencies up field of water based on CEST contrast.
To further improve CEST specificity and its signal quantification, Z-spectra fitting has been employed to distinguish the contributions from multiple origins (38). Theoretically, the enhancement of CEST through Z-spectra is dependent on the pool size, exchange rate and relaxation time (25,34), as demonstrated by Bloch-McConnell equations. However, the complex Bloch fitting strongly relies on the initialization and boundaries of fitting parameters (39). According to the shape of Z-spectra, other quantification methods have been proposed, including multiple-pool Lorentzian fitting (7,24,38-40) and Lorentzian difference (LD) analysis (18,40-42). Multiple-pool Lorentzian fits each ‘dip’ in Z-spectra using a Lorentzian shape, in which the reference signals can be obtained by setting the fitted amplitude of the target CEST or NOE pools to zero. However, multiple-pool Lorentzian fitting requires the Z-spectra to be collected at a sufficient sampling frequency, and thus such method is time consuming. In addition, it has different fitting parameters, and is sensitive to the signal-to-noise ratio of Z-spectra. Besides, the LD method is a simplified method that employs a single Lorentzian line as a reference to describe the DS and takes account of difference against experimental data for quantifying CEST and NOE signal. LD can be an easy and robust quantification method, especially at low B1_sat (≤1 µT at 9.4 Tesla) (40), which has been initially validated in patients with stroke (18,40-42). However, LD analysis possesses the disadvantage of overestimating contributions from CEST and NOE effects (40). In particular, for fast-exchanging species that require higher B1_sat, or for tissue with a strong MT contrast, the Z-spectra exhibit non-Lorentzian line-shape (40) making the results of LD analysis invalid. More importantly, the Z-spectrum appears more like a Gaussian line-shape, rather than a Lorentzian line-shape, when B1_sat is higher or in the presence of strong MT contrast (20,43).
During NMR spectroscopy analysis, Voigt spectra line profile is often defined by the convolution of Lorentzian and Gaussian terms (44-46). As an excellent approximation to Voigt profile, Pseudo Voigt profile is best defined as the weighted sum of Gaussian and Lorentzian (47). In this study, a Voxel-wise Optimization Pseudo Voigt Profile (VOPVP) fitting algorithm was developed to improve the reliability of in vivo CEST MRI quantification. To further compensate for the different levels of MT and DS, a B1_sat-dependent optimization was adopted into the VOPVP fitting based on the 5-pool Bloch simulations under different B1_sat. To evaluate the performance of VOPVP fitting, an extensive Bloch-simulations was performed using previously published parameters (i.e., 5-pool model and 6-pool model with greater MT contributions) at various B1_sat. The conventional LD and an analytical standard were also assessed and compared. Finally, an initial validation for in vivo application was carried out using a brain tumor-bearing mouse.
Methods
Theoretical concepts
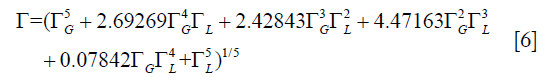
The detailed flow of our VOPVP method is illustrated in Figure 1. The proposed fitted function, or termed as Pseudo Voigt profile (47), was expressed by a weighted sum of Gaussian (G) and Lorentzian (L):


where α and 1–α denote the proportionality coefficients of Lorentzian and Gaussian functions, respectively. The model function of Gaussian fitting can be described by
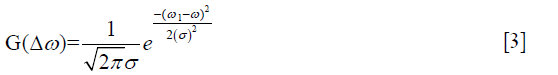
where ω1 is the frequency offset from the water resonance, while ω is the frequency offset of the CEST peak for the proton pool.
The model function of Lorentzian fitting can be given by
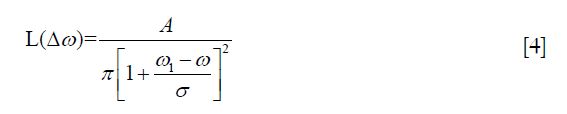
where ω1 is the frequency offset from the water resonance, whereas A, ω and σ are the amplitude, frequency offset and linewidth of the CEST peak for the proton pool, respectively.
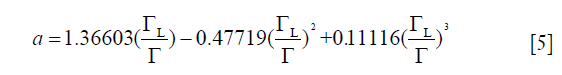
Thompson et al. (45) have proposed the following expression for the pseudo-Voigt approximation for the convolution of both Gaussian and Lorentzian functions, as presented by the full width at half maximum (FWHM) values of Gaussian and Lorentzian:
where
where  and
and  are the FWHM of Gaussian and Lorentzian, respectively.
VOPVP fitting
Figure 1 shows the flow chart of the proposed VOPVP fitting algorithm. Firstly, for the raw Z-spectra data, WASSR was performed to correct B0 inhomogeneity. The obtained Z-spectra is labeled as Z_exp. Gaussian and Lorentzian model pre-fitting was performed for Z_exp in order to achieve the Lorentzian proportionality coefficient (a), based on the FWHM of Gaussian and Lorentzian derived from Eqs. [5] and [6], respectively. Subsequently, the area values of Z_loren under Z_exp between 4 and 6 ppm and between −4 and −6 ppm are named as L_pos and L_neg, respectively.
To further compensate for the line-shape changes under different B1_sat’s, a B1-dependent adjustment was applied to the experimental Z-spectra (Z_exp) according to the prior knowledge learned from 5-pool Bloch equation-based simulations at a range of B1_sat’s. Simulated Z-spectra (Z5-pool) of brain tissue with B0 =9.4 T were obtained through 5-pool Bloch equation-based simulations (48), for a range of B1_sat (0.5, 1, 1.5, 2, 2.5 and 3 µT). Accurate reference spectra describing DS and MT were determined using a 2-pool model (water and semisolid), with the residual with Z5-pool for CEST quantification. The Lorentzian fitting was also performed. The residual areas with regarding to Z5-pool, were calculated for Lorentzian fitting [u_pos (4 to 6 ppm) and u_neg (−4 to −6 ppm)], and also for the 2-pool model [v_pos (4 to 6 ppm) and v_neg (−4 to −6 ppm)]. Then, for each B1_sat, the two ratios of ∆ω and −∆ω were calculated as follows: (A) Ratio (∆ω) =v_pos / u_pos. (B) Ratio (–∆ω)=v_neg / u_neg. Figure 2 plotted Ratio (∆ω) and Ratio (–∆ω) as a function of B1_sat. As seen, when B1_sat <1 µT, ratio values are close to 1, indicating accurate quantification of LD. However, when B1_sat ≥1 µT LD become inaccurate with ratio >1. For both Ratio (∆ω) and Ratio (–∆ω), a linear relationship with B1_sat can be determined, providing the prior knowledge of fitting errors. Here, before starting VOPVP optimization, a B1-dependent adjustment was applied to Z_exp, resulting in Z_B1adj=Z_exp (1+Ratio × L × |∆ω|/3). By multiplying Z_exp with the Ratio values at the applied B1_sat, the adjusted spectra (Z_B1adj) can compensate for the difference between LD and accurate quantification.

Then, with the initial value of VOPVP fitting defined by Eqs. [2-4], the fitting to Z_B1adj was divided into three parts. Part I, VOPVP function was used to fit the Z_B1adj between 0 and 6 ppm. Part II, VOPVP function was used to fit the Z_B1adj between −6 and 0 ppm. Part III, Lorentzian was employed to fit the Z_B1adj between −0.4 and 0.4 ppm. The final fitting results integrated the fitted data from part I (0.6 to 6 ppm), part II (−6 to −0.6 ppm) and part III (−0.4 to 0.4 ppm). Then, Spline interpolation was used to assess the final fitting data, namely, Z_VOPVP_final. For all Voxels, the difference between Z_VOPVP_final and Z_exp was calculated to obtain the amplitude of maps at ∆ω. DS effects in weak range at both sides of 0 ppm with the line-shape similar to Lorentzian were fitted into the part III. The Z-spectra was far from 0 ppm and might contain MT components, which made Pseudo Voigt Profile an ideal fitting method. Moreover, there was no exchangeable proton within 0.6 ppm, according to the exchangeable proton chemical shifts for various diamagnetic agents (49) ranging from 0 to 7 ppm. Therefore, only the accuracy of fitting within ±6 ppm was considered.
LD fitting
In addition, Lorentzian difference (LD) fitting (40,50) was carried out during the simulation. In this method, Lorentzian fitting was performed to evaluate the values of Z-spectra (−10 to −6.25 ppm, −1.7 to 1.7 ppm and 6.25 to 10 ppm at 9.4T), while spline interpolation was used to complete the entire fitting process. The fitted spectra were adopted as reference signals, representing the DS and semi-solid MT effects. The residual spectra of CEST (40) were formed by subtracting the measured Z-spectra from the fitted spectra.
For in vivo experiments, the offsets greater than ±6 ppm were not collected due to the restriction of scanning time. To improve LD performance, a compensate strategy similar to previous research (18) was employed, where the acquired Z-spectra were normalized by Ssat (−6 ppm) of the lower B1-sat, and then fitted by Lorentzian fitting.
Simulation
To assess the performance of the proposed VOPVP method, Bloch equation-based simulations were carried out using both 5-pool exchange model (free water, amide, amine, MT and NOE at −3.5 ppm) (51) and 6-pool model (free water, amide, amine, MT, NOE at −3.5 ppm and NOE at −1.6 ppm) (40). Simulation parameters for rodent brain tissue at 9.4 Tesla are listed in Table 1. Specifically, the 6-pool model contained more MT and NOE components but less amides and amines in comparison with 5-pool model (40,48). To further evaluate the robustness of our method, simulations were performed at six different B1_sat levels, i.e., 0.5, 1, 1.5, 2, 2.5 and 3 µT.

Full table
To assess the robustness of our VOPVP method, we further performed simulation for a range of T1w (0.5 to 2.5 s) and T2w (25 to 125 ms), all using the same ratio values. To prove the feasibility at clinical field strengths, the ratios were calculated (Figure S1) using the parameters at 3T for rodent brain tissue (Table S1). Then the VOPVP fittings were performed and compared, using either ratios calculated from 3T, or those from 9.4T.


In vivo experiment
Animal experiments were performed in accordance with the guidelines of Johns Hopkins University Animal Care and Use Committee guidelines. Balb/c NOD/SCID mouse were xenografted intracranially with 100,000 human glioblastoma cells to striatum of the brain (52,53) with MR imaging performed 6-week post-injection. In vivo MRI experiments were conducted on an 11.7T horizontal bore scanner (Bruker Biospec, Germany) using a transmit-receiver volume coil (23 mm diameter). CEST MRI images were acquired using a continuous wave pre-saturation pulse (Tsat =2,500 ms), followed by a rapid acquisition with relaxation enhancement (RARE) readout (RARE factor =12). B0 inhomogeneity was then corrected using WASSR (54). The Z-spectra were acquired from −6 to 6 ppm with an interval of 0.25 ppm at three B1_sat of 0.8, 1.2 and 2.4 µT. The other parameters were as follows: TR/TE =5,500 ms/11 ms, slice thickness =1 mm, FOV =17×14 mm2 and matrix size =96×64.
Evaluation criteria
The obtained data were evaluated by four parameters: (I) the sum of squares due to error (SSE), (II) coefficient of (R-square) determination (39), (III) simple analytic solution to the apparent exchanged-dependent relaxation (AREX) (20,23,51,55,56), and (IV) contrast-to-noise ratio (CNR) for in vivo experiments (39). The AREX was further defined as follows:
To evaluate the accuracy of CEST quantification methods in numerical simulations, we used 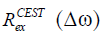 (20,40,55,57) as a gold standard, which is independent of non-specific tissue parameters such as T1w, DS and semi-solid MT effects:
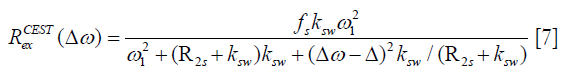
where fs is solute concentration, ksw is solute-water exchange rate, R2s is solute transverse relaxation and ω1 is irradiation power. In comparison with (∆ω), AREX, the inverse metric of the Z-spectra fitted by LD and VOPVP, was defined as below (40,55):
where fc is semi-solid MT pool size ratio.
Results
Simulations
Figure 3 displays the simulated Z-spectra, VOPVP fitting and LD fitting of B1_sat at 0.5, 1, 1.5, 2, 2.5 and 3 µT, apart from the difference between VOPVP and the simulated data. For the simulated data through 5-pool model, the difference spectra generated by VOPVP and Lorentzian fitting could reveal the peaks arising from amide proton at 3.5 ppm, amine protons at 2 ppm and NOE at −3.5 ppm (NOE at −1.6 ppm for 6-pool only). However, LD overestimated the amide, amine CEST signals when B1_sat =1, 1.5 and 2 µT, while underestimated NOE when B1_sat =2.5 and 3 µT. In contrast, for all the saturation powers, our VOPVP method could provide a closer fitting to the non-specific parts of Z-spectra (−6 to −5 ppm, −1.5 to 1.5 ppm and 4 to 6 ppm), as quantitatively indicated by both SSE and R-square (Table 2). As aforementioned, the 6-pool model may contain more MT and NOE components but less amides and amines than the 5-pool model. Our results showed the SSE of 6-pool increased by up to 100% from 5-pool model (Table 2) (B1_sat =3 µT) is not only NOE at −1.6 ppm but also the 6-pool model containing more MT components.


Full table
In addition, the AREX metrics derived from VOPVP fitting and LD fitting were further compared with analytical standard (Figure 4 and Table 3). For the 6-pool model, LD overestimated all the CEST and NOE signals. For the 5-pool model, LD overestimated amides and NOE (3.5 ppm) at B1_sat ≤2 µT (1, 1.5 and 2 µT), while underestimated APT and NOE (3.5 ppm) at 3 µT. For both the 5-pool and the 6-pool models, the derived AREXVOPVP spectra were significantly closer to the standard spectra, especially at B1_sat ≥1 µT (1, 1.5, 2, 2.5 and 3 µT). Table 3 lists the ratios of the peak intensities of the AREXLD and AREXVOPVP metrics to those of . Notably, for the 5-pool model, AREXVOPVP at amide frequency (3.5 ppm) and NOE (−3.5 ppm) were relatively close to at all B1_sat. While for the 6-pool model with a greater MT contribution, AREXVOPVP could estimate more accurately at lower B1_sat (≤2 µT), but still underestimated the APT at 2.5 and 3 µT; Nevertheless, for all cases, AREXVOPVP outperformed AREXLD with regard to all peaks (i.e., APT, amine and NOE).


 as a gold standard (40)
 Full table
The fitted linear function at 3T (Figure S1) suggested a slightly different slope and shift compared with those calculated at 9.4T (Figure 2). As seen, AREXVOPVP values were closer to the analytical solution than AREXLD values, for both B1_sat =1 µT and B1_sat =2 µT (Figure 5). As seen, the two kinds of VOPVP fitting curves are almost identical, which both resulted in accurate quantification (AREXVOPVP) compared with the analytical standard) (Figure S2, Table S2).
 for APT from simulated Z-spectra with variation of T1w and T2w, with the B1_sat of (A) 1 µT, (B) 2 µT.
 spectra at 3 T, for B1_sat of 0.5, 1 and 1.5 µT. (D) Quantification of the fitted Z-spectra using AREX (AREXLD and AREXVOPVP, which using ratios calculated from 9.4 T, and comparison with the analytical spectra at 3 T, for B1_sat of 0.5, 1 and 1.5 µT. LD, Lorentzian difference; VOPVP, Voxel-wise Optimization of Pseudo Voigt Profile; AREX, apparent exchanged-dependent relaxation.
 as a gold standard at 3 T (40) (5-pool)
 Full table
Tumor mouse
Further, VOPVP fitting was applied to quantify the contributions of APT, glutamate, amine and NOE effects in a mouse bearing glioblastoma. The T2w image (Figure 6A) indicated the anatomy, with a tumor ROI and the contralateral control one marked. To visualize the quantified spectra for all voxels, the offset-cut images were plotted with the residual spectra of LD fitting and VOPVP (Figure 6B,C). Transverse coordinates between 56 and 66 are the location of the tumor. Notably, the offset-cut values of VOPVP fitting were significantly higher at 3.5 ppm and 2 ppm in tumor than those in normal contralateral tissue. In contrast, the offset-cut values of LD fitting were significantly higher for Amide 3.5 ppm, Glu-CEST 3 ppm, Guanidinium-Amine 2 ppm and lower for NOE between −2 and −5 ppm in the tumor than those in normal contralateral tissue. The differences between VOPVP fitting and LD fitting for tumor ROI and normal contralateral ROI at three B1_sat level (0.8, 1.2 and 2.4 µT) are presented in Figure 6D,E. Moreover, the dips centered at −3.5, 2 and 3.5 ppm could be clearly observed on the Z-spectra at relatively low B1_sat, which corresponded to aliphatic NOE, guanidine amine and amide, respectively. Another dip around −1.6 ppm was observed in normal tissues, but not in tumors with low B1_sat, which were consistent with previous reports (58,59). Theoretically, a dip at 3 ppm from Glu-CEST should be visible at high B1_sat (10). However, it was not obviously shown on the Z-spectra due to the broadened dips. The residual of both VOPVP and LD fitting for the ROIs of tumor and normal contralateral tissue appeared at 3.5 ppm (amide), downfield from water and 2–5 ppm (NOE) up field from water. Overall, the fitting curves of VOPVP for the two ROIs were closer to the experimental measurements compared to those obtained by LD. Besides, the overestimation of LD fitting becomes obvious with the increasing B1_sat, which was also observed in a recent CEST study of simulations at 9.4T (40). The peaks appeared at 2 ppm could be clearly observed on the MTRasym map (Figure 6F) at all B1_sat, which were consistent with the conclusion drawn from the fitted residual spectra.

Furthermore, the proposed VOPVP method was evaluated by comparing with LD fitting and MTRasym (3.5 ppm) (Figure 7). Figure 7 shows the fitted amplitude maps using MTRasym at 3.5 ppm, LD fitting and VOPVP fitting in a mouse tumor model. The images were fitted voxel-wise to Eq. [2] by using the nonlinear fitting function (lsqcurvefit) in MATLAB. In line with previous findings on the APT imaging of glioma (4,60-62), a remarkably higher APT effect was found in tumors fitted by VOPVP. For NOE (VOPVP fitting), our results demonstrated the intensity of tumor was increased at higher B1_sat (1.2 and 2.4 µT) compared to normal tissue, but decreased at lower B1_sat (0.8 µT). Moreover, VOPVP fitting revealed a pronounced positive contrast in the tumor analyzed by Glu-CEST map. Whilst, the NOE (LD fitting) in tumor was lower than that in normal tissue at B1_sat = 0.8 µT, which were consistent with previous findings (63). Additionally, MTRasym (3.5 ppm) indicated that the signal intensity of tumor location was significantly higher than that of normal contralateral tissue location, which was in accordance with the results of previous studies (4,63,64).

Table 4 describes the quality of each CEST map. For APT and Glu-CEST, VOPVP method exhibited higher CNR than LD method and MTRasym (3.5 ppm), when B1_sat >1 µT.

Full table
Discussion
In this study, we propose a novel CEST quantification method, namely VOPVP, by fitting Z-spectra with a linear combination of Gaussian- and Lorentzian-line shapes as the reference spectra and taking the difference among experimental data for CEST quantification. To improve the conventional LD and enhance its robustness for various occasions (e.g., larger B1_sat and greater MT), we not only modified the fitting function from Lorentzian to Pseudo Voigt Profile (PVP), but also integrated a B1-dependent optimization for better compensation of the altered DS (spillover effect) and MT under different B1_sat. The main purposes of Z-spectra fitting in Lorentzian and VOPVP are to generate a reference spectrum without CEST and NOE, and to best simulate the confounding MT and DS. The semisolid MT effect is asymmetric around the water peak, which induces signal decline over a wide frequency range. It has been reported that a baseline term against the Lorentzian analysis can minimize the impact of global MT effect and noise arising from motion (40,50). A previous study has renormalized CEST Z-spectra by averaging the signal intensity of both end of Z-spectra of at relatively lower B1_sat (18) before performing LD fitting. Similarly, in our VOPVP method, a compensate ratio factor was applied to the experimental Z-spectra data, according to the acquisition B1_sat. The relationship between the ratio and B1_sat was established in advance through an offline step using the 5-pool Bloch simulation (Figures 1,2). Both simulation and in vivo mouse revealed that VOPVP displayed a better approximation to the referenced part of Z-spectra in comparison with LD analysis. Despite that VOPVP outperformed the conventional LD when the acquisition B1_sat is larger for fast-exchangeable species or when the tissue imposes a greater MT contribution, this method does not work well with larger B1_sat and greater MT component, especially not appropriate for amines and NOE (−1.6 ppm) that are closer to water (Table 3).
In the proposed approach we applied a B1-dependent adjustment to the measured Z-spectra, before starting of the optimization of pseudo voigt profile. The equation for adjustment was obtained offline, through simulations using a previously-published 5-pool model for brain tissue at 9.4T. Accurate reference spectra describing DS and MT were determined using a 2-pool model (water and semisolid), while Lorentzian fitting was also performed. The inaccuracy of LD fitting was further defined by the ratio of two residual areas, corresponding to the Lorentzian fitting spectrum and the accurate reference spectrum. As seen in Figure 2, when B1-sat <1 µT, the ratio is close to 1, indicating accurate quantification of LD. But, for larger B1-sat, LD inaccurately quantified CEST signal with ratio >1. We also figured the linear relationships between ratios and B1-sat. This prior knowledge of inaccuracy of LD at different B1_sat, was then employed in the online optimization step, to produce an adjusted Z-spectra better representing the DS and MT contributions under applied B1_sat. In another word, our quantification approach employed the prior knowledge of LD mismatch at different B1_sat to constrain the optimization algorithm (Levenberg-Marquardt algorithm here), leading to more accurate quantification. Despite that the adjustment uses Ratios that calculated from a 5-pool model of brain tissue, the followed VOPVP optimization will make it work for a range of tissue parameters (T1w and T2w), as shown in Figures 3,4,5. The Ratios is also applicable for different filed strengths, as validated by the 3T simulations (Figures S1,S2, Table S1). This constrained optimization method, through learning from the off-line simulations, could also applied to other fitting methods for CEST MRI in future.
Apart from taking the difference between a fitting reference spectra and the experimental data, several other quantification methods have been proposed, including apparent exchange-dependent relaxation (AREX) (5), extrapolated semi-solid magnetization transfer reference (EMR) (4,65), multi-pool Bloch-McConnell (BM) fitting (32), three-offset approach (23,66) and the combination of these quantitative methods (20,23,35,51). Superior to MTRasym, all these methods allow the separation of CEST and NOE effect. However, the accuracy and robustness of these methods are varied, and each has its own limitations. For instance, AREX has been applied only to slow- (e.g., APT) (27,38) and intermediate-exchangeable [e.g., creatine (creCEST) (67)] solutes, which is also a fitting approach to quantify fast-exchangeable amine CEST signals (5,27). BM fitting requires prior knowledge of parameters (e.g., T2 and kex of each exchanging proton) and is time consuming compared to LD fitting and AREX (68). EMR approach has the potential to be an important and accurate CEST MRI quantitative technique (4), but it may overestimate the measurements of APT and NOE (4). Three-offset method is a relatively simple quantification approach (23,66). However, the linear assumption underlying the three-offset method may be oversimplified (39,40).
NOEs are depended on the applied B1_sat and filed strength. It has been reported there is no significant difference in the NOE (9.4T, 1 µT) between tumors and normal contralateral tissues (23). Previous findings have shown that the NOE signal at 4.7 Tesla in tumor is lower than that in normal contralateral tissue (63), which are consistent with the results of offset-cuts (Figure 6B,C). APT imaging, a specific form of CEST, can potentially serve as a non-invasive means to characterize abnormal tissues such as tumors (23). Previous reports have shown that the APT-related pool size of the tumor center and rim is significantly larger than that of normal tissue, as opposed to the NOE-related pool size. Moreover, APT can detect malignant tumors (63,64,69), the changes that have been induced by elevated mobile cellular and peptide contents (70). In the present study, it can be seen that the intensity of APT signal is higher in tumor than in normal contralateral tissue, as revealed the offset-cuts (Figure 6B,C) and fitted amplitudes maps (Figure 7) of our proposed VOPVP fitting, which is consistent with the findings of previous literature (4,70).
As an improvement of LD method, our VOPVP fitting may provide a simple, robust and more accurate approach for quantifying CEST and NOE contrast. More in vivo validations and at the clinical field strength will be performed in the future.
Acknowledgments
The authors would like to thank Dr. Chengyan Chu and Dr. Piotr Walczak at Johns Hopkins University for their generous offering of a tumor-bearing mouse.
Funding: This work was supported by the National Natural Science Foundation of China under Grant No.61601364, Xi’an Key Laboratory of Radiomics and Intelligent Perception Grant 201805060ZD11CG44, and by the Postgraduate Independent Innovation Project of Northwest University (China) Grant YZZ17180. In vivo MRI data of the mouse were collected under support of Johns Hopkins Radiology Britestar Award to Dr. Xiaolei Song.
Footnote
Conflicts of Interest: The authors have no conflicts of interest to declare.
Ethical Statement: MR imaging experiment on a tumor-bearing mouse was performed under the approval of the Johns Hopkins University Animal Care and Use Committee (ACUC) with protocol # MO13M251.
References
- Ward KM, Aletras AH, Balaban RS. A new class of contrast agents for MRI based on proton chemical exchange dependent saturation transfer (CEST). J Magn Reson 2000;143:79-87. [Crossref] [PubMed]
- Zhou J, vanZijl PC. Chemical exchange saturation transfer imaging and spectroscopy. Prog Nucl Magn Reson Spectrosc 2006;48:109-36. [Crossref]
- van Zijl PC, Yadav NN. Chemical exchange saturation transfer (CEST): what is in a name and what isn't? Magn Reson Med 2011;65:927-48. [Crossref] [PubMed]
- Heo HY, Zhang Y, Lee DH, Hong X, Zhou J. Quantitative assessment of amide proton transfer (APT) and nuclear overhauser enhancement (NOE) imaging with extrapolated semi-solid magnetization transfer reference (EMR) signals: Application to a rat glioma model at 4.7 Tesla. Magn Reson Med 2016;75:137-49. [Crossref] [PubMed]
- Zhang XY, Wang F, Li H, Xu J, Gochberg DF, Gore JC, Zu Z. CEST imaging of fast exchanging amine pools with corrections for competing effects at 9.4 T. NMR Biomed 2017;30. [Crossref] [PubMed]
- Zhou J, Lal B, Wilson DA, Laterra J, van Zijl PC. Amide proton transfer (APT) contrast for imaging of brain tumors. Magn Reson Med 2003;50:1120-6. [Crossref] [PubMed]
- Cai K, Singh A, Poptani H, Li W, Yang S, Lu Y, Hariharan H, Zhou XJ, Reddy R. CEST signal at 2ppm (CEST@2ppm) from Z-spectral fitting correlates with creatine distribution in brain tumor. NMR Biomed 2015;28:1-8. [PubMed]
- Chan KW, McMahon MT, Kato Y, Liu G, Bulte JW, Bhujwalla ZM, Artemov D, van Zijl PC. Natural D-glucose as a biodegradable MRI contrast agent for detecting cancer. Magn Reson Med 2012;68:1764-73. [Crossref] [PubMed]
- Walker-Samuel S, Ramasawmy R, Torrealdea F, Rega M, Rajkumar V, Johnson SP, Richardson S, Goncalves M, Parkes HG, Arstad E, Thomas DL, Pedley RB, Lythgoe MF, Golay X. In vivo imaging of glucose uptake and metabolism in tumors. Nat Med 2013;19:1067-72. [Crossref] [PubMed]
- Cai K, Haris M, Singh A, Kogan F, Greenberg JH, Hariharan H, Detre JA, Reddy R. Magnetic resonance imaging of glutamate. Nat Med 2012;18:302-6. [Crossref] [PubMed]
- van Zijl PC, Jones CK, Ren J, Malloy CR, Sherry AD. MRI detection of glycogen in vivo by using chemical exchange saturation transfer imaging (glycoCEST). Proc Natl Acad Sci U S A 2007;104:4359-64. [Crossref] [PubMed]
- Haneder S, Apprich SR, Schmitt B, Michaely HJ, Schoenberg SO, Friedrich KM, Trattnig S. Assessment of glycosaminoglycan content in intervertebral discs using chemical exchange saturation transfer at 3.0 Tesla: preliminary results in patients with low-back pain. Eur Radiol 2013;23:861-8. [Crossref] [PubMed]
- Zhang S, Malloy CR, Sherry AD. MRI Thermometry Based on PARACEST Agents. J Am Chem Soc 2005;127:17572-3. [Crossref] [PubMed]
- Guo Y, Zhou IY, Chan ST, Wang Y, Mandeville ET, Igarashi T, Lo EH, Ji X, Sun PZ. pH-sensitive MRI demarcates graded tissue acidification during acute stroke - pH specificity enhancement with magnetization transfer and relaxation-normalized amide proton transfer (APT) MRI. Neuroimage 2016;141:242-9. [Crossref] [PubMed]
- Sun PZ, Wang E, Cheung JS. Imaging acute ischemic tissue acidosis with pH-sensitive endogenous amide proton transfer (APT) MRI--correction of tissue relaxation and concomitant RF irradiation effects toward mapping quantitative cerebral tissue pH. Neuroimage 2012;60:1-6. [Crossref] [PubMed]
- Longo DL, Cutrin JC, Michelotti F, Irrera P, Aime S. Noninvasive evaluation of renal pH homeostasis after ischemia reperfusion injury by CEST-MRI. NMR Biomed 2017;30. [Crossref] [PubMed]
- Jeong HK, Han K, Zhou J, Zhao Y, Choi YS, Lee SK, Ahn SS. Characterizing amide proton transfer imaging in haemorrhage brain lesions using 3T MRI. Eur Radiol 2017;27:1577-84. [Crossref] [PubMed]
- Tietze A, Blicher J, Mikkelsen IK, Østergaard L, Strother MK, Smith SA, Donahue MJ. Assessment of ischemic penumbra in patients with hyperacute stroke using amide proton transfer (APT) chemical exchange saturation transfer (CEST) MRI. NMR Biomed 2014;27:163-74. [Crossref] [PubMed]
- Sun PZ, Cheung JS, Wang E, Lo EH. Association between pH-weighted endogenous amide proton chemical exchange saturation transfer MRI and tissue lactic acidosis during acute ischemic stroke. J Cereb Blood Flow Metab 2011;31:1743-50. [Crossref] [PubMed]
- Zaiss M, Xu J, Goerke S, Khan IS, Singer RJ, Gore JC, Gochberg DF, Bachert P. Inverse Z-spectrum analysis for spillover-, MT-, and T1 -corrected steady-state pulsed CEST-MRI--application to pH-weighted MRI of acute stroke. NMR Biomed 2014;27:240-52. [Crossref] [PubMed]
- Dula AN, Arlinghaus LR, Dortch RD, Dewey BE, Whisenant JG, Ayers GD, Yankeelov TE, Smith SA. Amide proton transfer imaging of the breast at 3 T: establishing reproducibility and possible feasibility assessing chemotherapy response. Magn Reson Med 2013;70:216-24. [Crossref] [PubMed]
- Jia G, Abaza R, Williams JD, Zynger DL, Zhou J, Shah ZK, Patel M, Sammet S, Wei L, Bahnson RR, Knopp MV. Amide proton transfer MR imaging of prostate cancer: a preliminary study. J Magn Reson Imaging 2011;33:647-54. [Crossref] [PubMed]
- Xu J, Zaiss M, Zu Z, Li H, Xie J, Gochberg DF, Bachert P, Gore JC. On the origins of chemical exchange saturation transfer (CEST) contrast in tumors at 9.4 T. NMR Biomed 2014;27:406-16. [Crossref] [PubMed]
- Desmond KL, Moosvi F, Stanisz GJ. Mapping of amide, amine, and aliphatic peaks in the CEST spectra of murine xenografts at 7 T. Magn Reson Med 2014;71:1841-53. [Crossref] [PubMed]
- Li C, Peng S, Wang R, Chen H, Su W, Zhao X, Zhou J, Chen M. Chemical exchange saturation transfer MR imaging of Parkinson's disease at 3 Tesla. Eur Radiol 2014;24:2631-9. [Crossref] [PubMed]
- Sagiyama K, Mashimo T, Togao O, Vemireddy V, Hatanpaa KJ, Maher EA, Mickey BE, Pan E, Sherry AD, Bachoo RM, Takahashi M. In vivo chemical exchange saturation transfer imaging allows early detection of a therapeutic response in glioblastoma. Proc Natl Acad Sci U S A 2014;111:4542-7. [Crossref] [PubMed]
- Zaiss M, Windschuh J, Paech D, Meissner JE, Burth S, Schmitt B, Kickingereder P, Wiestler B, Wick W, Bendszus M, Schlemmer HP, Ladd ME, Bachert P, Radbruch A. Relaxation-compensated CEST-MRI of the human brain at 7T: Unbiased insight into NOE and amide signal changes in human glioblastoma. Neuroimage 2015;112:180-8. [Crossref] [PubMed]
- Jiang S, Zou T, Eberhart CG, Villalobos MAV, Heo HY, Zhang Y, Wang Y, Wang X, Yu H, Du Y, van Zijl PCM, Wen Z, Zhou J. Predicting IDH mutation status in grade II gliomas using amide proton transfer-weighted (APTw) MRI. Magn Reson Med 2017;78:1100-9. [Crossref] [PubMed]
- Togao O, Yoshiura T, Keupp J, Hiwatashi A, Yamashita K, Kikuchi K, Suzuki Y, Suzuki SO, Iwaki T, Hata N, Mizoguchi M, Yoshimoto K, Sagiyama K, Takahashi M, Honda H. Amide proton transfer imaging of adult diffuse gliomas: correlation with histopathological grades. Neuro Oncol 2014;16:441-8. [Crossref] [PubMed]
- Aime S, Barge A, Delli Castelli D, Fedeli F, Mortillaro A, Nielsen FU, Terreno E. Paramagnetic lanthanide(III) complexes as pH-sensitive chemical exchange saturation transfer (CEST) contrast agents for MRI applications. Magn Reson Med 2002;47:639-48. [Crossref] [PubMed]
- Togao O, Hiwatashi A, Yamashita K, Kikuchi K, Keupp J, Yoshimoto K, Kuga D, Yoneyama M, Suzuki SO, Iwaki T, Takahashi M, Iihara K, Honda H. Grading diffuse gliomas without intense contrast enhancement by amide proton transfer MR imaging: comparisons with diffusion- and perfusion-weighted imaging. Eur Radiol 2017;27:578-88. [Crossref] [PubMed]
- Woessner DE, Zhang S, Merritt ME, Sherry AD. Numerical solution of the Bloch equations provides insights into the optimum design of PARACEST agents for MRI. Magn Reson Med 2005;53:790-9. [Crossref] [PubMed]
- Song X, Gilad AA, Joel S, Liu G, Bar-Shir A, Liang Y, Gorelik M, Pekar JJ, van Zijl PC, Bulte JW, McMahon MT. CEST phase mapping using a length and offset varied saturation (LOVARS) scheme. Magn Reson Med 2012;68:1074-86. [Crossref] [PubMed]
- Zhou J, Wilson DA, Sun PZ, Klaus JA, Van Zijl PC. Quantitative description of proton exchange processes between water and endogenous and exogenous agents for WEX, CEST, and APT experiments. Magn Reson Med 2004;51:945-952. [Crossref] [PubMed]
- Zu Z, Li H, Xu J, Zhang XY, Zaiss M, Li K, Does MD, Gore JC, Gochberg DF. Measurement of APT using a combined CERT-AREX approach with varying duty cycles. Magn Reson Imaging 2017;42:22-31. [Crossref] [PubMed]
- Yuan J, Zhang Q, Wang YX, Wei J, Zhou J. Accuracy and uncertainty of asymmetric magnetization transfer ratio quantification for amide proton transfer (APT) imaging at 3T: a Monte Carlo study. Conf Proc IEEE Eng Med Biol Soc 2013;2013:5139-42. [PubMed]
- Ji Y, Zhou IY, Qiu B, Sun PZ. Progress toward quantitative in vivo chemical exchange saturation transfer (CEST) MRI. Isr J Chem 2017;57:809-24. [Crossref]
- Windschuh J, Zaiss M, Meissner JE, Paech D, Radbruch A, Ladd ME, Bachert P. Correction of B1-inhomogeneities for relaxation-compensated CEST imaging at 7 T. NMR Biomed 2015;28:529-37. [Crossref] [PubMed]
- Zhou IY, Wang E, Cheung JS, Zhang X, Fulci G, Sun PZ. Quantitative chemical exchange saturation transfer (CEST) MRI of glioma using Image Downsampling Expedited Adaptive Least-squares (IDEAL) fitting. Sci Rep 2017;7:84. [Crossref] [PubMed]
- Zhang XY, Wang F, Li H, Xu J, Gochberg DF, Gore JC, Zu Z. Accuracy in the quantification of chemical exchange saturation transfer (CEST) and relayed nuclear Overhauser enhancement (rNOE) saturation transfer effects. NMR Biomed 2017;30. [Crossref] [PubMed]
- Zaiss M, Schmitt B, Bachert P. Quantitative separation of CEST effect from magnetization transfer and spillover effects by Lorentzian-line-fit analysis of z-spectra. J Magn Reson 2011;211:149-55. [Crossref] [PubMed]
- Liu G, Gilad AA, Bulte JW, van Zijl PC, McMahon MT. High-throughput screening of chemical exchange saturation transfer MR contrast agents. Contrast Media Mol Imaging 2010;5:162-70. [Crossref] [PubMed]
- Zaiss M, Bachert P. Chemical exchange saturation transfer (CEST) and MR Z-spectroscopy in vivo: a review of theoretical approaches and methods. Phys Med Biol 2013;58:R221-69. [Crossref] [PubMed]
- Wertheim GK, Butler MA, West KW, Buchanan DNE. Determination of the Gaussian and Lorentzian content of experimental line shapes. Rev Sci Instrum 1974;45:1369-71. [Crossref]
- Thompson P, Cox DE, Hastings JB. Rietveld refinement of Debye-Scherrer synchrotron X-ray data from Al2O3. J Appl Cryst 1987;20:79-83. [Crossref]
- Di Roccoa HO, Cruzado A. The voigt profile as a sum of a gaussian and a lorentzian functions, when the weight coefficient depends only on the widths ratio. Acta Physica Polonica A 2012;122:666-9. [Crossref]
- Ida T, Ando M, Toraya H. Extended pseudo-Voigt function for approximating the Voigt profile. J Appl Cryst 2000;33:1311-66. [Crossref]
- Heo HY, Lee DH, Zhang Y, Zhao X, Jiang S, Chen M, Zhou J. Insight into the quantitative metrics of chemical exchange saturation transfer (CEST) imaging. Magn Reson Med 2017;77:1853-65. [Crossref] [PubMed]
- Liu G, Moake M, Har-el YE, Long CM, Chan KW, Cardona A, Jamil M, Walczak P, Gilad AA, Sgouros G, van Zijl PC, Bulte JW, McMahon MT. In vivo multicolor molecular MR imaging using diamagnetic chemical exchange saturation transfer liposomes. Magn Reson Med 2012;67:1106-13. [Crossref] [PubMed]
- Jones CK, Polders D, Hua J, Zhu H, Hoogduin HJ, Zhou J, Luijten P, van Zijl PC. In vivo three-dimensional whole-brain pulsed steady-state chemical exchange saturation transfer at 7 T. Magn Reson Med 2012;67:1579-89. [Crossref] [PubMed]
- Li H, Li K, Zhang XY, Jiang X, Zu Z, Zaiss M, Gochberg DF, Gore JC, Xu J. R1 correction in amide proton transfer imaging: indication of the influence of transcytolemmal water exchange on CEST measurements. NMR Biomed 2015;28:1655-62. [Crossref] [PubMed]
- Sun P, Xia S, Lal B, Eberhart CG, Quinones-Hinojosa A, Maciaczyk J, Matsui W, Dimeco F, Piccirillo SM, Vescovi AL, Laterra J. DNER, an epigenetically modulated gene, regulates glioblastoma-derived neurosphere cell differentiation and tumor propagation. Stem cells (Dayton, Ohio) 2009;27:1473-86. [Crossref] [PubMed]
- Ying M, Wang S, Sang Y, Sun P, Lal B, Goodwin CR, Guerrero-Cazares H, Quinones-Hinojosa A, Laterra J, Xia S. Regulation of glioblastoma stem cells by retinoic acid: role for Notch pathway inhibition. Oncogene 2011;30:3454-67. [Crossref] [PubMed]
- Kim M, Gillen J, Landman BA, Zhou J, van Zijl PC. Water saturation shift referencing (WASSR) for chemical exchange saturation transfer (CEST) experiments. Magn Reson Med 2009;61:1441-50. [Crossref] [PubMed]
- Zaiss M, Zu Z, Xu J, Schuenke P, Gochberg DF, Gore JC, Ladd ME, Bachert P. A combined analytical solution for chemical exchange saturation transfer and semi-solid magnetization transfer. NMR Biomed 2015;28:217-230. [Crossref] [PubMed]
- Li H, Zu Z, Zaiss M, Khan IS, Singer RJ, Gochberg DF, Bachert P, Gore JC, Xu J. Imaging of amide proton transfer and nuclear Overhauser enhancement in ischemic stroke with corrections for competing effects. NMR Biomed 2015;28:200-9. [Crossref] [PubMed]
- Zaiss M, Bachert P. Exchange-dependent relaxation in the rotating frame for slow and intermediate exchange -- modeling off-resonant spin-lock and chemical exchange saturation transfer. NMR Biomed 2013;26:507-18. [Crossref] [PubMed]
- Zhang XY, Wang F, Jin T, Xu J, Xie J, Gochberg DF, Gore JC, Zu Z. MR imaging of a novel NOE-mediated magnetization transfer with water in rat brain at 9.4 T. Magn Reson Med 2017;78:588-97. [Crossref] [PubMed]
- Zhang XY, Wang F, Afzal A, Xu J, Gore JC, Gochberg DF, Zu Z. A new NOE-mediated MT signal at around -1.6ppm for detecting ischemic stroke in rat brain. Magn Reson Imaging 2016;34:1100-6. [Crossref] [PubMed]
- Yuwen Zhou I, Wang E, Cheung JS, Lu D, Ji Y, Zhang X, Fulci G, Sun PZ. Direct saturation-corrected chemical exchange saturation transfer MRI of glioma: Simplified decoupling of amide proton transfer and nuclear overhauser effect contrasts. Magn Reson Med 2017;78:2307-14. [Crossref] [PubMed]
- Salhotra A, Lal B, Laterra J, Sun PZ, van Zijl PC, Zhou J. Amide proton transfer imaging of 9L gliosarcoma and human glioblastoma xenografts. NMR Biomed 2008;21:489-97. [Crossref] [PubMed]
- Jones CK, Schlosser MJ, van Zijl PC, Pomper MG, Golay X, Zhou J. Amide proton transfer imaging of human brain tumors at 3T. Magn Reson Med 2006;56:585-92. [Crossref] [PubMed]
- Zhou J, Hong X, Zhao X, Gao JH, Yuan J. APT-weighted and NOE-weighted image contrasts in glioma with different RF saturation powers based on magnetization transfer ratio asymmetry analyses. Magn Reson Med 2013;70:320-7. [Crossref] [PubMed]
- Zhou J, Blakeley JO, Hua J, Kim M, Laterra J, Pomper MG, van Zijl PC. Practical data acquisition method for human brain tumor amide proton transfer (APT) imaging. Magn Reson Med 2008;60:842-9. [Crossref] [PubMed]
- Heo HY, Zhang Y, Jiang S, Lee DH, Zhou J. Quantitative assessment of amide proton transfer (APT) and nuclear overhauser enhancement (NOE) imaging with extrapolated semisolid magnetization transfer reference (EMR) signals: II. Comparison of three EMR models and application to human brain glioma at 3 Tesla. Magn Reson Med 2016;75:1630-9. [Crossref] [PubMed]
- Jin T, Wang P, Zong X, Kim SG. MR imaging of the amide-proton transfer effect and the pH-insensitive nuclear overhauser effect at 9.4 T. Magn Reson Med 2013;69:760-70. [Crossref] [PubMed]
- Rerich E, Zaiss M, Korzowski A, Ladd ME, Bachert P. Relaxation-compensated CEST-MRI at 7 T for mapping of creatine content and pH--preliminary application in human muscle tissue in vivo. NMR Biomed 2015;28:1402-12. [Crossref] [PubMed]
- Shah SM, Mougin OE, Carradus AJ, Geades N, Dury R, Morley W., Gowland P.A. The z-spectrum from human blood at 7T. Neuroimage 2018;167:31-40. [Crossref] [PubMed]
- Heo HY, Zhang Y, Jiang S, Zhou J. Influences of experimental parameters on chemical exchange saturation transfer (CEST) metrics of brain tumors using animal models at 4.7T. Magn Reson Med 2019;81:316-30. [Crossref] [PubMed]
- Zhao X, Wen Z, Huang F, Lu S, Wang X, Hu S, Zu D, Zhou J. Saturation power dependence of amide proton transfer image contrasts in human brain tumors and strokes at 3 T. Magn Reson Med 2011;66:1033-41. [Crossref] [PubMed]

