

Imaging of glutamate in acute traumatic brain injury using chemical exchange saturation transfer
Introduction
Traumatic brain injury (TBI) is a major health and socioeconomic problem worldwide (1). In the United States, more than 5.3 million individuals suffer from persistent cognitive impairments resulting from TBI alone (2). Early medical intervention and rehabilitation are essential for reducing the risk of chronic sequelae. However, there are no effective measurements to guide medical interventions and predict which patients may experience poor outcomes including cognitive, emotional, and physical impairments (3).
Fortunately, in the past decade, by enabling non-invasive and quantitative assessment of brain metabolite changes after injury, magnetic resonance spectroscopy (MRS) could be capable of evaluating occult TBI damage and predicting outcome of patients with TBI (4-7). Shutter and coworkers (6) found that glutamate (Glu)/glutamine (Glx) and choline were significantly elevated in occipital gray and parietal white matter early after injury in patients with poor long-term outcomes. However, because of poor spatial resolution and long acquisition times (8), MRS is not an ideal imaging modality for TBI in clinical application.
Chemical exchange saturation transfer (CEST) is an important contrast mechanism in the field of magnetic resonance molecular imaging. In CEST experiments, a frequency-selective radiofrequency pulse is used to saturate certain exchangeable solute protons, and then the proportional decrease of the bulk water magnetization is measured to characterize the microenvironment of the solution, which can include metabolite concentration, temperature, and pH (9-11). Compared to MRS, CEST has higher sensitivity and spatial resolution (8). Currently, CEST has several promising applications, including GluCEST for Glu (12,13), amide proton transfer for peptides and mobile proteins in tissue (2), and GlucoCEST for glucose (14). As GluCEST contributes a large part of the asymmetric magnetization transfer (MT) ratio (MTRasym) signal at 3 ppm (8), the MTRasym analysis can be used to quantify the changes of Glu concentration.
Glu is the most abundant excitatory neurotransmitter in the brain, which is involved in many important physiological functions in the nervous system (15,16). TBI can lead to a significant increase in Glu levels in the brain (17,18), resulting in Glu excitotoxicity. Current studies have proven that Glu plays a crucial role in the development of secondary injury following TBI, which contributes significantly to the expansion of total volume of injury (19,20). We hypothesized that GluCEST imaging would be used as an effective technique to precisely diagnose TBI.
GluCEST and MRS are both noninvasive and quantitative imaging methods. Earlier studies have applied them to many nervous system disorders and compared their diagnostic performance. A positive correlation was shown between the methods, while GluCEST seemed to outperform MRS (12,13). In the current study, we used a 3.0-Tesla MR scanner to explore the capability of GluCEST imaging in the evaluation of Glu alterations in acute mild-to-moderate TBI. To further corroborate the change in GluCEST signal resulting from changes in Glu concentration, we analyzed the correlation between Glu alterations measured via GluCEST and MRS. At last, we discussed in detail the potential of using the GluCEST signal for predicting the outcome of TBI patients.
Methods
Phantom preparation
GluCEST phantoms were prepared based on earlier studies (8,21) to optimize CEST magnetic resonance imaging (MRI). Next, 0, 10, 20, 30 mmol/L (mM) Glu (Sigma-Aldrich, St Louis, MO, USA) solutions were prepared and dissolved in phosphate-buffered saline. Solutions were titrated to pH =7.0. Tubes were inserted into a phantom holder filled with 1% agarose gel to minimize susceptibility inhomogeneity.
Participants
The study protocol was designed in line with the guidelines outlined in the Declaration of Helsinki and approved by the local institutional review board. After a complete description of the study was provided to each participant, informed written consent was obtained from each participant or legal guardian if patients were unable to supply consent before the study. All subjects were examined between February 2016 and January 2017.
Based on clinical severity, as rated by the Glasgow Coma Scale (GCS), we defined mild-to-moderate TBI as having a GCS of >8 measured before the initiation of paralytics or sedatives (22). Exclusion criteria included a history of brain damage with associated loss of consciousness; a preexisting psychiatric disorder; a history of alcoholism or drug dependency; and a history of known neurologic disorder, including stroke, epilepsy, and somatic disorders.
In this study, we identified 32 patients (23 men and 9 women; age range, 21–59 years; mean age, 34.3±9.6 years), with well-documented mild-to-moderate TBI, recruited from the Department of Neurosurgery in our hospital. Fifteen healthy controls (HC group) matched for sex, age, and education level were also enrolled (8 men and 7 women; age range, 20–50 years; mean age, 33.3±8.9 years).
Clinical assessments and outcome measures
Variables assessed included gender, age, education, cause of brain injury, initial GCS score, laboratory and radiographic data, and the number of days between the insult and MRI scans. The Montreal Cognitive Assessment (MoCA) examination was administered to all study subjects by two experienced neurologists at 1-month postinjury. MoCA is a brief but comprehensive cognitive screening test (23) and is widely used in various clinical experiments such as neuropsychiatric systemic lupus erythematosus (24), and amnestic mild cognitive impairment (25). This test measures multiple cognitive domains, including memory, concentration, orientation, attention, language, working memory, visuospatial skills, and executive functions. Scores <26 for MoCA was considered as indicative of obvious cognitive impairment (23). Based on the MoCA score, the TBI patients were divided into two groups: patients with good cognitive outcome (score ≥26) (GCO group) (12 men and 6 women; age range, 21–59 years; mean age, 31.6±10.5 years) and patient with poor cognitive outcome (score <26) (PCO group) (11 men and 3 women; age range, 26–52 years; mean age, 37.9±7.2 years).
Radiological assessments
Once patients were medically stable within 1 week after injury, they were imaged on a 3.0-Tesla MR scanner (Sigma; GE Healthcare, Milwaukee, WI, USA), using an 8-channel phased-array head coil. We used sponge padding to limit head motion. The T2-weighted images (T2WI) [repetition time (TR) =4,480 ms, echo time (TE) =120 ms], the T2WI fluid-attenuated inversion recovery images (TR =8,600 ms, TE =155 ms, inv. time =2,100 ms), and diffusion-weighted images (TR =6,000 ms; TE = minimum; b values =1,000) were performed to acquire information on the brains of all subjects.
Multivoxel MRS was carried out with a point-resolved spectroscopy sequence (TR =1,500 ms, TE =35 ms, number of excitations =1, and phase × frequency =18×18). For MRS acquisition, the level of the basal ganglia was selected for the volumes of interest (VOIs), covering portions of the parietooccipital white and gray matter, and frontal white and gray matter (Figure 1). Shimming (linewidth, <15) and water suppression (≥98%) were automatically performed on each subject using an optimized relaxation delay scheme and variable pulse power.

The CEST scan was based on a MT-prepared gradient echo (GRE) MRI sequence with the following settings: TR =50 ms, TE =3.1 ms, field of view (FOV) =240×240 mm2, matrix =128×128, 1 slice, slice thickness =5 mm, bandwidth =15.63 kHz. The MT saturation pulse was a Fermi pulse with 20 ms width and a B1 of 1.95 µT (21). The CEST imaging was performed on the same brain slice as the MRS. Forty-one equidistant frequency offsets from 5 to −5 ppm and S0 images were acquired.
Regions of interest (ROIs) consisted of 4 standard regions in all TBI patients and healthy controls: occipital gray matter (OGM), bilateral parietooccipital white matter (PWM) including the left PWM (LPWM) and right PWM (RPWM), and the splenium of the corpus callosum (SCC). No VOI was placed at the site of the maximum cerebral destruction. Also, favored sites of contra-coup injury (22), such as the frontal-parietal or frontal-temporal lobes, were excluded in our study. The precise location of the spectroscopic voxels was chosen to sample only normal-appearing tissue, which was unaffected by obvious hemorrhage or contusion because larger spectral changes produced in these focal areas of injury would tend to overestimate the total amount of injury and produce false-positive predictions. All staff who placed the VOI or ROIs were well trained, and they critically followed our criteria. Each examination was later reviewed by at least one experienced neuroradiologist for such abnormalities.
Data processing
We initially applied SAGE software for phase and frequency correction. Then, metabolite spectral analysis was performed by LCModel (LCModel Inc. Canada). Single voxel spectroscopy was performed on the OGM with the same parameters as multivoxel spectroscopy, to yield a reasonable calibration factor. We applied these data to calibrate metabolite concentrations and calculated mean absolute metabolite concentrations for each region in all participants.
All CEST image processing was performed using software routines (Figures S1-S3) written in Matlab 7 (Mathworks, Natick, MA, USA). Acquired images were corrected for B0 inhomogeneity using a water saturation shift referencing map (WASSR). The corresponding correction algorithm has been discussed previously in detail (26). Then, the GluCEST contrast map was generated using the following equation (27):
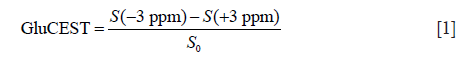


Where S(−3 ppm) and S(+3 ppm) are the images at –3 ppm and +3 ppm, respectively. Z-spectra were obtained from the normalized CEST images. The MTRasym maps were computed using the equation (27):
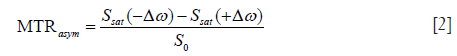
Where Ssat(±Δω) is the magnetizations with saturation at a “+” or “−” Δω offset from the water resonance, and S0 is the magnetization off image.
GluCEST% values measured in GluCEST contrast maps and absolute Glu concentrations [Glu] measured by MRS were calculated from the OGM, bilateral PWM, and SCC. We compared GluCEST% values and [Glu] among the three groups (PCO, GCO, and HC) by using analysis of variance (ANOVA). If the overall test of the three means for GluCEST% values and [Glu] were significantly different, we used the least significant difference approach for multiple comparisons of the means of any two groups. We also applied two independent t-tests to compare GluCEST% values and [Glu] between HCs and all TBI patients. The proportions of males in the three groups were assessed using a χ2 test. To compare differences in mean values for age, education and MoCA scores among the three groups, we also performed ANOVA. We used two independent t-tests to compare differences in mean values for the admission GCS scores and the number of days after insult between the GCO and PCO groups. The relationships between GluCEST and MRS measurements in all evaluated VOIs were analyzed using Pearson’s correlation test. To evaluate which technique was more accurate for cognitive outcome prediction of TBI patients, we employed the receiver operating characteristic (ROC) curve. For each ROC curve, the area under the curve (AUC), known as the most commonly used global index of diagnostic accuracy (28), was estimated with nonparametric methods. Comparisons of the AUCs were conducted with methods described by DeLong et al. (29).
Results
Glu phantom study
Glu phantom data are shown in Figure 2. GluCEST% value was linearly proportional to Glu concentration in the physiological range at pH =7 (R2 =0.9648, Figure 2A). Figure 2B presents the GluCEST map of Glu phantoms at different concentrations. Figure 2C shows the z-spectra for different concentrations of Glu phantoms. The CEST peak of Glu was sharper and centered around 3.0 ppm. The GluCEST effect was enhanced as the Glu concentration grew higher, which was consistent with an earlier study (8).

Demographics and clinical characteristics
A total of 32 TBI patients and 15 HCs completed the entire protocol and met the pre-established criteria of spectra quality. According to the admission GCS score, there were 25 mild (GCS 13–15) and 7 moderate (GCS 9–12) TBI patients. TBI was due to motor vehicle accidents in 25 of 32 individuals, 4 patients were injured due to a fall, and 3 were assaulted. The three groups (GCO, PCO and HC) did not differ significantly in terms of age (F=1.911, P=0.160), gender (χ2=2.061, P=0.357), or education (F=0.618, P=0.544). Similarly, differences in GCS score (t=−2.023, P=0.069) and MRI time (t=0.361, P=0.721) between the GCO and PCO groups were not statistically significant. MoCA scores (P<0.001) were significantly lower in the PCO group compared with those in the HC and GCO groups, while there were no differences between the HC and GCO groups. The demographic and clinical characteristics of all the participants are presented in Table 1.

Full table
MRI data
The T2WI images, GluCEST maps, and MRS spectra in the LPWM from a healthy control, a patient with GCO, and a patient with PCO, are shown in Figure 3. The regional distribution of Glu in different regions of the brain was illustrated based on the GluCEST maps from both TBI patients and the HC (Figure 3B,E,H). We observed a higher GluCEST signal in gray compared with white matter, in accord with earlier reports on the human brain (8,12). Also, GluCEST signal intensities in the OGM, bilateral PWM, and SCC were higher in the patient with PCO than in either the HC or the patient with GCO, while the GluCEST signal intensities did not differ between the HC and the patient with GCO. To further corroborate whether the alteration in GluCEST signal resulted from a change in Glu concentration, we also performed multivoxel MRS for all TBI patients and controls. In the MRS spectra of the LPWM, an increased Glu peak amplitude was observed in the patient with PCO (13.22 mM) in comparison with the HC (11.31 mM) and the patient with GCO (11.51 mM), whereas there were no significant differences between the HC and the patient with GCO (arrows, Figure 3C,F,I).

Compared with the HC and GCO groups (P<0.05), the PCO group had a significantly higher level of Glu in the OGM, LPWM, and RPWM with mean GluCEST% values of 3.71%±1.75%, 3.56%±1.83%, and 3.60%±1.26%, along with mean [Glu] of 12.65±0.64, 12.60±0.62, and 12.57±0.52 mM, respectively. Compared with HCs, the Glu level in the OGM and bilateral PWM, including the GluCEST% value and [Glu], tended to be higher in patients with GCO, though the difference was not statistically significant (P>0.05). Data are listed in Table 2. Figure 4A,B showed the z-spectra and MTRasym curves of LPWM obtained from an HC (Figure 3A,B,C) and a patient with PCO (Figure 3G,H,I). On the MTRasym curves, the 3-ppm line corresponding to GluCEST was shown. We observed that GluCEST signal strength is higher for the patient with PCO than the HC.

Full table

Also, we compared GluCEST% values and [Glu] in the OGM, bilateral PWM, and SCC between HCs and TBI patients by using two independent t-tests. In comparison with HCs, TBI patients had a higher Glu level in the OGM and bilateral PWM, which may suggest that Glu tends to increase in acute TBI. However, the differences were statistically significant for GluCEST% values (P<0.05) but not for [Glu] (P>0.05). We did not observe any difference in either GluCEST% values or [Glu] for the SCC between HCs and TBI patients.
Figure 5A,B,C,D shows the correlation between MRS and GluCEST. Strong positive correlations were observed between GluCEST% value and [Glu] in the OGM (Figure 5A) (R2 =0.706, P<0.001), LPWM (Figure 5B) (R2 =0.864, P<0.001) RPWM (Figure 5C) (R2 =0.855, P<0.001), and SCC (Figure 5D) (R2 =0.899, P<0.001).

The ROC curves from MRS and CEST in the differentiation between GCO and PCO group are plotted in Figure 6A,B,C (OGM-ROC, LPWM-ROC, and RPWM-ROC). The MRS AUCs for the OGM, LPWM, and RPWM were 0.683 (95% CI, 0.48−0.88), 0.669 (95% CI, 0.47−0.86), and 0.663 (95% CI, 0.47−0.86), respectively. The GluCEST AUCs for the OGM, LPWM, and RPWM were 0.804 (95% CI, 0.64−0.97), 0.802 (95% CI, 0.64−0.96), and 0.774 (95% CI, 0.61−0.94), respectively. There were significant differences between the GluCEST and MRS AUCs in LPWM (P=0.040) and RPWM (P=0.047).

Discussion
In the current study, we found that both GluCEST% and [Glu] values significantly increased in several brain regions, which included the OGM and bilateral PWM, in the PCO group compared with GCO group and HCs. Our findings reflect a correlation between high Glu levels in the OGM and bilateral PWM and PCO, consistent with previously reported studies (6,7,18). In addition, in comparison with HCs, patients with acute mild-to-moderate TBI had significantly increased GluCEST% values of the OGM and bilateral PWM, suggesting a tendency for increased Glu in acute TBI, which agrees with previous MRS (6,7,30) and microdialysis studies (18).
TBI is a diffuse process consisting of many metabolic changes, particularly involving Glu, the most abundant excitatory neurotransmitter in the brain (19). Following TBI, Glu moving into the brain from the disruption of the blood-brain barrier and the dysfunction of Glu uptake due to decreased Glu transporter activity may contribute to increased Glu levels (19). Excessive accumulation of extracellular Glu causes excitotoxicity to the central nervous system neurons and plays a crucial role in the development of secondary events that contribute to expansion of the total volume of injury (19) and thus could explain the correlation between high Glu levels and PCO.
In the SCC, earlier reports focus on the change of other brain metabolites following TBI, such as N-acetylaspartate (NAA) and choline, but rarely mention Glu. In the present study, we observed that there was no significant difference in the SCC Glu level among the three groups, indicating that the OGM and bilateral PWM are more sensitive to the change of Glu level in the brain than SCC following TBI. The changes in other metabolites in the SCC may be more useful for the prediction of cognitive deficits (31).
Of note, our results show significantly increased Glu of the bilateral PWM only in patients with the PCO, which differs from earlier MRS reports showing elevated Glu concentration in patients with both good and poor outcome (6,7). These differences may be related to the criteria of grouping (MoCA vs. GOS) and the measurement of Glu concentration {[Glu] vs. Glx/total creatine (tCr) ratio}.
We further demonstrated a strong positive correlation between GluCEST% value and [Glu] measured by MRS. Since MRS data is specific to Glu concentration, this further suggests that the observed change in the GluCEST signal resulted from a change in Glu concentration. The above discussion shows that both GluCEST and MRS seem equally applicable for tracking the Glu changes, so we applied the ROC curve analysis to evaluate which one is better for outcome prediction. Based on the superior AUC of GluCEST compared to that of MRS, our study shows that GluCEST performs better than MRS in the prediction of cognitive outcome for TBI patients. Both techniques are important imaging modalities available to track the Glu changes in vivo noninvasively, but GluCEST imaging has multiple advantages over MRS, which account for our findings. GluCEST images Glu in vivo at much higher spatial resolution and has at least two orders of magnitude higher sensitivity compared to MRS (8), potentially allowing for more precise detection of Glu changes. Furthermore, mapping Glu with GluCEST could potentially improve the monitoring of regional Glu alterations (13).
Earlier studies have suggested that 3T MRI may have poor sensitivity because 3T MRI might not be fast enough for the rapid exchange rate of the Glu amine protons (8). To maximize the GluCEST signal, an MT-prepared GRE MRI sequence was used in the present study. Even though each MT saturation pulse only produces a minor increase in CEST effect, and many saturation steps have a cumulative effect, which is in line with earlier studies (21,32-34). Also, there is little distortion of the image using GRE readout at short TE. In the present study, the MT-prepared GRE MRI sequence had an advantage in clinical scans and could improve the evaluation of Glu alterations in the brain, as shown in earlier studies performed at 3T and higher field MRI (21,35).
In conclusion, our study proves that GluCEST at 3T is feasible for obtaining high-resolution maps of regional Glu in TBI patients. The variations in GluCEST% values from TBI patients observed in this study, coupled with the MRS data, prove that Glu levels in the OGM and bilateral PWM are increased in acute TBI and strongly correlate with the cognitive outcome at 1-month postinjury. These findings may suggest the importance of Glu in TBI along with the assessment of injury. Benefitting from higher spatial resolution and sensitivity compared to MRS, GluCEST may improve the accuracy of short-term outcome prediction. Furthermore, GluCEST has the potential to be a novel molecular neuroimaging approach for guiding therapeutic interventions, treatment trials, and medical decision aiming at preventing or minimizing the burden of secondary injury.
Acknowledgments
Funding: This work has received funding by the National Natural Science Foundation of China (Grant No. 81471730, Grant No. 31870981), Medical Research Foundation of Guangdong Province (Grant No. A2018361), and Grant for Key Disciplinary Project of Clinical Medicine under the Guangdong High-level University Development Program (Grant No. 002-18119101).
Footnote
Conflicts of Interest: The authors have no conflicts of interest to declare.
Ethical Statement: The study protocol was designed in line with the guidelines outlined in the Declaration of Helsinki and approved by the local institutional review board. After a complete description of the study was provided to each participant, informed written consent was obtained from each participant or legal guardian if patients were unable to supply consent before the study.
References
- Ghajar J. Traumatic brain injury. Lancet 2000;356:923-9. [Crossref] [PubMed]
- Zhang H, Wang W, Jiang S, Zhang Y, Heo HY, Wang X, Peng Y, Wang J, Zhou J. Amide proton transfer-weighted MRI detection of traumatic brain injury in rats. J Cereb Blood Flow Metab 2017;37:3422-32. [Crossref] [PubMed]
- Wylie GR, Freeman K, Thomas A, Shpaner M. OKeefe M, Watts R, Naylor MR. Cognitive Improvement after Mild Traumatic Brain Injury Measured with Functional Neuroimaging during the Acute Period. PLoS One 2015;10:e0126110. [Crossref] [PubMed]
- Marino S, Ciurleo R, Bramanti P, Federico A, De Stefano N. 1H-MR spectroscopy in traumatic brain injury. Neurocrit Care 2011;14:127-33. [Crossref] [PubMed]
- Friedman SD, Brooks WM, Jung RE, Chiulli SJ, Sloan JH, Montoya BT, Hart BL, Yeo RA. Quantitative proton MRS predicts outcome after traumatic brain injury. Neurology 1999;52:1384-91. [Crossref] [PubMed]
- Shutter L, Tong KA, Holshouser BA. Proton MRS in acute traumatic brain injury: role for glutamate/glutamine and choline for outcome prediction. J Neurotrauma 2004;21:1693-705. [Crossref] [PubMed]
- Shutter L, Tong KA, Lee A, Holshouser BA. Prognostic role of proton magnetic resonance spectroscopy in acute traumatic brain injury. J Head Trauma Rehabil 2006;21:334-49. [Crossref] [PubMed]
- Cai K, Haris M, Singh A, Kogan F, Greenberg JH, Hariharan H, Detre JA, Reddy R. Magnetic resonance imaging of glutamate. Nat Med 2012;18:302-6. [Crossref] [PubMed]
- Sun PZ, Xiao G, Zhou IY, Guo Y, Wu R. A method for accurate pH mapping with chemical exchange saturation transfer (CEST) MRI. Contrast Media Mol Imaging 2016;11:195-202. [Crossref] [PubMed]
- Wu R, Longo DL, Aime S, Sun PZ. Quantitative description of radiofrequency (RF) power-based ratiometric chemical exchange saturation transfer (CEST) pH imaging. NMR Biomed 2015;28:555-65. [Crossref] [PubMed]
- Huang D, Li S, Dai Z, Shen Z, Yan G, Wu R. Novel gradient echo sequence-based amide proton transfer magnetic resonance imaging in hyperacute cerebral infarction. Mol Med Rep 2015;11:3279-84. [Crossref] [PubMed]
- Davis KA, Nanga RP, Das S, Chen SH, Hadar PN, Pollard JR, Lucas TH, Shinohara RT, Litt B, Hariharan H, Elliott MA, Detre JA, Reddy R. Glutamate imaging (GluCEST) lateralizes epileptic foci in nonlesional temporal lobe epilepsy. Sci Transl Med 2015;7:309ra161. [Crossref] [PubMed]
- Haris M, Nath K, Cai K, Singh A, Crescenzi R, Kogan F, Verma G, Reddy S, Hariharan H, Melhem ER, Reddy R. Imaging of glutamate neurotransmitter alterations in Alzheimer's disease. NMR Biomed 2013;26:386-91. [Crossref] [PubMed]
- Walker-Samuel S, Ramasawmy R, Torrealdea F, Rega M, Rajkumar V, Johnson SP, Richardson S, Gonçalves M, Parkes HG, Arstad E, Thomas DL, Pedley RB, Lythgoe MF, Golay X. In vivo imaging of glucose uptake and metabolism in tumors. Nat Med 2013;19:1067-72. [Crossref] [PubMed]
- Meldrum BS. Glutamate as a neurotransmitter in the brain: review of physiology and pathology. J Nutr 2000;130:1007S-15S. [Crossref] [PubMed]
- Zhou Y, Danbolt NC. Glutamate as a neurotransmitter in the healthy brain. J Neural Transm (Vienna) 2014;121:799-817. [Crossref] [PubMed]
- Gopinath SP, Valadka AB, Goodman JC, Robertson CS. Extracellular glutamate and aspartate in head injured patients. Acta Neurochir Suppl 2000;76:437-8. [PubMed]
- Chamoun R, Suki D, Gopinath SP, Goodman JC, Robertson C. Role of extracellular glutamate measured by cerebral microdialysis in severe traumatic brain injury. J Neurosurg 2010;113:564-70. [Crossref] [PubMed]
- Yi JH, Hazell AS. Excitotoxic mechanisms and the role of astrocytic glutamate transporters in traumatic brain injury. Neurochem Int 2006;48:394-403. [Crossref] [PubMed]
- Guerriero RM, Giza CC, Rotenberg A. Glutamate and GABA imbalance following traumatic brain injury. Curr Neurol Neurosci Rep 2015;15:27. [Crossref] [PubMed]
- Shen Y, Xiao G, Shen Z, Zhang X, Tang X, Hu W, Zhang Z, Guan J, Wu R. Imaging of nuclear Overhauser enhancement at 7 and 3 T. NMR Biomed 2017. [Crossref] [PubMed]
- Teasdale G, Jennett B. Assessment of coma and impaired consciousness. A practical scale. Lancet 1974;2:81-4. [Crossref] [PubMed]
- Nasreddine ZS, Phillips NA, Bédirian V, Charbonneau S, Whitehead V, Collin I, Cummings JL, Chertkow H. The Montreal Cognitive Assessment, MoCA: a brief screening tool for mild cognitive impairment. J Am Geriatr Soc 2005;53:695-9. [Crossref] [PubMed]
- Zhang Z, Wang Y, Shen Z, Yang Z, Li L, Chen D, Yan G, Cheng X, Shen Y, Tang X, Hu W, Wu R. The Neurochemical and Microstructural Changes in the Brain of Systemic Lupus Erythematosus Patients: A Multimodal MRI Study. Sci Rep 2016;6:19026. [Crossref] [PubMed]
- Yang ZX, Huo SS, Cheng XF, Xu ZF, Cao Z, Zeng JX, Xiao YY, You KZ, Chen W, Liu YY, Wu RH. Quantitative multivoxel proton MR spectroscopy study of brain metabolites in patients with amnestic mild cognitive impairment: a pilot study. Neuroradiology 2012;54:451-8. [Crossref] [PubMed]
- Kim M, Gillen J, Landman BA, Zhou J, van Zijl PC. Water saturation shift referencing (WASSR) for chemical exchange saturation transfer (CEST) experiments. Magn Reson Med 2009;61:1441-50. [Crossref] [PubMed]
- Liu G, Song X, Chan KW, McMahon MT. Nuts and bolts of chemical exchange saturation transfer MRI. NMR Biomed 2013;26:810-28. [Crossref] [PubMed]
- Hanley JA, McNeil BJ. The meaning and use of the area under a receiver operating characteristic (ROC) curve. Radiology 1982;143:29-36. [Crossref] [PubMed]
- DeLong ER, DeLong DM, Clarke-Pearson DL. Comparing the areas under two or more correlated receiver operating characteristic curves: a nonparametric approach. Biometrics 1988;44:837-45. [Crossref] [PubMed]
- Yeo RA, Gasparovic C, Merideth F, Ruhl D, Doezema D, Mayer AR. A longitudinal proton magnetic resonance spectroscopy study of mild traumatic brain injury. J Neurotrauma 2011;28:1-11. [Crossref] [PubMed]
- Holshouser BA, Tong KA, Ashwal S. Proton MR spectroscopic imaging depicts diffuse axonal injury in children with traumatic brain injury. AJNR Am J Neuroradiol 2005;26:1276-85. [PubMed]
- Dixon WT, Hancu I, Ratnakar SJ, Sherry AD, Lenkinski RE, Alsop DC. A multislice gradient echo pulse sequence for CEST imaging. Magn Reson Med 2010;63:253-6. [PubMed]
- Dai Z, Ji J, Xiao G, Yan G, Li S, Zhang G, Lin Y, Shen Z, Wu R. Magnetization transfer prepared gradient echo MRI for CEST imaging. PLoS One 2014;9:e112219. [Crossref] [PubMed]
- Lin G, Zhuang C, Shen Z, Xiao G, Chen Y, Shen Y, Zong X, Wu R. APT Weighted MRI as an Effective Imaging Protocol to Predict Clinical Outcome After Acute Ischemic Stroke. Front Neurol 2018;9:901. [Crossref] [PubMed]
- Xiao G, Sun PZ, Wu R. Fast simulation and optimization of pulse-train chemical exchange saturation transfer (CEST) imaging. Phys Med Biol 2015;60:4719-30. [Crossref] [PubMed]

