

Motion correction of chemical exchange saturation transfer MRI series using robust principal component analysis (RPCA) and PCA
Introduction
Chemical exchange saturation transfer (CEST) MRI is an alternative contrast mechanism that indirectly detects biomolecules by probing their exchangeable protons with a frequency-specific saturation pulse. Through multiple chemical exchanges, the saturation signal transfers to bulk water and is amplified for detection (1). CEST MRI has been shown to be able to map certain dilute metabolites such as creatine (2), glucose (3,4), salicylic acid analogs (5), and changes in microenvironment properties, like temperature (6) and pH (7-9), which are promising in a host of applications in cancers and neurological diseases (10-20).
To observe the CEST effect, a series of images of the bulk water is acquired as a function of saturation frequency offsets (∆ω), called Z-spectra data. The most-commonly used CEST quantification method is asymmetry analysis on the magnetization transfer ratio (MTRasym) (21). MTRasym takes the difference between two saturation-weighted images at opposite offsets (+/−∆ω), then normalizes by S0 image (without saturation pulse applied), as described below:
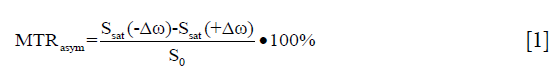
To achieve higher spectral resolution and sample adequate ∆ω’s of interest, acquisition of Z-spectra usually lasts several minutes. The inevitable motion of subjects, however, can seriously affect CEST contrast maps and quantification, especially for voxel-by-voxel analysis. Even if individual images are motion-free, any misalignments among CEST images can easily corrupt Z-spectra and MTRasym quantification by introducing signal variations (peaks or dips) that resemble those expected from the molecules of interest (22). The MTRasym image can also easily get distorted, usually due to the motion-induced misalignments among Ssat(+∆ω), Ssat(−∆ω), and the S0 image for normalization. Therefore, the application of a proper registration algorithm is critical for CEST analysis, directly affecting image quality and quantification (12,23-32).
However, image registration for Z-spectral image series imposes two challenges. Firstly, images at different Δω inherently possess variable signal intensity via CEST contrast, compromising intensity-based registration algorithms. To register images with varying intensities, the pair-wise approach is generally used with a dissimilarity metric such as the sum of squared difference (SSD), correlation coefficient (CC), and mutual information (MI) (33). Still, with such conventional strategies, it is difficult to distinguish intensity changes induced by CEST contrast and motion. Secondly, the selection of a reference image for the alignment of other images is an important step in the context of CEST analysis. Several previous studies have taken S0 image as the reference image (24-29). But, since the intrinsic contrast of S0 is considerably different from other saturated images, registration results are poor (32). For amide proton transfer (APT) imaging that is quantified by MTRasym(3.5 ppm), the 3D human brain data has suggested the use of a saturated image at 3.5 ppm as the registration reference can yield best quality (32). However, when different or multiple offsets are of interest, the selection of reference image(s) needs to be optimized again. Instead of a single reference image, one recent method generated a corresponding reference for each saturation image at ∆ω, using the low-rank approximation of the Z-spectral images, termed as LRAZ. Despite that the low-rank components containing less motion, LRAZ exploits singular value decomposition (SVD) and the level of separation between motion and CEST signal strongly depends on regularization parameters, which needs to be tuned in a heuristic manner (34). In addition to the above methods that registered CEST images post-acquisition, CEST imaging sequence can be modified by including navigators, enabling real-time corrections of motion, and shimming during acquisition (22).
Previously, dynamic contrast enhancement (DCE-) MRI has developed methods for distinguishing signal intensity changes due to contrast enhancement from those corresponding to motion. A progressive principal component registration method (PPCR) gradually removes motion for both liver and breast DCE-MRI (35,36). This method is based on the iterative use of principal component analysis (PCA) to create a synthetic reference series that is free from motion but preserves contrast enhancement. However, the ability of PCA to separate motion from contrast enhancement breaks down when the image series contains a large amount of motion. Another robust data decomposition registration algorithm (RDDR) separates contrast enhancement and motion by assuming that the sparse component is attributable to contrast changes and the low-rank is attributable to motion after applying robust principal component analysis (RPCA), allowing iterative re-alignment of the liver, small bowel, and prostate DCE-MRI (37). More recently, a robust non-rigid motion correction approach was proposed for myocardial perfusion MRI, which consists of RPCA and non-rigid image registration (38). However, DCE pharmacokinetics and CEST Z-spectra have different features. In DCE-MRI, the contrast agent directly changes tissue relaxation and causes significant and rapid variation of the signal. In CEST experiments, especially for the endogenous CEST, the variation in CEST signal is smooth when compared to motion which results in rapid signal variation. Based on this characteristic, CEST contrast is assumed to be separated from motion by RPCA. However, it is difficult for RPCA to differentiate these two perfectly, and residual motion needs to be further considered.
Herein, we introduce a two-stage motion correction approach specifically designed for Z-spectral image series, which consists of RPCA-based coarse registration and PCA-based refinement registration, together called “RPCA + PCA_R”. Our hypothesis is that RPCA + PCA_R allows for a robust capability in achieving accuracy registration for various motion scenarios of Z-spectral image series.
Methods
Theory
Registration scheme
Motion correction is conducted in a two-stage scheme (Figure 1). Coarse registration accounts for bulk motion, where the Z-spectral image series is decomposed by RPCA to robustly separate CEST contrast from motion, achieving to minimize motion component in the reference image. Then, refinement registration gradually removes the remaining small misalignments by using PCA for the iterative generation of a motionless reference series. To ensure registration quality, a quality check is finally performed.

Stage I: coarse registration
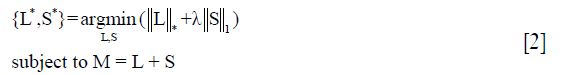
A matrix of vectorized images M can be decomposed into a sum of the sparse component (S) and the low-rank component (L) in the context of simultaneous image alignment (39). The portion of images that cannot be described by L is allocated to the S part. Hence, L can be interpreted as correlated information among images, which is not constant but rather smooth and global changes between frames, while S captures dynamic information introduced in each subject, which is rapid with local intensity changes. Such matrix decomposition can be solved by RPCA and formulated as an optimization problem to recover L and S from the input data (40):
where  denotes the nuclear norm (i.e., the sum of the matrix singular values) and
  denotes the l1-norm (i.e., the sum of the absolute values of the matrix). The trade-off parameter (λ) corresponds to rank of L: for high values, most information will appear in L with a large rank while S will be empty, and vice-versa. The optimal {L*,S*} can be efficiently computed through an augmented Lagrangian multiplier method using alternating direction approach (ADM) (41).
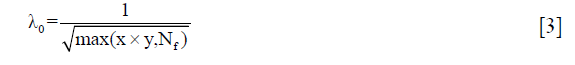
The information in the Z-spectral image series can be regarded as a combination of smooth CEST contrast changes and rapid motion variation. We hypothesize that RPCA decomposes the Z-spectral image series into L, corresponding to CEST contrast, and S, containing the motion. The Z-spectral image series with x×y voxels at Nf different ∆ω is converted to a (x·y by Nf) Casorati matrix M and then decomposed by RPCA with suitable λ. Next, a series of pair-wise registrations are performed, in which the average image of the low-rank series is used as reference for the whole input series, resulting in the coarse registered series having bulk motion eliminated. Specifically, to minimize the contribution of motion in the reference image, λ is adjusted experimentally so that most motion is incorporated into S. Alternatively, λ can be chosen independent of the application and the nature of data (Candès value, λ0) (40):
Stage II: refinement registration
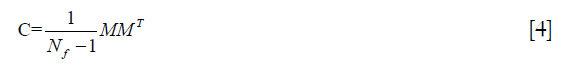
PCA is a common method to discover and exploit linear correlation in data (42). PCA linearly transforms the correlation input into a set of uncorrelated variables by orthogonal transformation, extracting principal components (PCs). The PC with larger variance is ranked higher, containing more data information. The image series post the coarse registration of RPCA is firstly transformed to a 2D matrix M (x·y by Nf), with its covariance matrix defined as:
C is eigenvalue decomposed, and the generated eigenvectors are sorted in descending order of the corresponding eigenvalue. Orthogonal matrix U, whose columns are eigenvectors, transforms the correlation input into uncorrelated data W:

where W contains PCs of the input. M can be approximately reconstructed using only the d highest ranked PCs’:

where Ud and Wd contain first d columns of U and W, respectively.
In coarse registration, it is difficult to optimize λ to correct for both large and small deformations simultaneously; thus, misalignments remain in the coarse registered series. However, the residual motion is slight and noise-like and assumed to appear in less significant PCs when compared with continuous CEST contrast which is more significant. Therefore, the PCA-based registration, similar to previous methods (35,36), has the ability to remove the residual motion efficiently by using a limited number of PCs that correspond to CEST contrast.
Each voxel in a coarse registered image is interpreted as a variable for the function describing the corresponding signal intensity along ∆ω as an observation. The coarse registered series is subject to PCA, looking for linear correlations between the voxels with regard to ∆ω and generating PCs. In the ith iteration, the first i PCs are used to create a synthetic motionless reference series, in a ∆ω-by-∆ω manner. Importantly, only the reference series is updated and refined in iterations, while the source images are always represented by the coarse registered series. This process is repeated until the d’s highest ranked PCs are included.
Quality check
Since motion-free Z-spectral signals are continuous and smooth in theory, we use the CC between the corrected saturation-weighted image and the average image at its two neighboring offsets to assess registration quality, defined as follows:
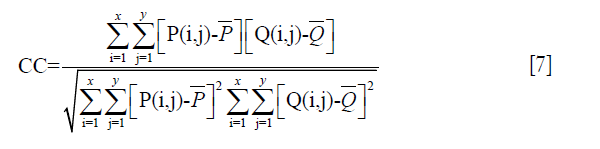
where x and y are the dimensions of the image.  and
and  denote the average intensities of the two comparison images, respectively. The closer the value of CC is to 1, the more similar the two images are, with the alert being raised when CC <0.9.
Registration details
In principle, any registration technique can be used in the proposed motion correction scheme. Herein, pair-wise rigid registration with SSD-based dissimilarity metric is exploited. For each stage, we used a MATLAB (MathWorks, Natick, MA, USA) custom function. An optimizer, based on built-in-function fminsearch, looks for the optimal solution that minimizes the dissimilarity metric. A multi-resolution strategy is used, in which the large deformations are corrected first, and finer deformations are corrected at higher levels. The number of resolution levels is set to 3. Bicubic interpolation is used to interpolate the images among rigid transformation.
Experiments
Phantom study
The phantom was prepared using NMR tubes of 1 mm in diameter. Salicylic Acid (SA) solutions were dissolved in 0.01M phosphate-buffered saline (PBS) at 6 concentrations (1.56, 3.12, 6.25, 12.5, 25, and 50 mM), producing a range of CEST contrast. Figure 2 illustrates the profile of the phantom, which includes 2 groups of samples at pH 6.8 and pH 7.4.

All experiments were performed on a Bruker 11.7 T vertical MRI scanner with a 15 mm birdcage for both excitation and signal detection. CEST MRI images were acquired using a continuous-wave (CW) saturation pulse, followed by a single-sliced rapid acquisition with relaxation enhancement (RARE) sequence (RARE factor =32). A total of 89 saturated images, which were the Z-spectral image series, were collected from −11 to 11 ppm [0.25 ppm step, tsat =3,000 ms, B1,sat =5.9 µT, repetition time (TR)/echo time (TE) =6,000 ms/4.5 ms]. The total scanning time for the Z-spectral image series was 18 min. The S0 image was collected at 40 ppm. A group of images was acquired by sweeping ∆ω from −1 to 1 ppm (0.05 ppm step) (tsat =500 ms, B1,sat =0.28 µT, and TR/TE =2,500 ms/4.5 ms) to generate the B0 map using WASSR (43), resulting in 3 min and 25 s of scanning. The other imaging parameters were as follows: field of view (FOV) =1.7×1.4 cm2, acquisition matrix size =128×64, slice thickness =1 mm.
In vivo study
All animal experiments were performed in accordance with the Johns Hopkins University Animal Care and Use Committee guidelines. A SCID/NCR mouse was xenografted intracranially to the striatum of the brain with 100,000 human glioblastoma cancer cells derived from patients (44,45). MR imaging was performed 6 weeks post-injection with the mouse anesthetized using 0.5–2% isoflurane prior to imaging. MR images were acquired with the RARE readout on a Bruker 11.7T horizontal MRI scanner, using a 23 mm birdcage transmit-receiver coil. The in vivo experiments used the same RARE sequence as that for the phantom study, but it was slightly modified given the different relaxation characteristics and offset frequencies of interest. A total of 49 Z-spectral images with ∆ω incremented from −6 to 6 ppm (0.25 ppm step) were collected using tsat =2,500 ms, B1,sat =2.4 µT, TR/TE =5,500 ms/11.1 ms, resulting in 9 min and 10 s of scanning. The S0 image at 40 ppm was collected. B0 inhomogeneity was corrected using WASSR (43), which were saturation images with a weak saturation pulse (B1,sat =0.5 µT, tsat =500 ms) sweeping from −1 to 1 ppm (0.1 ppm step) (TR/TE =2,000 ms/10.8 ms). The other imaging parameters were as follows: RARE factor =16, FOV =1.7×1.4 cm2, acquisition matrix size =96×64, slice thickness =1.2 mm.
Simulated motion
The statically acquired Z-spectral image series were seen as original data. To verify RPCA + PCA_R, each image was corrupted by random shifts and rotations to simulate rigid motion for tubes of phantom and in vivo mouse head. Motion under three patterns was applied to phantom data: normally distributed pseudo-random numbers with 0 mean and SD for shifts in x-direction and y-direction of 0.2 or 0.5 pixel, 0 mean and SD for rotation in the xy-plane of 0.1° or 0.3°, and combinations of different shifts and rotations. In vivo data was corrupted by motion under the other 3 patterns: 0 mean and 0.5 or 1 pixel SD for shifts, and 0.5° or 1° SD for rotations as well as their different combinations in normally distributed pseudo-random numbers. To assess the robustness of registration methods, the simulation of each motion pattern was repeated 10 times to obtain various motion scenarios between the image series.
Image processing
The original Z-spectral image series, as well as WASSR images, were first aligned using the proposed registration method, followed by the regular CEST processing flow which consists of the voxel-wised correction for B0 inhomogeneity, calculation of the MTRasym(∆ω) map, and the ROI-based Z-spectra analysis. For comparison, previous registration strategies using an explicit image as the reference of registration were also performed, termed as S0_R (using S0 image) (24) or Ssat_R which used saturated image Ssat(∆ω) (∆ω =+9.25 ppm for phantom and +3.5 ppm for in vivo) (32). In addition, to illustrate the advantage of combination of RPCA and PCA, registration was also exploited using either only RPCA-based method (RPCA_R) or only the PCA-based one (PCA_R). All the exploit correction schemes used the same registration core technique as described earlier in the session of ‘Registration details’.
All data processing was performed using custom-written scripts in Matlab 2016a. All statistical analyses were performed with Prism8 (GraphPad Software) with P<0.05 considered as statistically significant.
Evaluation of registration performance
To fully evaluate the changes of the entire Z-spectral image series due to motion, and after correction, we expanded the whole series to form a 2D offset-cut map, with the x-dimension representing the (selected) voxels of the Ssat image at a specific ∆ω and the y-dimension depicting the Z-spectrum of a specific voxel. The offset-cut map was then normalized by the average image of the whole series. The registration accuracy was quantitatively assessed using CC between the normalized offset-cut map of the data corrupted by motion (or after correction) and that of the original data. Furthermore, the CC for the MTRasym(∆ω) map was calculated to assess the registration effects between Ssat(+/−∆ω) images.
We also quantitatively compared Z-spectra and the MTRasym(∆ω) of particular regions of interest (ROIs), which were calculated from the original data, the motion-corrupted data, and the corrected data, using different methods in each data set. The residual Z-spectra referring to the original data, were also plotted to describe the deviation. For the phantom, the ROI was defined at the 25 mM pH 6.8 tube as shown in Figure 3. For the in vivo experiments, the ROI of tumor was defined by a 4 pixel ×5 pixel box at the tumor core, and a mirrored ROI of normal tissue at the contralateral hemisphere (marked on Figure 4).


Other qualitative assessments through direct visualization of different kinds of maps are detailed below:
- The offset-cut maps, which display both the oscillation of Z-spectra for a particular voxel and the signals for (selected) voxels on a particular Ssat(∆ω) image.
- The MTRasym(∆ω) maps, which exhibit the intensity and distribution of CEST contrast.
- The error maps, which depict the difference of MTRasym(∆ω) maps from original data.
Results
Phantom study
The performance of RPCA + PCA_R was first verified on a phantom. Firstly, we compared how different motion patterns affected the CEST contrast. The spatial distribution of SA tubes is shown in Figure 2A. The motion-corrupted MTRasym(9.25 ppm) maps displayed substantial errors, particularly at the edge of the tubes (Figure 2B,C). The form and degree of deformation affected the corruption of Z-spectral images, in which shift had a greater impact on motion corruption, and combined with rotation would worsen it (Figure 2D). Among the simulated patterns, the worst-case motion pattern was created by a combination of the maximum shift (0.5 pixel SD) and rotation (0.3° SD), resulting in the largest normalized root mean square error (NRMSE) to the original data (0.31). For this worst case, the saturation-weighted images were clearly misaligned (Figure S1), while the L components after RPCA decomposition contained less motion, and the S components had more obvious motion. Herein, the value of λ was set experimentally to generate a low rank of L (rank, 4–6) to minimize the motion component in the reference image. In refinement registration, PCA was repeated 2 or 3 times empirically; details of the parametric registration model for phantom studies are provided in Figure S2.


Figure 3 depicts the visual registration results of the phantom data corrupted by the simulated motion with the above-mentioned worst pattern. As seen in Figure 3A, the MTRasym analysis was corrupted completely by motion, and S0_R, Ssat_R, RPCA_R, and PCA_R removed part of the motion artifacts. However, residual misalignments still existed, causing MTRasym(9.25 ppm) maps to exhibit a distinct deviation from the original data (Figure 3B,C,D,E). Among all the methods, RPCA + PCA_R performed the best, reproducing the MTRasym(9.25 ppm) map with only a slight difference from the original one (Figure 3F).
We further performed a quantitative assessment of these methods. The motion-corrupted dataset used in Figure 5A and B was same as that in Figure 3. Compared with the original data, the motion-corrupted Z-spectrum contained false peaks and dips, which might have been affected by the different patterns of motion including the directions. The motion-induced oscillations were corrected at different levels by the 5 methods. The residual curve of the Z-spectrum suggested that RPCA + PCA_R produced the most similar and smooth Z-spectrum with reference to the original one, by excluding most of the wiggles (Figure 5A). Figure 5B summarizes the measured MTRasym(9.25 ppm) for multiple tubes, and the corrected values display a more linear relationship for the concentration over the range of 1.5 to 25 mM (pH 7.4) (46) when comparing to the motion-corrupted one. More specifically, the relationship regained by RPCA + PCA_R was closer to the original one. Figure 5C,D display the statistics of the CC between the MTRasym(9.25 ppm) maps of the data corrupted by motion (or with correction) and that of the original data, in addition to the CC for the whole Z-spectral image series in 10 repeated simulations (with the same motion pattern as that in Figure 3). All methods increased CC for both; however, CC for RPCA + PCA_R showed the most significant rise with small SD [0.90 for the MTRasym(9.25 ppm) map and 0.60 for the whole series].

In vivo study
RPCA + PCA_R was then tested in a mouse tumor-bearing brain model. As seen in Figure 6, the saturation-weighted images were markedly misaligned due to motion (M: 1st row). Post-RPCA decomposition, the low-rank components appeared static (L: 2nd row), while the S components had obvious motion (S: 3rd row).

Figure 7 displays the detailed manner of parameterizing the registration model for the same motion-corrupted in vivo data as that in Figure 6. The rank of L was plotted as a function of λ, indicating that a smaller λ corresponded to a lower rank of L (Figure 7A). To reduce the contribution of the motion in the reference image, λ was selected as a smaller value that distributed most motion component in S but kept some contrast in L. As seen in Figure 7B,C,D, the recomposed L with rank =3 or 4 provides distinction of Z-spectra between tumor and normal tissue, while with maintaining a relatively small motion component. When the rank >4, L demonstrates obvious motion with the offset-cut map displaying changed voxel locations among images at various ∆ω. Since the coarse registered series could be expressed as a linear combination of its first 3 principal eigenvalue images, the number of iterations using PCA was determined to be 3 (Figure 7E,F). The choices of λ for various motion patterns are shown in Table S1.


Full table
Figure 4 shows the registration results for in vivo data corrupted by the simulated large motion (1 pixel SD for shifts and 1° SD for rotations). The 1st row shows the offset-cut maps which expand the Z-spectra of voxels on the black dashed line in Figure 4A into a 2D map. The original data without misalignments among the Z-spectral images obtained an MTRasym(3.5 ppm) map with higher signal intensities in tumor and lower ones in normal tissue (Figure 4A). Due to the applied motion, the offset-cut map displays wiggles indicating location of voxels changed significantly among Z-spectral images, resulting in an MTRasym(3.5 ppm) map with a bright-dark pattern in normal tissue and changes of tumor shape and position (Figure 4B). S0_R, Ssat_R, RPCA_R, and PCA_R reduced misalignments; however, the offset-cut maps still exhibit jitters, while the MTRasym(3.5 ppm) error maps show visible signal variation and deformation of tumor (Figure 4C,D,E,F). RPCA + PCA_R eliminated the motion-induced interference, recovered the spatial location of voxels, and regained the analytical MTRasym(3.5 ppm) map (Figure 4G).
Figure 8 quantitatively summarizes the registration performance for the in vivo data. For the data corrupted by the simulated large motion, the Z-spectra of the tumor show that RPCA + PCA_R improved the corrupted Z-spectrum (the corrupted data was same as Figure 4) with only a slight difference from the original data, while other methods rendered obvious discrimination (Figure 8A). In 10 repeated simulations with the large motion pattern, the statistical results demonstrate that RPCA + PCA_R obtained the highest CC between the corrected MTRasym(3.5 ppm) map and that of the original data, among all the exploited methods (Figure 8B). This is also the case for the CC of the corrected whole Z-spectral image series (Figure 8C). The MTRasym(3.5 ppm) values for both tumor and normal tissue obtained by RPCA + PCA_R were closest to the original data with the smallest SD among the 10 repeated simulations. For PCA_R, the MTRasym(3.5 ppm) of normal tissue was also very close to the original data but with larger SD (Table 1). In small motion patterns, RPCA + PCA_R corrected the artificially added motion and achieved a similar registration performance as the bigger one (Figure 8D,E). Registration results can also be seen in Figure S3.


Full table

Discussion
In this study we proposed a novel registration scheme for the correction of misaligned images acquired during a CEST MRI scan, which first exploited RPCA decomposition for coarse registration, followed by a PCA-based refinement step, and a quality check module at the end. Compared with the 4 other methods, our RPCA + PCA_R allowed for more accurate correction of the Z-spectral images, with smaller MTRasym(∆ω) error maps and lower residual Z-spectra referring to the original data (Figures 3,5 for phantom and Figures 4,8 for in vivo). Among all the 5 exploited methods, the corrected Z-spectral image series by RPCA + PCA_R and the resulting MTRasym(∆ω) maps exhibit the highest CCs to the original ones. In particular, RPCA + PCA_R provided a robust correction under both large and small motion patterns of in vivo data in multiple repeats (Figure 8). Additionally, quality check module certified that the motion-corrected by RPCA + PCA_R was valid (Figure S4). The residual Z-spectra and MTRasym(∆ω) error maps after RPCA + PCA_R slightly deviated from the original data. This was mainly due to the interpolation during transformation of registration, which means the motion can in principle be corrected to a great amount, but slight discrimination might still arise.

In contrast to previous methods that used an explicit registration reference image, either S0 (24-29) or a specific saturated image Ssat(∆ω) (32), RPCA + PCA_R extracted the relative static low-rank component from the entire Z-spectral image series and used their averaged image as the registration reference. Results suggest that S0_R showed the worst registration between Ssat(+/–∆ω) images, which might be because S0 image intensities and contrast are different from saturated ones (32). Despite a better performance in correcting Ssat(+/–∆ω) images than that of S0_R, among all the 5 methods, Ssat_R exhibited the lowest CC between the corrected whole image series and the original static data. This indicates that the selection of a single saturated image as a registration reference is less robust, and may result in poor registration for images of other offsets in the CEST dataset.
The idea of decomposition of Z-spectral image series for separating CEST contrast from motion is similar to the previous LRAZ method (34). However, LRAZ registered each image to its corresponding low-rank one, with the quality of registration strongly depending on the choice of regularization parameters. RPCA-based registration had a similar principle but used the averaging of L as a reference, which enabled the improvement of robustness. PCA-based registration also corrected motion by attributing motion to less significant PCs. Both only RPCA- (RPCA_R)- and only PCA- (PCA_R)-based methods performed well in compensating for misalignments among entire image series in the phantom (Figure 3). This is presumably because motion-induced signal changes were smaller and faster compared with CEST contrast, and the separation was easier. However, neither RPCA_R nor PCA_R was unable to completely correct motion in vivo, or for the Ssat(+/–9.25 ppm) images in the phantom study. RPCA_R did not work well since λ was difficult to determine for accurately separating the CEST contrast from motion. As seen in Figure 7C,D, the recomposed L using a small λ still contained undifferentiated motion. For PCA_R, the larger motion was likely to appear in the first PCs, resulting in a synthetic image series with motion. Hence, to improve the robustness and effectiveness of registration, we chose a combination of RPCA and PCA, with PCA_R further correcting the residual motion after the coarse registration by RPCA_R.
Despite coarse registration not requiring a complete differentiation motion and CEST contrast, λ cannot be selected arbitrarily (Figure S5). An excessively small λ will lead to less information in L and generate a sparse reference image that differs significantly from the saturated ones, causing the failure of coarse registration as in S0_R. While a too large λ introduces too much motion into L, coarse registration will be less effective. Herein, to provide a motionless reference image for coarse registration, λ was adjusted experimentally to keep the most motion in S but some CEST contrast in L with sufficient information to distinguish different tissues. The optimization of λ will be further investigated, which may use the lineshape of the Z-spectrum obtained from a quantitative model as a constraint for RPCA to guide the information to be retained in the L or S components.

However, the hypothesis of coarse registration that CEST contrast appears in L while motion in S may be limited, specifically when continuous and periodical motion occurs. This limitation can be exploited in dynamic CEST MRI, where contrast enhancement seems to be rapid in comparison to motion. RPCA + PCA_R represents a scheme for the image series registration, which means that pair-wise registration in RPCA + PCA_R is exchangeable. Any other optimization algorithms, like group-wise registration (47-49), can be introduced to improve the performance of RPCA + PCA_R. Equally, any non-rigid registration methods can replace the rigid algorithm used in this study.
Realistic in vivo motion was not studied in this paper. Indeed, it is important to test our method by mimicking real motion scenarios. For example, some of the previous studies examined skeletal muscles under exercise with obvious motion involved but with relatively simple anatomy (34), while others used brain data with minor and random motion (32,50). As an initial study, we employed the well-studied brain tumor model with simulated random motion. Additionally, we included both large and small motion in different patterns with multiple repeats to prove the robustness and effectiveness of RPCA + PCA_R. We will further test the method in multiple realistic motion scenarios including brain and body imaging.
CEST MRI is still at the early stage that precedes widespread clinical application. Most existing preclinical data are acquired at high field, as well as a large portion of data on human subjects, used 2D single-slice sequences. Particularly, when multiple offsets on Z-spectra are of interest, 2D data are acquired first to shorten the scan time and to simplify the analysis. Therefore, in this study we focused on correcting the misalignments among 2D CEST images caused by in-plane rigid motion, similar to recent works by other groups (22,34). However, in cases where an image moves out of the imaging plane, our current method using 2D data may not work as well. Nevertheless, those images with unsuccessful correction will be captured by the quality check module (Figure 1), raising alerts for a manual check. Additionally, motion correction using RPCA and that using PCA has been successfully applied to a 3D dataset in DCE-MRI (36,37). Therefore, we are optimistic that our method can also be applicable for 3D CEST data, which will be the focus of our next work.
Acknowledgments
The authors would like to thank Dr. Chengyan Chu and Dr. Piotr Walczak at Johns Hopkins for their generous offering of a tumor-bearing mouse. The authors would also like to thank Dr. Nirbhay N. Yadav for help with improving the writing.
Funding: This work was supported by the National Natural Science Foundation of China (No. 61601364), the Key Laboratory of Radiomics and Intelligent Perception (No. 201805060ZD11CG44), and by the Postgraduate Independent Innovation Project of Northwest University (China) (Grant YZZ17180). The phantom data and in vivo data of the mouse were collected under the support of Johns Hopkins Radiology Britestar Award to Dr. Xiaolei Song.
Footnote
Conflicts of Interest: The authors have no conflicts of interest to declare.
Disclaimer: The content is solely the responsibility of the author and does not necessarily represent the official views of the funding agencies.
References
- Ward KM, Aletras AH, Balaban RS. A New Class of Contrast Agents for MRI Based on Proton Chemical Exchange Dependent Saturation Transfer (CEST). J Magn Reson 2000;143:79-87. [Crossref] [PubMed]
- Cai K, Singh A, Poptani H, Li W, Yang S, Lu Y, Hariharan H, Zhou XJ, Reddy R. CEST signal at 2 ppm (CEST@2ppm) from Z-spectral fitting correlates with creatine distribution in brain tumor. NMR Biomed 2015;28:1-8. [PubMed]
- Chan KWY, McMahon MT, Kato Y, Liu G, Bulte JWM, Bhujwalla ZM, Artemov D, van Zijl PCM. Natural D-glucose as a biodegradable MRI contrast agent for detecting cancer. Magn Reson Med 2012;68:1764-73. [Crossref] [PubMed]
- Walker-Samuel S, Ramasawmy R, Torrealdea F, Rega M, Rajkumar V, Johnson SP, Richardson S, Gonçalves M, Parkes HG, Årstad E, Thomas DL, Pedley RB, Lythgoe MF, Golay X. In vivo imaging of glucose uptake and metabolism in tumors. Nat Med 2013;19:1067. [Crossref] [PubMed]
- Song X, Walczak P, He X, Yang X, Pearl M, Bulte JWM, Pomper MG, McMahon MT, Janowski M. Salicylic acid analogues as chemical exchange saturation transfer MRI contrast agents for the assessment of brain perfusion territory and blood-brain barrier opening after intra-arterial infusion. J Cereb Blood Flow Metab 2016;36:1186-94. [Crossref] [PubMed]
- Zhang S, Malloy CR, Sherry AD. MRI thermometry based on PARACEST agents. J Am Chem Soc 2005;127:17572-3. [Crossref] [PubMed]
- Ward KM, Balaban RS. Determination of pH using water protons and chemical exchange dependent saturation transfer (CEST). Magn Reson Med 2000;44:799-802. [Crossref] [PubMed]
- Zhou J, Payen J-F, Wilson DA, Traystman RJ, van Zijl PCM. Using the amide proton signals of intracellular proteins and peptides to detect pH effects in MRI. Nat Med 2003;9:1085. [Crossref] [PubMed]
- Guo Y, Zhou IY, Chan S-T, Wang Y, Mandeville ET, Igarashi T, Lo EH, Ji X, Sun PZ. pH-sensitive MRI demarcates graded tissue acidification during acute stroke — pH specificity enhancement with magnetization transfer and relaxation-normalized amide proton transfer (APT) MRI. NeuroImage 2016;141:242-9. [Crossref] [PubMed]
- Sun PZ, Zhou J, Sun W, Huang J, van Zijl PCM. Detection of the Ischemic Penumbra Using pH-Weighted MRI. J Cereb Blood Flow Metab 2007;27:1129-36. [Crossref] [PubMed]
- Sun PZ, Cheung JS, Wang E, Lo EH. Association between pH-Weighted Endogenous Amide Proton Chemical Exchange Saturation Transfer MRI and Tissue Lactic Acidosis during Acute Ischemic Stroke. J Cereb Blood Flow Metab 2011;31:1743-50. [Crossref] [PubMed]
- Tietze A, Blicher J, Mikkelsen IK, Østergaard L, Strother MK, Smith SA, Donahue MJ. Assessment of ischemic penumbra in patients with hyperacute stroke using amide proton transfer (APT) chemical exchange saturation transfer (CEST) MRI. NMR Biomed 2014;27:163-74. [Crossref] [PubMed]
- Zaiss M, Xu J, Goerke S, Khan IS, Singer RJ, Gore JC, Gochberg DF, Bachert P. Inverse Z-spectrum analysis for spillover-, MT-, and T1-corrected steady-state pulsed CEST-MRI – application to pH-weighted MRI of acute stroke. NMR Biomed 2014;27:240-52. [Crossref] [PubMed]
- Davis KA, Nanga RPR, Das S, Chen SH, Hadar PN, Pollard JR, Lucas TH, Shinohara RT, Litt B, Hariharan H, Elliott MA, Detre JA, Reddy R. Glutamate imaging (GluCEST) lateralizes epileptic foci in nonlesional temporal lobe epilepsy. Sci Transl Med 2015;7:309ra161. [Crossref] [PubMed]
- Jones CK, Schlosser MJ, van Zijl PCM, Pomper MG, Golay X, Zhou J. Amide proton transfer imaging of human brain tumors at 3T. Magn Reson Med 2006;56:585-92. [Crossref] [PubMed]
- Jia G, Abaza R, Williams JD, Zynger DL, Zhou J, Shah ZK, Patel M, Sammet S, Wei L, Bahnson RR, Knopp MV. Amide proton transfer MR imaging of prostate cancer: a preliminary study. J Magn Reson Imaging 2011;33:647-54. [Crossref] [PubMed]
- Zhou J, Lal B, Wilson DA, Laterra J, van Zijl PCM. Amide proton transfer (APT) contrast for imaging of brain tumors. Magn Reson Med 2003;50:1120-6. [Crossref] [PubMed]
- Banerjee SR, Song X, Yang X, Minn I, Lisok A, Chen Y, Bui A, Chatterjee S, Chen J, van Zijl PCM, McMahon MT, Pomper MG. Salicylic Acid-Based Polymeric Contrast Agents for Molecular Magnetic Resonance Imaging of Prostate Cancer. Chemistry 2018;24:7235-42. [Crossref] [PubMed]
- Monaco EA 3rd, Tempel ZJ, Friedlander RM. In Vivo Chemical Exchange Saturation Transfer Imaging Allows Early Detection of a Therapeutic Response in Glioblastoma. Neurosurgery 2014;75:N23-5.
- Haris M, Singh A, Mohammed I, Ittyerah R, Nath K, Nanga RPR, Debrosse C, Kogan F, Cai K, Poptani H, Reddy D, Hariharan H, Reddy R. In vivo Magnetic Resonance Imaging of Tumor Protease Activity. Sci Rep 2014;4:6081. [Crossref] [PubMed]
- Zhou J, van Zijl P. Chemical exchange saturation transfer imaging and spectroscopy. Prog Nucl Magn Reson Spectrosc 2006;48:109-36. [Crossref]
- Simegn GL, Van der Kouwe AJW, Robertson FC, Meintjes EM, Alhamud A. Real-time simultaneous shim and motion measurement and correction in glycoCEST MRI using double volumetric navigators (DvNavs). Magn Reson Med 2019;81:2600-13. [Crossref] [PubMed]
- Zhou J, Zhu H, Lim M, Blair L, Quinones-Hinojosa A, Messina SA, Eberhart CG, Pomper MG, Laterra J, Barker PB, van Zijl PCM, Blakeley JO. Three-dimensional amide proton transfer MR imaging of gliomas: Initial experience and comparison with gadolinium enhancement. J Magn Reson Imaging 2013;38:1119-28. [Crossref] [PubMed]
- Tee YK, Harston GWJ, Blockley N, Okell TW, Levman J, Sheerin F, Cellerini M, Jezzard P, Kennedy J, Payne SJ, Chappell MA. Comparing different analysis methods for quantifying the MRI amide proton transfer (APT) effect in hyperacute stroke patients. NMR Biomed 2014;27:1019-29. [Crossref] [PubMed]
- Hua J, Jones CK, Blakeley J, Smith SA, van Zijl PCM, Zhou J. Quantitative description of the asymmetry in magnetization transfer effects around the water resonance in the human brain. Magn Reson Med 2007;58:786-93. [Crossref] [PubMed]
- Jones CK, Polders D, Hua J, Zhu H, Hoogduin HJ, Zhou J, Luijten P, van Zijl PCM. In vivo three-dimensional whole-brain pulsed steady-state chemical exchange saturation transfer at 7 T. Magn Reson Med 2012;67:1579-89. [Crossref] [PubMed]
- Jones CK, Huang A, Xu J, Edden RAE, Schär M, Hua J, Oskolkov N, Zacà D, Zhou J, McMahon MT, Pillai JJ, van Zijl PCM. Nuclear Overhauser enhancement (NOE) imaging in the human brain at 7T. NeuroImage 2013;77:114-24. [Crossref] [PubMed]
- Scheidegger R, Wong ET, Alsop DC. Contributors to contrast between glioma and brain tissue in chemical exchange saturation transfer sensitive imaging at 3Tesla. NeuroImage 2014;99:256-68. [Crossref] [PubMed]
- Tee YK, Donahue MJ, Harston GWJ, Payne SJ, Chappell MA. Quantification of amide proton transfer effect pre- and post-gadolinium contrast agent administration. J Magn Reson Imaging 2014;40:832-8. [Crossref] [PubMed]
- Togao O, Yoshiura T, Keupp J, Hiwatashi A, Yamashita K, Kikuchi K, Suzuki Y, Suzuki SO, Iwaki T, Hata N, Mizoguchi M, Yoshimoto K, Sagiyama K, Takahashi M, Honda H. Amide proton transfer imaging of adult diffuse gliomas: correlation with histopathological grades. Neuro Oncol 2014;16:441-8. [Crossref] [PubMed]
- Sakata A, Okada T, Yamamoto A, Kanagaki M, Fushimi Y, Okada T, Dodo T, Arakawa Y, Schmitt B, Miyamoto S, Togashi K. Grading glial tumors with amide proton transfer MR imaging: different analytical approaches. J Neurooncol 2015;122:339-48. [Crossref] [PubMed]
- Zhang Y, Heo HY, Lee DH, Zhao X, Jiang S, Zhang K, Li H, Zhou J. Selecting the reference image for registration of CEST series. J Magn Reson Imaging 2016;43:756-61. [Crossref] [PubMed]
- Rivaz H, Karimaghaloo Z, Fonov VS, Collins DL. Nonrigid registration of ultrasound and MRI using contextual conditioned mutual information. IEEE Trans Med Imaging 2014;33:708-25. [Crossref] [PubMed]
- Wech T, Kostler H. Robust motion correction in CEST imaging exploiting low-rank approximation of the z-spectrum. Magn Reson Med 2018;80:1979-88. [Crossref] [PubMed]
- Melbourne A, Atkinson D, White MJ, Collins D, Leach M, Hawkes D. Registration of dynamic contrast-enhanced MRI using a progressive principal component registration (PPCR). Phys Med Biol 2007;52:5147-56. [Crossref] [PubMed]
- Melbourne A, Hipwell J, Modat M, Mertzanidou T, Huisman H, Ourselin S, Hawkes DJ. The effect of motion correction on pharmacokinetic parameter estimation in dynamic-contrast-enhanced MRI. Phys Med Biol 2011;56:7693-708. [Crossref] [PubMed]
- Hamy V, Dikaios N, Punwani S, Melbourne A, Latifoltojar A, Makanyanga J, Chouhan M, Helbren E, Menys A, Taylor S, Atkinson D. Respiratory motion correction in dynamic MRI using robust data decomposition registration - Application to DCE-MRI. Med Image Anal 2014;18:301-13. [Crossref] [PubMed]
- Scannell CM, Villa ADM, Lee J, Breeuwer M, Chiribiri A. Robust non-rigid motion compensation of free-breathing myocardial perfusion MRI data. IEEE Transactions on Medical Imaging 2019;38:1812-20. [Crossref] [PubMed]
- Peng Y, Ganesh A, Wright J, Xu W, Ma Y. editors. RASL: Robust alignment by sparse and low-rank decomposition for linearly correlated images. 2010 IEEE Computer Society Conference on Computer Vision and Pattern Recognition; 2010. 13-18 June 2010.
- Candès EJ, Li X, Ma Y, Wright J. Robust principal component analysis? Journal of the ACM 2011;58:1-37. [Crossref]
- Yuan X, Yang J. Sparse and low-rank matrix decomposition via alternating direction methods automation and remote control. 2009.
- Jolliffe I. Principal Component Analysis. Springer: New Work, 2002.
- Kim M, Gillen J, Landman BA, Zhou J, van Zijl PC. Water saturation shift referencing (WASSR) for chemical exchange saturation transfer (CEST) experiments. Magn Reson Med 2009;61:1441-50. [Crossref] [PubMed]
- Sun P, Xia S, Lal B, Eberhart CG, Quinones-Hinojosa A, Maciaczyk J, Matsui W, Dimeco F, Piccirillo SM, Vescovi AL, Laterra J. DNER, an epigenetically modulated gene, regulates glioblastoma-derived neurosphere cell differentiation and tumor propagation. Stem cells (Dayton, Ohio) 2009;27:1473-86. [Crossref] [PubMed]
- Ying M, Wang S, Sang Y, Sun P, Lal B, Goodwin CR, Guerrero-Cazares H, Quinones-Hinojosa A, Laterra J, Xia S. Regulation of glioblastoma stem cells by retinoic acid: role for Notch pathway inhibition. Oncogene 2011;30:3454-67. [Crossref] [PubMed]
- Ali MM, Liu G, Shah T, Flask CA, Pagel MD. Using two chemical exchange saturation transfer magnetic resonance imaging contrast agents for molecular imaging studies. Acc Chem Res 2009;42:915-24. [Crossref] [PubMed]
- Liu X, Niethammer M, Kwitt R, McCormick M, Aylward S, editors. Low-Rank to the Rescue – Atlas-Based Analyses in the Presence of Pathologies. Medical Image Computing and Computer-Assisted Intervention – MICCAI 2014. Cham: Springer International Publishing, 2014.
- Wachinger C, Navab N. Simultaneous Registration of Multiple Images: Similarity Metrics and Efficient Optimization. IEEE Trans Pattern Anal Mach Intell 2013;35:1221-33. [Crossref] [PubMed]
- Huizinga W, Poot DH, Guyader JM, Klaassen R, Coolen BF, van Kranenburg M, van Geuns RJ, Uitterdijk A, Polfliet M, Vandemeulebroucke J, Leemans A, Niessen WJ, Klein S. PCA-based groupwise image registration for quantitative MRI. Med Image Anal 2016;29:65-78. [Crossref] [PubMed]
- Zaiss M, Herz K, Deshmane A, Kim M, Golay X, Lindig T, Bender B, Ernemann U, Scheffler K. Possible artifacts in dynamic CEST MRI due to motion and field alterations. J Magn Reson 2019;298:16-22. [Crossref] [PubMed]

