

Reliability evaluation on weighted graph metrics of fNIRS brain networks
Introduction
The application of graph theory to brain networks has proved great potential in investigating network organizations of the human brain (1,2). A variety of neuroimaging and neurophysiological techniques (e.g., structural MRI, diffusion MRI, functional MRI and electroencephalography/magnetoencephalography) have consistently observed the brain to be organized into a “small-world” and modular network structure, making it efficient in local information processing and global information integration (3-5).
Functional near-infrared spectroscopy (fNIRS) is an emerging neuroimaging technology with a lot of advantages, e.g., low cost, high portability, large motion robustness and friendly ecological validity. With whole-brain fNIRS imaging data, many studies have demonstrated that the intrinsic characteristics of human brain networks, such as small-world efficiency, modularity and highly connected hubs, can also be revealed by resting fNIRS imaging data. The reliability of graphic metrics of fNIRS brain networks were acceptable, e.g., with fair to excellent reliability level, which makes fNIRS imaging-based technique be convincingly applied to the developmental and clinical neuroscience studies (6-8). The evaluation of stability and reproducibility of fNIRS brain network showed that the duration of the fNIRS signal scanning is related to stable and reproducible functional brain network features, e.g., stable, reproducible and reliable brain functional connectivity and topological network properties can be obtained after 1 and 5 min of fNIRS signal acquisition, respectively (9,10). These methodological researches provide fundamental evidences to support the feasibility and reliability as using fNIRS imaging technique for human brain network studies. Furthermore, for the application study, researchers also revealed that fNIRS imaging data can characterize brain network changes during development from children to adults (11). For instance, Cai et al. pointed out that the properties of small-worldness and modularity were not significantly different across development, but global and local efficiency showed important developmental changes over development (11). Recently, Li et al. showed that the children with autism spectrum disorders (ASD) had decreased network efficiency compared to healthy controls, and the ASD children with a relatively higher level of autistic behaviors showed much lower network efficiency (12). These accumulated researches suggest that the emerging fNIRS imaging technique has a great potential to be used to explore development and changes of the human brain network in future research.
However, it needs to point out that the current brain network studies were mainly based on binary networks and constructed graphic network by setting each edge as 0 (under the threshold) or 1 (above the threshold). As such, the binary network is of relatively simple calculation and easy to understand. However, compared to binary network, the weighted network (as another important network model), was constructed by calculating magnitudes of correlational or causal interactions between time series (2). The weighted network has better performance in filtering the influence of weak and potentially non-significant links (13). But it remains largely unknown whether the weighted network metrics derived from fNIRS imaging data are TRT reliable or not.
Thus, in this study, we conducted a comprehensive assessment of the TRT reliability of weighted network metrics of fNIRS brain networks. The data was a group of healthy young adults over two sessions with a 20-minute interval between sessions. For each participant, we constructed a weighted functional networks by computing temporal correlations between the time series of pairs of channels. We further analyzed global network metrics and regional nodal metrics using graph-theoretical approaches. Finally, intraclass correlation coefficients (ICC) were calculated to assess the TRT reliability of these network metrics. The human brain weighted network where each connection above the threshold is unique and retains its primary feature.
Methods
Subject and protocol
The data was same to our previous study of reliability evaluation of binary network (6). Twenty-one healthy right-handed subjects aged 21–27 years old (17 male, average age: 24.5) were recruited in this study. All subjects were undergraduate students that came from Beijing Normal University. This study was supported by the Review Board at the State Key Laboratory of Cognitive Neuroscience and Learning, Beijing Normal University, and informed consent form was acquired from each participate ahead of the experiment. All participants can quit the test at any time if they felt uncomfortable. Two eleven-minute of resting-state fNIRS scanning were carried out on all participates. The scanning duration was ~20 minutes. During fNIRS data acquisition, each subject was instructed to sit in the chair quietly and keep his/her eyes closed without falling asleep and movements.
Data acquisition and preprocessing
A continuous wave (CW) near infrared optical imaging system (CW6, TechEn Inc., MA, USA) was adopted to collect the fNIRS data. There were 12 laser sources and 24 detectors in this system that constituted 46 different measurement channels to cover almost the whole head, including the frontal, temporal, parietal and occipital lobes. The source-detector distance was 3.2 cm. The arrangement of the probes was based on the international 10–20 system of electrode placement with the external auditory canals and vertex of each participant as placemark, and the positions were measured at both scanning sessions to confirm accordance location. Figure 1 showed the schematic diagram of the probe array layout. Of note, the instrument generated two wavelengths of near-infrared light (690 and 830 nm) and measured time courses of concentration changes in both oxyhemoglobin (HbO) and deoxyhemoglobin (HbR) for all measurement channels. The sampling rate for the optical signal was set to 25 Hz.

Data processing
Ten-minute stable signal was extracted from raw hemodynamic time course for each participant. Similar to our previous studies (6,14), band-pass filtering with cutoff frequencies of 0.009 and 0.08 Hz was used to extract neural activity signal and meantime to reduce the effects of non-neural signals (e.g., respiratory and cardiac noises) (15-17). We further adopted independent component analysis (ICA) to reduce the influence of head motion and superficial noise in neuronal activity signal. The detailed information can be found in the series resting-state fNIRS studies (6,18,19) in our groups. Three subjects were excluded due to poor contact between the probe and scalp, leaving 18 subjects in this study for the further network analysis.
Weighted network construction
Nodes and edges are two basic elements of a weighted network. In fNIRS study, the nodes were defined as measurement channels and edges were defined as functional connectivity between nodes. In weighted network, functional connectivity was quantified by computing Pearson correlation coefficients for the time series between pairs of nodes. This procedure generated a 46×46 correlation matrix for each subject. The correlation matrix was thresholded at sparsity ranging from 0.01–0.5 at an interval of 0.01 to obtain a series of weighted networks. For each weighted network, the weights of the edges were equal to the absolute connectivity strengths, and the smaller than the designed thresholds were set to 0 (Figure 2).

Weighted network analysis
Global network metrics and regional nodal metrics were calculated for each thresholded weighted network, respectively. The global network metrics characterized global topological characteristics of the whole-brain network and the regional nodal network metrics descripted regional properties of the whole-brain network. The global network metrics included small-world properties (clustering coefficient, Cp, characteristic path length, Lp, normalized clustering coefficient, γ, and normalized characteristic path length, λ and small-world index, σ), efficiency parameters (global efficiency, Eglob, and local efficiency, Eloc), hierarchy (β) and modularity (Q). The regional nodal network metrics included nodal degree (Knod), nodal efficiency (Enod) and nodal betweenness (Nbc).
Test-retest (TRT) reliability evaluation
We used ICC to assess the TRT reliability of the global and local metrics of weighted brain networks (20). The ICC was calculated according to the following equation:
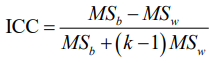
where MSb is between-subject variance, MSw is within-subject variance and k is the number of the repeated measurements (20). For each measure of the weighted network, the ICC value was calculated directly according to quantitative values of 18 pairs of network metrics across session 1 and session 2. Area under the curve (AUC) of the sparsity: 0.1–0.5 (interval =0.01) were used as measurements to evaluate ICCs of global and local metrics. All reliability indices investigated above were evaluated according to the criteria that ICC value from 0 to 0.25 indicates poor reliability; 0.25 to 0.4 indicates low reliability, 0.4 to 0.6 indicates fair reliability; 0.6 to 0.75 indicates good reliability and 0.75 to 0.1 indicates excellent reliability (21,22). Obviously, for any metric, if the between-subject variance is larger than the within-subject variance, the ICC values will be negative. This kind of situation is impossible in theory (23), and the reason for negative values is still unclear (24). So, we set the negative values to zero as generally suggested (18,19).
Results
TRT reliability of global network metrics
In the present study, individual networks were constructed at the same sparsity level by applying subject-specific correlation thresholds to individual correlation matrices. Sparsity threshold ensures all resultant networks to have comparable topological structures of the same number of edges. Figure 3 showed the TRT reliability of these nine global network metrics over the sparsity range of 0.01 to 0.5 with 0.01 as interval. Generally, most global network metrics exhibited fair to excellent reliability, irrespective of the ICC calculated from HbO or HbR signals. For example, the clustering coefficient, characteristics path length, global efficiency and local efficiency showed excellent reliability level across wide threshold range. Meanwhile, it was also noticed that the reliability of the network metrics displayed obvious differences even if at the same sparsity thresholds.

Furthermore, we calculated the AUC of each network measure to test significant differences in each metric across subjects between sessions. The results were shown in Table 1. These nine global network measures have not shown significantly different (paired t-tests, P>0.05, Table 1), suggesting a high similarity for global network measures between sessions at the individual level. We also used the AUC of each metric to calculate the reliability index (Figure 4). For both HbO and HbR signals, all network metrics consistently exhibited fair to excellent reliability.

Full table

TRT reliability of nodal metrics
The nodal reliability of degree, efficiency and betweenness were shown in Figure 5. These measures varied depending on the sparsity threshold values. Obviously, the ICC values of nodal degree and nodal efficiency exhibited very similar patterns and the reliability was better than that of nodal betweenness for both HbO and HbR signal. It was also found that almost all nodes exhibited fair to excellent reliability at most sparsity threshold values (e.g., from 0.01 to 0.5). Specifically, for nodal degree and nodal efficiency, the metric reliability was similar to each other for both HbO and HbR signals, and the reliability also exhibited better performance than that from nodal betweenness. Figure 6 shows the distribution of nodal metric reliability over total 46 channels on the brain schematic diagram using AUC as a measurement. For both HbO and HbR, most of these nodes showed fair to excellent reliability on nodal degree and nodal efficiency. The reliability of nodal betweenness was relatively much poorer or lower at most nodes compared to that in nodal degree and efficiency. We further used a two-factor repeated measures ANOVA to evaluate the influence of different nodal metrics (degree, efficiency and betweenness) and different signals (HbO, HbR) on nodal reliability. Threshold-independent measure AUC was used to carry out the statistical analysis. The results demonstrated a significant main effect of nodal metrics [F (2, 90)=218.66, P<0.0001] (Figure 7). And there was also not significant interaction between the nodal metrics and different concentration signals. These findings suggested that HbO and HbR signals possibly have similar performance on weighted network properties. The results of post hoc pairwise comparisons indicated that reliability of nodal betweenness was significantly lower than nodal degree and nodal efficiency both for HbO and HbR signals (P<0.0001).


Discussion
Previous study had verified the feasibility and reliability of combining resting-state fNIRS and graph theory to assess the topological organization of binary brain network (14). In this study, we specifically evaluate the TRT reliability of weighted fNIRS brain network. We constructed weighted networks at several thresholds ranging from 0.01 to 0.5 (interval =0.01). Based on the constructed network, we calculated nine global network metrics including small-worldness, global and local efficiency, modularity and hierarchy and three nodal metrics including nodal degree, nodal efficiency and nodal betweenness. Then we evaluated the reliability of these metrics using the threshold-independent index AUC to show the reliability of each metric.
Previous studies showed that most of these global network metrics and two of these nodal metrics (i.e., nodal degree and nodal efficiency) exhibited great reliability at a number of thresholds. For those studies, the authors mainly used binary networks rather than weighted networks to evaluate the TRT reliability of graph metrics. The weighted graph metrics was more and more popular in recent brain organization network researches. The weights in anatomical networks may represent the size, density, or coherence of anatomical tracts, and in functional and effective networks it may represent respective magnitudes of correlational or causal interactions which can not be neglected (2). And weighted networks usually focuses on somewhat different and complementary aspects of network organization and may be especially useful in filtering the influence of weak and potentially non-significant links (13). However, for fNIRS study, there remains largely unknown how the TRT reliability of topological organization of weighted network. In this study, we found that almost all global metrics exhibited fair to excellent reliability at most sparsity thresholds ranging from 0.01 to 0.5 except λ for HbO data and λ, σ, Q and β showed very poor reliability at low thresholds (sparsity <0.1) for HbR data. The explanation of poor ICC value for HbR data is that the metric λ (normalized characterized path length: index for small-worldness) may not have practical meaning in weighted network. Latora, Marchiori (25) had proposed global efficiency and local efficiency in weighted network as replacement of characteristic path length and clustering coefficient respectively in binary network because characteristic path length and clustering coefficient were used to examine small-worldness based on the hypothesis that the generic graph G is assumed to be unweighted, simple, sparse and connected (26). And for HbR data, we can infer that the sparsity threshold was too low to contain enough significant edges (neglect of lots of meaningful connection) so that several global metrics showed poor reliability. Then we used the threshold-independent index AUC to present the reliability. We found that for HbO data, except for λ, all global metrics exhibited fair to excellent reliability as expected, but for HbR data, the ICC values demonstrated very unbalanced distribution of which λ, σ, and Q exhibited bad reliability but others exhibited relatively good reliability. Notably, Cp, Lp and Eloc, Eglob demonstrated very similar reliability pattern which is consistent with the initial proposed theory of small-worldness in weighted network (25). A paired t-test showed the similarity of nine global network metrics both for HbO and HbR signals. And we also calculated the reliability of nodal network metrics from which we can see that almost all nodes exhibited fair to excellent reliability for nodal degree and nodal efficiency at nearly all sparsity thresholds ranging from 0.01 to 0.5 (interval =0.01). On the contrary, nodal betweenness exhibited poor reliability at most thresholds. In order to numerically evaluate the reliability of nodal reliability, we calculated the AUC of all sparsity thresholds. The results showed very similar ICC values to the conclusion from the reliability at the whole thresholds that nodal degree and nodal efficiency exhibited relatively great reliability and on the contrary nodal betweenness had poor reliability. We can also see from the whole figure that the results from the HbR signal exhibited higher reliability compared to HbO signal. And the statistical analysis also proved that betweenness was not an effective measurement for discussing brain network organization.
In addition, our results of weighted network also showed relatively high network metrics reliability in most network metrics, such as Cp and Lp, for both HbO and HbR signals. These findings were also consistent with our previous investigation of network metric reliability from binary network (27). Furthermore, we also found that there were differences in the network metric reliability between weighted network and binary network. For example, the λ in the weighted network performed relatively worse performance in HbO signal, whereas that exhibited relatively high reliability (i.e., excellent level) in the binary network for two hemoglobin concentration signals. Indeed, weighted networks could characterize network topology more precisely and detect more subtle network topological changes than binary networks due to the consideration of connectivity strength (25,28,29). However, this is not necessary to mean better reliability for weighted networks since the possibility that weighted networks may introduce simultaneously extra noise or overly model individual specific details. All these may lead to more within-subject variance (i.e., variance across scans) and thus lower reliability. This suggests that the observed reliability derived from actual R-fNIRS data were affected by various factors, not a single factor of numerical changes in functional connectivity.
Our findings confirmed the TRT reliability of combining fNIRS and graph theory to evaluate the topological organization of weighted brain. We also demonstrated that most global and local network metrics exhibited good reliability especially for small-worldness and efficiency in a weighted network which can be very beneficial to further studies.
Acknowledgments
Funding: This study was supported by the Natural Science Foundation of China (Grant nos. 81571755, 81761148026, 31521063).
Footnote
Conflicts of Interest: The authors have no conflicts of interest to declare.
Ethical Statement: This study was supported by the Review Board at the State Key Laboratory of Cognitive Neuroscience and Learning, Beijing Normal University, and informed consent form was acquired from each participate ahead of the experiment.
References
- Bullmore E, Sporns O. Complex brain networks: graph theoretical analysis of structural and functional systems. Nat Rev Neurosci 2009;10:186-98. [Crossref] [PubMed]
- Rubinov M, Sporns O. Complex network measures of brain connectivity: Uses and interpretations. Neuroimage 2010;52:1059-69. [Crossref] [PubMed]
- Achard S, Bullmore E. Efficiency and cost of economical brain functional networks. PLoS Comput Biol 2007;3:e17. [Crossref] [PubMed]
- Micheloyannis S, Pachou E, Stam CJ, Vourkas M, Erimaki S, Tsirka V. Using graph theoretical analysis of multi channel EEG to evaluate the neural efficiency hypothesis. Neurosci Lett 2006;402:273-7. [Crossref] [PubMed]
- van den Heuvel MP, Stam CJ, Boersma M, Pol HE. Small-world and scale-free organization of voxel-based resting-state functional connectivity in the human brain. Neuroimage 2008;43:528-39. [Crossref] [PubMed]
- Niu H, Li Z, Liao X, Wang J, Zhao T, Shu N, Zhao X, He Y. Test-retest reliability of graph metrics in functional brain networks: a resting-state fNIRS study. PLoS One 2013;8:e72425. [Crossref] [PubMed]
- Di Martino A, Zuo XN, Kelly C, Grzadzinski R, Mennes M, Schvarcz A, Rodman J, Lord C, Castellanos FX, Milham MP. Shared and distinct intrinsic functional network centrality in autism and attention-deficit/hyperactivity disorder. Biol Psychiatry 2013;74:623-32. [Crossref] [PubMed]
- Wang L, Zhu CZ, He Y, Zang YF, Cao QJ, Zhang H, Zhong QH, Wang YF. Altered Small-World Brain Functional Networks in Children With Attention-Deficit/Hyperactivity Disorder. Hum Brain Mapp 2009;30:638-49. [Crossref] [PubMed]
- Geng S, Liu X, Biswal BB, Niu H. Effect of Resting-State fNIRS Scanning Duration on Functional Brain Connectivity and Graph Theory Metrics of Brain Network. Front Neurosci 2017;11:392. [Crossref] [PubMed]
- Wang J, Dong Q, Niu H. The minimum resting-state fNIRS imaging duration for accurate and stable mapping of brain connectivity network in children. Sci Rep 2017;7:6461. [Crossref] [PubMed]
- Cai L, Dong Q, Niu HJ. The development of functional network organization in early childhood and early adolescence: A resting-state fNIRS study. Dev Cogn Neurosci 2018;30:223-35. [Crossref] [PubMed]
- Li Y, Yu D. Variations of the Functional Brain Network Efficiency in a Young Clinical Sample within the Autism Spectrum: A fNIRS Investigation. Front Physiol 2018;9:67. [Crossref] [PubMed]
- Saramäki J, Kivelä M, Onnela JP, Kaski K, Kertész J. Generalizations of the clustering coefficient to weighted complex networks. Phys Rev E Stat Nonlin Soft Matter Phys 2007;75:027105. [Crossref] [PubMed]
- Niu H, Wang J, Zhao T, Shu N, He Y. Revealing topological organization of human brain functional networks with resting-state functional near infrared spectroscopy. PLoS One 2012;7:e45771. [Crossref] [PubMed]
- White BR, Snyder AZ, Cohen AL, Petersen SE, Raichle ME, Schlaggar BL, Culver JP. Resting-state functional connectivity in the human brain revealed with diffuse optical tomography. Neuroimage 2009;47:148-56. [Crossref] [PubMed]
- Sasai S, Homae F, Watanabe H, Sasaki AT, Tanabe HC, Sadato N, Taga G. A NIRS-fMRI study of resting state network. Neuroimage 2012;63:179-93. [Crossref] [PubMed]
- Biswal B, Yetkin FZ, Haughton VM, Hyde JS. Functional connectivity in the motor cortex of resting human brain using echo-planar MRI. Magn Reson Med 1995;34:537-41. [Crossref] [PubMed]
- Zhang H, Duan L, Zhang YJ, Lu CM, Liu H, Zhu CZ. Test-retest assessment of independent component analysis-derived resting-state functional connectivity based on functional near-infrared spectroscopy. Neuroimage 2011;55:607-15. [Crossref] [PubMed]
- Zhang H, Zhang YJ, Lu CM, Ma SY, Zang YF, Zhu CZ. Functional connectivity as revealed by independent component analysis of resting-state fNIRS measurements. Neuroimage 2010;51:1150-61. [Crossref] [PubMed]
- Shrout PE, Fleiss JL. Intraclass correlations: uses in assessing rater reliability. Psychol Bull 1979;86:420-8. [Crossref] [PubMed]
- Sampat MP, Whitman GJ, Stephens TW, Broemeling LD, Heger NA, Bovik AC, Markey MK. The reliability of measuring physical characteristics of spiculated masses on mammography. Br J Radiol 2006;79:S134-40. [Crossref] [PubMed]
- Winer BJ. Statistical Principles in Experimental Design. New York, NY, US: McGraw-Hill Book Company, 1962.
- Rousson V, Gasser T, Seifert B. Assessing intrarater, interrater and test-retest reliability of continuous measurements. Stat Med 2002;21:3431-46. [Crossref] [PubMed]
- Müller R, Büttner P. A critical discussion of intraclass correlation coefficients. Stat Med 1994;13:2465-76. [Crossref] [PubMed]
- Latora V, Marchiori M. Economic small-world behavior in weighted networks. Eur Phys J B 2003;32:249-63. [Crossref]
- Watts DJ, Strogatz SH. Collective dynamics of 'small-world' networks. Nature 1998;393:440-2. [Crossref] [PubMed]
- Niu H, Li Z, Liao XH, Wang JH, Zhao TD, Shu N, Zhao XH, He Y. Test-Retest Reliability of Graph Metrics in Functional Brain Networks: A Resting-State fNIRS Study. PLoS One 2013;8:e72425. [Crossref] [PubMed]
- Tian L, Di Z, Yao H. Effect of distribution of weight on the efficiency of weighted networks. Acta Physica Sinica 2011.60.
- Bolaños M, Bernat EM, He B, Aviyente S. A weighted small world network measure for assessing functional connectivity. J Neurosci Methods 2013;212:133-42. [Crossref] [PubMed]

