

Revealing the morphology and function of the cochlea and middle ear with optical coherence tomography
Introduction
The exquisite sensitivity and frequency discrimination capacity of the mammalian auditory system gives a strong survival advantage to many species which rely on cues from their acoustic environment. Researchers in audiology probe the inner ear to understand its basic mechanisms, and in order to learn more about its evolutionary development (1). From a clinical point of view, peripheral hearing loss is a significant public health issue, and the better understanding of the function of the hearing organ would lead to improved prevention and treatment of a variety of ailments. Optical coherence tomography (OCT) has contributed substantially to physiological studies of the inner ear and appears poised to also have a strong influence on clinical diagnosis of hearing disorders.
The peripheral pathway functions as follows, and a summary of the anatomy can be seen in Figure 1. The cochlea is a bony structure found bilaterally in the temporal bone of the skull (Figure 1A). Briefly, sound impinging on the tympanum elicits vibration of a chain of three bones, the auditory ossicles (Figure 1B). The third ossicle, the stapes, is coupled via the oval window membrane to the fluid filled, three chambered cochlea (Figure 1C,D). A pressure difference in the fluid, across these chambers, induced by stapes vibration, causes a travelling wave of motion that propagates along the collagenous basilar membrane (BM), peaking at different locations depending upon the frequency of the acoustic stimulus (2). High frequency travelling waves peak closer to the base of the cochlea, and low frequency travelling waves peak closer to the apex. Termed tonotopicity, this frequency distribution arises in part from the passive mechanical properties of the BM, i.e., from its mass and stiffness, which vary as a function of place in the cochlea (3-7).

The hearing organ itself is the organ of Corti (OoC) (Figure 1E,F). This consists of two types of sensory cell, outer and inner hair cells, and assorted supporting cells, sandwiched between two structures, the BM and tectorial membrane (TM). Outer hair cells (OHCs) detect the relative shear displacement of the BM and TM (8), converting the kinetic energy of that displacement into transverse force. Inner hair cells (IHCs) detect the velocity of the surrounding fluid in the subtectorial space (9,10), when the membranes are displaced by sound induced vibration. The displacement or fluid velocity opens mechanoelectrical transduction channels in the linked tips of the stereocilia of the OHC and IHC, permitting Potassium influx from the highly electropositive scala media fluid (11,12), via these channels to pass through the reticular lamina (RL), the upper surface of the cellular OoC. The electrical activity of the IHCs induces neurotransmitter release, at their basal membranes, activating synapses which carry the neural signal along the auditory nerve to the brain.
These passive mechanical properties alone are not sufficient to provide the sensitivity and frequency tuning observed in mammalian hearing. An active, non-linear biological “cochlear amplifier” adds gain (13), dynamic range (14) and sharpens mechanical frequency tuning close to the peak of the travelling wave (15), through cycle-by-cycle mechanoelectrical transduction by the OHCs (16,17). Therefore the neural signal generated by the deflection of free standing IHC stereocilia arises by means of a complex interplay of passive mechanics and active, physiologically vulnerable, non-linear processes (18) (Figure 2). Neither of these mechanisms are well understood, partially due to the poor anatomical accessibility of the cochlea, and partially because of the vulnerability of its normal function to some experimental paradigms used to investigate its function. Additionally, the diagnosis of middle and inner ear disorders, and treatments employing surgical approaches, e.g., cochleostomy, are complicated by these factors.

At this point, OCT has provided several major advantages to researchers. First, OCT has demonstrated the ability to surpass the cited 100 dB sensitivity required to reliably image the OoC (19), despite the reflectivity of this cellular structure being akin to that of the surrounding fluid [for the BM, using a 633 nm beam, a reflectance between 3×10⁻⁴–3×10⁻⁵ is estimated (20)]. Second, structures inside the middle and inner ears can be resolved without a direct line of sight, owing to the light penetration property of infra-red light that provides OCT with an ability to see into the tissue depth. For example, Recio-Spinoso and Oghalai (21) report reliable OoC displacement from a location approx. 1.5 mm deep, axially measured from the apical cap of the guinea pig cochlea. A similar location can be seen in the bottom right of Figure 1C. This means that the cochlea may remain intact, and, for studies of the middle ear, the ossicles may also be imaged through the tympanum. Third, due to the wider wavelength bandwidth in the light source, the coherence gate may be positioned at many depths and lateral positions relatively quickly. This is achieved by Fourier domain analysis of the interfering wavelets compared to a reference of a band limited light source. Finally, the spatial resolution conferred by OCT method is sufficient to compare regions within the OoC. While the absolute displacements of these structures range from 0.1–several hundred nm, the comparison of structures of interest, i.e., the top vs. the bottom of the OoC, a distance of approx. 100 µm, is well above the axial (3 µm) or lateral (10 µm) resolution of OCT systems (19). In practice this may be limited by optical constraints. This process provides a wealth of data, making relative movements of structures within the OoC, or the movement of a whole ossicle chain, far easier to visualize and interpret.
Many thorough reviews of OCT methods are available. This review compiles the advances and observations made in the clinic and the research setting for the main applications of OCT in Otology, as well as summarizing the technological principles and approaches of different OCT devices and paradigms, where they were important to the progress of the research field.
Cochlear imaging techniques
The primary techniques that have been used to image the living peripheral and central auditory system have been computed tomography (CT) (22-24) (Figure 1A) and magnetic resonance imaging (MRI) (25-27). Currently, both are used as standard in diagnosing auditory pathology, such as inner ear malformation (28,29), acoustic neuroma (30,31), assessing patient suitability for cochlear implantation (32-34), and assessing the severity of endolymphatic hydrops in Meniere’s disease (35-38). MRI and CT are well suited to these tasks, as their penetration depth greatly surpasses that of OCT. Indeed, this is the main clinical drawback of OCT in otology, necessitating development, which will inevitably rely upon endoscopic implementation for cochlear imaging. When imaging gross cochlear morphology with MRI, it has often been desirable to use contrasting agents such as gadolinium, administered transtympanically, to aid the differentiation of the endolymphatic space from the perilymphatic spaces, and assessment of inner ear non ossicle tissue (39-42). Here OCT holds the advantage, whereby contrast labelling is unnecessary to identify fluid, tissue and bone. The field strength of currently used MRI scanners is not sufficient to image either the OoC or the stria vascularis (SV), and the radiation dose to the patient creates a safety limit for CT scanning resolution. As a result, the spatial resolution of CT is up to approx. 0.1 mm (43) and approx. 0.5 mm for MRI (26), compared to the potential 10 µm of OCT. OCT also uses infra-red light and as such does not carry the ionizing radiation dose concerns of CT.
Several studies have employed intravital microscopy to investigate the vascularization of the cochlear lateral wall in rodents e.g., (44-46). This technique produces high spatial [1–2 µm (47)] and temporal resolution real time images of blood network behavior under either label free or fluorescent conditions. However, it is technically challenging and clinically unsuitable, due to the difficulty inherent with opening the cochlear bone in order to access and visualize the lateral wall vessels, without damaging the cochlea. OCT permits angiographic imaging and blood flow measurement, label free, at reasonably high resolution, without opening the cochlea.
Ultrasound has been employed to image the cochlea, however it has not been used in the clinic. A typical ultrasound device may produce a resolution of 100–500 µm, depending upon the frequency of the transducer. Increasing frequency decreases penetration depth but increases resolution (48). Inner ear imaging has been achieved in vitro in human temporal bone explants (49,50), and in vivo with rodents (also collecting vibrational data) (51). The penetration depth of ultrasound is superior to that of OCT, but the lateral and axial resolution of images is much poorer. Drawbacks of ultrasound imaging include its poor capacity to image through bone as well as gas-filled cavities. These factors strongly limit its potential for imaging the inner or middle ears.
Better imaging of intracochlear microstructures could undoubtedly contribute to more precise diagnosis of inner ear disorders. For instance, age-related hearing loss is commonly subdivided in strial, sensory, and neural types, but there is no method that can differentiate between these types. This lack of precise diagnosis also hinders the development of more precisely targeted therapies.
Vibrometry
A wide range of tools, both obsolete and contemporary, exist to characterize and understand the physiology of acoustic transduction in the cochlea. Technical development included stroboscopy (3), the Mossbaeur technique (15,52,53), fuzziness detection (54), capacitive probes (14,55-57), laser Doppler vibrometry (5,58-62), displacement sensitive heterodyne laser interferometry (63), slit confocal and confocal laser scanning microscopy (64-72), video confocal microscopy (73), self-mixing laser interferometry (6,17,74-84), and dual pressure/voltage probes (85-91), and low coherence interferometry (92,93). All of the above approaches have been used successfully in animal models, but clinical suitability is limited. For a detailed review of the above technology, see Nuttall and Fridberger [2012] (94).
In general, OCT surpasses the non-optical approaches listed above in terms of sensitivity. The laser based methods (except fuzziness detection, self-mixing, and confocal methods) require reflective beads to be placed upon the target structure, a step unnecessary with OCT. It should be noted that confocal and stroboscopic approaches are limited to in vitro applications at this time due to their sensitivity to gross physiological noise, e.g., breathing. Coherent light source techniques may only measure vibration from a single point in space, while OCT extracts the vibration pattern of all structures within its coherence gate. Low coherence interferometry may also do this, and requires no reflective target and is in fact more sensitive than OCT, but, like all of the above techniques (excepting confocal), it cannot provide simultaneous volumetric imaging of the target structures. Crucially, all of the above vibrometry techniques require direct line of sight to the target, making OCT comparably non-invasive and versatile as it may image through the cochlear bony wall, or the tympanum.
In order to understand the role that OCT has played in moving several fields of hearing research forwards, the basic principles of OCT shall be outlined below.
OCT method
Brief basis of OCT and its derivatives relevant to hearing research
OCT originates from optical interferometry, which establishes efficient interference between a split and later recombined broadband optical field. For a detailed review of the developments of OCT, see respective work by Fercher and Tomlins (95,96). Figure 3A shows a typical OCT schematic. The split field from the light source propagates in a reference arm, reflecting from a reference mirror, and also in a sample arm where it is backscattered from within a scattering sample. Due to the optical property of broadband light source used, the interference between the optical fields is only observed when the optical path lengths in the reference and sample arms are matched to within the coherence length of the light. As a consequence, the depth (axial) resolution of an OCT system is determined by the temporal coherence of the light source. A change in refractive index within sample produces an intensity peak in the interference pattern. A depth profile (i.e., A-scan) can be obtained by translating the reference mirror to change the reference path length and match multiple optical paths due to localized backscattering within the sample. This strategy is often referred to as time-domain OCT (97).
Depth information can also be retrieved from the measurements of spectral interferograms by Fourier transformation of the output spectrum. In this case, the optical path length in the reference arm remains constant and spectral interferograms of the OCT output are detected by an optical spectrometer (Figure 3B). Such arrangement is usually referred to as spectral domain OCT (SD-OCT) (95,96). Alternatively, the broadband light source in Figure 3A can be replaced by a swept laser source, and resultant wavelength-dependent interference signals detected by the photo-detector are Fourier transformed to derive the depth information. This strategy is commonly referred to as swept-source OCT (SS-OCT) (95). Both SD- and SS-OCT belong to Fourier domain OCT category in the optics community.

A two- (2D, B-scan) or three-dimensional (3D, C-scan) OCT image can be acquired by aligning adjacent A-scans, as shown by OCT images in Figure 1C,E. These A-scans are performed while laterally scanning the probe beam in either one or two orthogonal directions. Based on Nyquist sampling theorem, a spacing between adjacent A-scans within a B-scan is typically selected to be approximately half of the transverse resolution of the OCT system. Given a fixed A-scan rate, this spacing selection determines the system imaging frame rate, similar to that of ultrasound imaging. In scattering tissue and other turbid media, the actual imaging depth is limited primarily by optical scattering, and hence maximum reported imaging depths are between 1–3 mm (98) for a variety of tissues at wavelengths between 800 and 1,300 nm. Since the bony cochlear tissue is highly scattering, the use of 1,310 nm in the OCT has an advantage over 800 nm wavelength when applied to the hearing field, simply because the light scattering potential is inversely proportional to the wavelength (99). Section “Inner ear imaging” details the applications of OCT imaging in the hearing field.
There are two OCT metrics that are particularly important in the hearing research, which are the system sensitivity and the depth-of-focus. The sensitivity of an OCT system, also called optical dynamic range, can be defined as the ratio of the signal power generated by a perfectly reflecting mirror ( ) to the noise of the system () (95), i.e., the power signal to noise ratio (SNR).
The signal photocurrent at the detector ip is due to the effective interference term in the system, that, in the case of an ideal 50:50 beam splitter and a perfectly reflecting sample, is equal to the total source power P. The optical detection in OCT has three significant sources of noise: shot noise, optical intensity noise and thermal noise. However, OCT is by nature a heterodyne detection scheme optical system. Therefore, it can be arranged to achieve shot-noise limited optical detection whereby the reference arm optical field is much greater than that in the sample arm. This is often the case in OCT when imaging highly scattering and absorbing biological samples. In the shot noise limited case the optical intensity and thermal noises become negligible. The system sensitivity is important when cochlear vibration and blood flow are measured since it determines the phase noise in the system.
In practical applications investigators should be aware of the system stability, often measured by the phase stability of the light source. Phase stability is particularly important when applying OCT to hearing research. While SD-OCT is inherently phase stable since all the spectral sampling points are obtained simultaneously by a linear detector array, it is generally difficult for SS-OCT to achieve phase-sensitive detection due to two reasons: (I) limitations in wavelength sweeping repeatability (100); and (II) potential jitter errors in acquiring spectral interferograms (101-103). Degraded phase-stability of SS-OCT has been the key issue that limits its application in vibration measurement in hearing research. A number of phase-stabilization techniques have been reported in the literature in order to enable SS-OCT for applications where phase-sensitive detection is needed. A most common practice to phase-stabilize a SS-OCT is to introduce a calibration mirror signal through hardware improvement, upon which to measure the phase error and then to compensate it in the measured signal (100,104). With respect to SS-OCT systems used in hearing research, a reference interferometer with a known optical delay is used to calibrate against phase jitter (105). The most recent advance in this inquiry is the development of fully numerical technique to eliminate its potential jitter noises introduced by the wavelength sweeping mechanism (106).
Common to optical microscopy, the lateral resolution and depth of focus are coupled in OCT, meaning the increase of the lateral resolution would sacrifice the depth of the focus within which the lateral resolution of the system is kept. This can be seen by inspection of Abbe’s rule for the lateral resolution Δx (107),
NAobj is the numerical aperture of the microscope objective, which is inversely proportional to the lateral resolution. However, the depth of field Z of such an objective is then given by (107)
where n is the sample refractive index. The effect of the limited depth of field of high NA objectives is to reduce the detected optical signal beyond this distance, restricting the axial scan range. This is particularly important in hearing research because one always demands a high resolution in order to distinguish the closely situated microstructures of the organ of Corti both laterally and axially. Equally the guinea pig cochlea is approx. 4 mm tall from apex to upper basal turn, with discrete structures of interest. It is therefore important to place multiple structures inside the depth of focus without refocusing (e.g., multiple OoC cross sections visible in Figure 1C). This is because experimental duration affects recording comparability, as the health of the non-linear cochlear amplifier may change over time (e.g., Figure 2). Acquiring essentially simultaneous mechanical responses from multiple locations informs our understanding of longitudinal energy propagation.
OCT angiography
Recent development of OCT angiography (OCTA) (108,109) extends the OCT applications from pure structural imaging to functional imaging by enabling blood flow mapping of living subjects, pushing the OCT development into a new height. By measuring the differences in OCT signals caused by moving cells, OCTA utilizes the flowing red blood cells as the intrinsic contrast agent to generate blood flow signals, allowing the visualization of vascular networks without a need of dye injection.
The basic concept of OCTA is to use the moving particles, for example red blood cells (RBCs), in biological tissues as an intrinsic contrast agent to image blood flow. Imagining there are two OCT signals—one is backscattered from surrounding biological tissue and the other one is backscattered from flowing RBCs within a functional vessel—over time, the OCT signal from tissue components remains relatively steady because there is no movement in the tissue, while the OCT signal from flowing RBCs changes over time, as shown in a simplified schematic Figure 4. By calculating the differences in OCT signals acquired at the same location at different time points, OCTA distinguishes the moving particles from static tissue, and therefore is able to generate flow signals and allows the visualization of microvascular networks in biological tissues without the need for intravenous dye injection.

OCT signal is naturally a complex function, consisting of amplitude and phase information, and can be written as the equation below:

where I (x, y, t) indicates the amplitude component and Φ (x, y, t) presents the phase component in an OCT signal. Various OCTA methods are developed to extract the flow signal based on different components of OCT signal.
In OCTA, there are a number of ways that may be used to extrapolate vascular information from the scanned tissue volume. Typically, OCTA utilizes either a phase- (110), amplitude- (111), or complex-based algorithm (112-114), all of which employ the same data processing procedures, only on different information within the OCT signal. A recent study compared the performances of all three OCTA algorithms and concluded that complex-based information provides the best performance for OCTA imaging (115). This is because the complex-based methods of extraction utilize both phase and amplitude changes in the returning light signal to extract pertinent information. While phase changes are more sensitive to movement, i.e., the moving RBCs, providing more detailed information about flow, phase information is also more susceptible to other motion noise (e.g., breathing, blinking), which subsequently makes detecting slow or low blood flow difficult. On the other hand, by utilizing amplitude information, the method would be more immune to a phase noise caused by small motion in the tissue, but at the cost of sacrificing sensitivity to slow capillary flows. Combined, a synergistic effect results in the most accurate information concerning both larger vessels with fast flow and smaller vessels with slow flow.
Foreseeing this outcome more than a decade ago, Wang et al. proposed a novel method, termed optical angiography (OAG), to convert the modulated OCT signal into a complex function using a modified Hilbert transform with the aim of separating the blood flow signal from that of static tissue (116). A more recent version, termed optical microangiography (OMAG), is in use today in ophthalmic clinic, which typically uses either differential (114,117) or eigen-decomposition (118-120) (the more common method for cutaneous microvascular imaging) over the modified Hilbert transform to extract vascular information. Since its better performance compared to other algorithms (115), such approach has been explored to image cochlear blood perfusion through bony tissue (121-124).
Section “OCT imaging development and use in research” details the applications of OCT angiography imaging in hearing physiology.
OCT vibrometry
Arguably the most impactful development of OCT for hearing research, OCT vibrometry relies upon differential comparison of consecutive structural scans, detecting phase changes caused by vibration of the middle ear ossicles or sensory epithelium, in a way similar to the tissue Doppler approach (125,126). In fact, OCT vibrometry relies upon the traditional cross-correlation of sample and reference beams that are used in Michelson interferometers (127). The method is based on Fourier domain implementation of the OCT system and analyzes the phase information contained in the OCT signals, i.e., phase sensitive OCT (PS-OCT) to realize the measurement of the nano motions in the OoC. Followed by a Fourier transform (FT) analysis of the measured phase changes in the spectral interferograms induced by the nano motion of the OoC, PSOCT has been demonstrated capable of characterizing and imaging the vibration of cellular compartments in the OoC with an unprecedented sensitivity down to ~ 0.5 Ångströms (19).
When the OoC receives sound stimulation, its constituent cellular compartments would respond with different degrees of vibration magnitude relative to the stimulation sound, which ultimately stimulate the mechanosensory receptors. In this case, the vibration of the cellular compartments in the OoC will cause optical path length changes of light that are backscattered by the scatters located at position, z, within the OoC over time, t, which subsequently induces phase changes in the OCT signals. Thus, assuming the sound stimulation is of a single frequency, the phase term in OCT signal {Eq. [4]} becomes
where A and f0 are the magnitude and frequency, respectively, of a sinusoidal vibration source. ϕ is a random phase due to the optical system noise. A differentiation operation to the equation above can be performed:
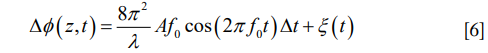
Here, ξ(t) is a phase noise caused by the system noises, including photon shot noise, thermal noise and electronic noise. Δt is reciprocal of the sampling frequency. The sensitivity of vibration f0 measurement is boosted by the FT analysis of Eq. [6]. This FT frequency analysis amplifies the signal of interest for detection, and it does not affect the Gaussian noise (statistically). For the OCT system that is typically used in hearing research, it is reasonable that the system-phase noise is assumed to be the Gaussian noise. Therefore, the FT analysis of the measured phase changes would dramatically enhance the SNR for the signal of interest (typically 20 dB more), which is essential for measuring the vibrations of the cellular compartments in the OoC with a magnitude normally at a sub-nanometer scale, in a system where normal physiological function, and therefore the gross physiological noise that accompanies it, is vital.
OCT imaging development and use in research
Inner ear imaging
The utility of OCT in imaging the cochlea was first demonstrated using rat cochlear explants (128) (Figure 5A). This was followed by experiments in the guinea pig and further studies exploring the effects of different wavelength sources (130,131). OCT has a resolution, safety, and cost advantage over conventional imaging methods. For example, the spatial resolution of MRI at the time of the study was 1 mm, compared to 10 µm in OCT, providing real time images of the interior structure of the cochlea. OCT also possesses a dynamic range and tissue differentiation advantage over ultrasound and MRI.

Extensive animal studies highlight the potential use of OCT for diagnosis of inner ear pathology. Notable examples include estimating the distention of the scala media in a murine mutant model of endolymphatic hydrops (132,133) or blast and noise exposed mice (134), 3D analysis of the cochlear morphology of the guinea pig after surgical induction of endolymphatic hydrops (135), and analysis of intracochlear tissue in the excised cochleae of Tecta mutant mice compared to wildtype (136). It should be noted that some of these studies employed bone thinning or decalcification protocols (137,138), in order to improve image quality and depth penetration, highlighting yet again that bone density and thickness is a challenge yet to be overcome. The striking improvement of image resolution and subsequent anatomical detail analysis by opening the cochlea is especially apparent in (136).
The high spatial resolution potential of OCT is exemplified in the development of a paradigm termed µ-OCT (129) (C-scans using this method are shown in Figure 5B,C) which so far provides subcellular detail of fixed guinea pig cochleae. The lateral resolution of this paradigm is approximately 2 µm. Such imaging power can resolve individual auditory nerve fibers crossing the space of Nuel and permits the identification of individual hair cells and supporting cells. However, the technique has yet to be attempted in vivo.
Clinical applications of imaging
A major obstacle for employing OCT in human intracochlear imaging is the penetration depth of the incident light, which for a 1,310 nm light source is approx. 1.25 mm on average (131). Pending further development of brighter superluminescent diodes or those with longer central wavelengths, an endoscopic approach has been adopted, leading to exploration into how it may be employed in the clinic, with transtympanic fiber optic studies in human and porcine temporal bone preparations (139-141). Direct OCT imaging of the decalcified human cochlea has also been undertaken (142).
Despite the difficulty in imaging internal cochlear structures in the human, OCT can be employed perisurgically, in order to appropriately target cochleostomy in the promontory, for accurate and safe cochlear implant insertion. While direct mechanical interaction with the cochlea inevitably causes trauma and associated hearing loss, proper siting and guidance during surgery reduces the risk of damaging residual hearing (143), currently a priority in CI surgery. OCT devices have been successfully combined with operating microscopes and have produced anatomical imaging for line-of-sight surgery in temporal bone preparations (144,145). Significant advancements in laser cochleostomy have been made by using OCT structural imaging as a guidance system. The ability to differentiate between endosteum and bone allows for micron precise ablation of the bone by the pulsed laser, avoiding residual tissue left in place by drill techniques (146,147). OCT has also been used to guide ultrafast laser ablation to facilitate visible light microscopy (148).
Middle ear
Wide field of view OCT imaging of the middle ear cavity (149) has multiple applications: aside from use in basic research to understand middle ear mechanics (see section “Middle ear mechanics”), its suitability is apparent for the diagnosis and appraisal of middle ear disorders (150,151). The tympanum is very thin, and poses a minor light scattering and attenuation obstacle to OCT systems optimized for imaging the middle ear. Because of this, OCT imaging of the middle ear may be completely non-invasive, requiring only an otoscopic mount (152,153).
The sensitivity of OCT to the composition of structures in the beam path is well demonstrated by its use in quantifying the characteristics of middle ear effusions associated with otitis media. An example study calculated the dynamic light scattering properties of middle ear biofilms, in order to assess the type of middle ear effusion in human patients undergoing myringotomy surgery (154). The technique, using a hand held OCT device, could detect a quantitative difference between middle ear effusion, and glue ear conditions.
Assessment of the condition of the annulus and the stapes footplate is possible using perioperative OCT (155). The identification of the abnormal stapes fixed to the oval vestibule, can aid the surgeon during stapedectomy surgery. A useful improvement of this technique would be to combine it with a non-invasive OCT scanner, for pre-surgical preparation and investigation.
Measurement of blood flow in the cochlea
The OoC is metabolically demanding, and the maintenance of the physiologically unique endocochlear potential requires specialized ion transport. The SV fulfills these functions, and thus the OoC is sensitive to pathological changes in this tissue. Age related hearing loss (presbycusis) has long been related to atrophy of the SV gross structure, gap junction composition, and active transport mechanisms (156-160). Additionally, genetic mutations in SV can contribute to sensorineural hearing loss (161-163). Acute imbalance of the homeostasis of the cochlea by hypoxia or manipulation of gross blood physiology (164) and also by loud sound (165,166) reduces cochlear blood flow in vivo. There are also suggestions from laser Doppler flowmetry (167) and perilymphatic oxygen tension (168) studies that vascular pathology may play a role in idiopathic sudden sensorineural hearing loss .The condition of the SV is therefore a variable that should be monitored in human hearing, but the aforementioned obstacles which prevent successful imaging of the OoC with conventional techniques apply.
Aside from the resolution, cost and invasiveness issues with MRI, CT and radioactive techniques, laser based methods e.g., laser Doppler flowmetry cannot provide spatial information on flow, and it has been reported that non-specific flow signal from non-cochlear vessels (167) or from vibrations of the OoC during loud sound exposure (169,170) can influence or impede interpretation of data. For a review of conventional blood flow methods previously used in research, see respective work by Ren et al. [1994] and Nuttall et al. [1988] (171,172).
Specific OCT angiography (OCTA) paradigms can pave the way forward for in vivo imaging of the SV for research and clinical purposes. OCTA was first described as a converted use of laser speckle analysis (111), and this has led to extensive development of the technique in the field of ophthalmology (173). A similar method, Doppler optical microangiography (DOMAG) (174), has been employed in measurements of murine cochlear blood flow during hypoxia (122,123), and during loud sound exposure (121) (see Figure 6A). This technique encounters an issue specific to the cochlea when used to image the flow of the SV: the rate of flow inside the capillary beds of the SV is too low to be readily detected, and the spatial resolution of DOMAG is insufficient to image small diameter capillary beds.

For absolute flow values to be obtained using DOMAG, a 3D scan of the Doppler imaged blood vessels must be undertaken in order to calculate their orientation and therefore Doppler angle. OMAG is an adaptation of DOMAG which can produce simultaneous structure and blood flow information in 3D, with a relatively short acquisition time (113,122,175). OMAG has thus far produced high quality images of the capillary beds of several organs, including brain, retina and the pinna and cochlear lateral wall of the mouse (e.g., Figure 6B). A crucial advantage of OMAG over previous techniques is that the areas of blood flow are all that is returned in an OMAG scan, which reduces signal-to-noise ratio problems. Simultaneous imaging and flow measurement allows for the removal by image segmentation of non-specific artefacts such as vibrating structures or surface blood vessels. However, OMAG remains a relative measure of flow, with many parameters such as vessel diameter, sampling rate and density, and beam focus, all confounding inter-subject standardization. It is also unknown what impact imaging through bone may have on quantification of flow in the rodent lateral wall. As a result, inter-disciplinary efforts to quantify flow value from pixel intensity in physiological samples are so far unsuccessful, although algorithms do exist which provide flow values in controlled flow phantom studies (176-178). A recent study has produced an algorithm which appears to quantify flow information from flow phantoms, and rodent brain tissue in vivo (179), but the study itself admits that the technique used is still limited by the aforementioned variables. An OMAG algorithm which produces absolute flow values would be a large step forward in blood flow imaging. As with all previously and presently mentioned OCT paradigms, the development of a minimally invasive endoscopic probe would markedly increase clinical viability.
OCT and mechanics
Inner ear
The ability to image the internal structure and vascularization of unopened healthy rodent cochleae afforded to researchers by OCT is of enormous benefit. Additionally, as the mechanism of OCT is based upon comparison of light reflecting and scattering off of the target structure and a reference mirror, it is easily converted into an interferometer. As mentioned in “Vibrometry”, traditional laser interferometers often require the placement of reflective beads upon a target of interest, as the BM is poorly reflective. For apical recordings, the beads would be delivered through a small tear in Reissner’s membrane, causing a mixing of perilymph and endolymph, further threatening hearing sensitivity. Not only is this unnecessary using OCT, but the ability to measure through the BM is a huge milestone. It allows imaging of supra-BM structures in the base, and sub-TM structures in the apex. This short coherence gating extends OCT further over traditional interferometry, as lasers, which typically possess a longer coherence length, cannot differentiate between signals from target structures, and thus increase the uncertainty and difficulty of interpretation of their data.
OCT vibrometry was first conducted in excised guinea pig cochleae, with a cochleostomy in the scala tympani of the basal turn (180) (note: imaging of the rat OoC was achieved in vitro prior to this, with no such opening of the cochlea, see section “Inner ear imaging”. It was mentioned in this study that such a measurement with a closed cochlea would be feasible using the equipment described). This method improved upon previous attempts to develop a low coherence interferometer (181) by employing a narrow coherence gate of 10 µm. This would allow for imaging of distinct cochlear structures along the axial dimension. The vibrations measured—like those of a following publication employing Doppler OCT (182) —were achieved by vibrating the whole cochlea on a piezo, and thus were not directly physiological, although they had the advantage of confirming the ability to receive interferometric signals from cochlear tissue.
The fact that OCT can yield mechanical information from morphologically distinct components of the OoC allows for simultaneous gathering of not only depth resolved displacement, but also the relative motion at different lateral positions. Much debate has focused on the complexity of the transverse motion of the OoC relative to radial position (Figure 1F) with some reports suggesting that the BM moves with a single mode of motion (183) and others indicating more complex motion with two modes of displacement (6,62,75,76). Each interpretation profoundly changes how one may expect the cochlear amplifier to function, and thus a clear picture of the complex 3D motions of cochlear structure, in the undisturbed cochlea, is required. The in vivo OCT vibrometry measurement of acoustically induced vibration of the OoC in guinea pigs was reported by (184). This study also reported simultaneous non-interfering measurements of the motion of the RL and the BM. Further studies compared the displacements of the two (19). An important consequence of these measurements was the realization that RL displacement is significantly larger than BM displacement at low sound stimulus levels (Figure 7A,B), a feature of the data that was abolished post mortem. The phase rotation of the RL and BM are also different as a function of stimulus frequency (186). Further studies (93,185,187-189) noted this, and also exposed the differences in OoC frequency tuning and phase as a function of radial position.

The mechanical complexity as a function of radial position gives credence to the suggested presence of further filtering mechanisms within the microstructure of the OoC, which may impose their effects upon frequency selectivity and sensitivity between amplification and transduction. This suggestion has been bolstered by the observation that mechanical tuning of the OoC at the apex of the guinea pig cochlea appears to be low pass (21), as opposed to the previously reported bandpass, despite the existence of sharply tuned low frequency BF auditory nerve fibers (190). Such findings have also been reported in gerbils, with attempts made to relate displacement profiles to IHC recruitment areas for different regions of the cochlea (191). Furthermore, reanalysis of the same data has alluded to puzzling phase behavior, where the group delay of the OoC displacement appears to increase with frequency when measured from positions closer to the apex, and also increases with stimulus level, two features at odds with basal cochlear mechanics (192). Recio-Spinoso and Oghalai [2017] (21) also highlighted the difference between recordings from the apex of an open or closed cochlea, by demonstrating that the act of opening the cochlea was the possible origin of the artefactual bandpass OoC filter function. This is due to the wavelength of the low frequency travelling wave being similar to the diameter of the aperture through which traditional laser Doppler vibrometry measurements were made, causing a hydromechanical interaction, finally changing the fluid pressure distribution along the length of the cochlea (21,63,193). With this in mind, the frequency ranges recorded in the Recio-Spinoso and Oghalai [2017] study (21) do not preclude the existence of band pass tuning in the very apex, and similar studies which bear the hallmarks of cochlear sensitivity (e.g., RL displacement is larger than BM) report bandpass tuning at similar cochlear regions, in the absence of a cochleostomy (185).
Cochlear mechanics should be adapted to favorably encode speech, vocal communication, and music. This is undertaken by the transduction of the slowly varying envelope of a complex sound. SD-OCT vibrometry was used amongst other techniques such as in vivo electrocochleography in humans and guinea pigs, in vitro hair cell patch clamp, traditional laser Doppler vibrometry, and mathematical modelling, to produce evidence for dynamic envelope processing in the cochlea. The role of SD-OCT in this study was to measure the response of the RL and BM in response to a three tone complex, which should produce a measurable envelope component. Such a component was present only on the RL at higher sound levels, accompanied by a large electrical signal, implying that IHCs may play a dominant role in speech processing in the cochlea (61). This behavior was noted at both the upper basal and hook regions of the guinea pig cochlea. Whether a similar mechanism exists in the apex, the cochlear region more closely tuned to speech and vocal communication, remains to be investigated.
As a note of interest on methodology, the studies which provide an insight into apical transverse mechanics in the guinea pig employing OCT (21,185,194) use different surgical approaches. Recio-Spinoso and Oghalai [2017] (21) expose the apex of the cochlea in its entirety by removal of the mandible, allowing direct measurement along the axis of transverse OoC motion. Ramamoorthy et al. (194) and Warren et al. (185) utilize a 3D printed scaffold, inside which a mirror is mounted at a 45 degree angle. Placed upon the apex of the cochlea, this scaffold directs the OCT beam into the correct orientation. Both approaches have advantages and drawbacks: the less invasive surgery permitted by use of a mirror increases the likelihood of cochlear sensitivity being preserved, at the expense of some loss of light due to mirror reflectance, and a slightly impaired field of view. The field of view and more precise identification of measurement position made possible by the more invasive surgical approach are beneficial, but it should be noted that the two approaches result in large differences in tuning and raw displacement magnitude at apical locations, although both are supported by estimates of good physiological condition. Potential explanations for this discrepancy lie in the understanding of the effect of trauma on hair cells and passive OoC mechanical properties. Acoustic overstimulation results in altered tuning coupled with OHC morphological changes (195), increased low frequency electrically evoked otoacoustic emissions (196), and reduced stiffness of the cochlear partition (197).
An additional means of guiding the OCT beam to image of cochlear structures is a piezo driven, GRIN lens facilitated fiber optic probe is in use (198). Instead of confining measurements to the axis afforded by the surgical field, or using external mirror devices, the fine probe is scanned using a sawtooth wave stimulus with a controllable DC offset, permitting precise placement of the beam prior to displacement recordings. This approach has the potential to increase versatility surrounding OCT measurements, often marred by the bulk of the optical system guiding the light.
OCT also has the potential to reveal the function of the TM in amplification and energy distribution in the cochlea. In vitro, in vivo and modelling studies (77,83,199-208) demonstrate that the mechanical properties of the TM vary as a function of stimulus frequency, and thus suggest that it may sustain travelling waves of its own. Possible evidence relating to this has been reported in mice in vivo, employing OCT (104), however, resolution limitations remain an obstacle for definitive confirmation. Optical vibrometry techniques record the vector sum of complex 3D movement dependent on the orientation of the sample, necessitating measurements from multiple angles. Such measurements have revealed the 2D motion of the OoC in the mouse, in the radial and transverse directions, and showed their variation with stimulus frequency (209). A method to extract multi-angle information from a single beam OCT device has also been reported (210). The modified device splits the light beam into two, each with a different delay and angle of incidence. This permits measurement of the absolute vibration amplitude from a single measurement position, at the expense of some sensitivity. This technique could lead to a more straight forward characterization of the multi-dimensional movement of the OoC.
Alternatively, measurements from multiple angles in the same preparation illuminate micromechanics in several ways. Dewey et al. [2018] (211) explored the contribution of hair bundle stiffness and the TM to cochlear mechanics, by examining the radial and transverse motion of multiple sub-units of the OoC in several mutant mouse lines. The results imply that hair bundle and TM mechanical coupling may play a role in the longitudinal propagation of acoustic energy. Similarly, Cooper et al. [2018] (212) used two angles parallel to the cochlear duct, to assess whether phase opposition and therefore longitudinal propagation at the level of the RL occurs in the hook region of the gerbil cochlea. Additionally, this set of experiments reveal the likely presence of a physiologically vulnerable, saturating and extremely localized region of displacement, termed a “hot spot”. This hot spot is suggested to be at the interface between the OHCs and supporting Dieters’ cells, and the longitudinal motion is due to the OHC-Dieters’ cell unit bending during contraction and elongation.
The presence of non-linear gain is described far from CF, a finding at odds with the BM-centric mechanics data available to physiologists until recently (92,212,213). Further to this, OCT vibrometry of the RL and BM in the presence of probe and suppressor tones, which is known to inhibit cochlear amplifier contributions from the place of tone overlap, imply that these far from CF regions of amplification do not contribute to gain at the CF (213). This observation is further contextualized via the framework of amplifying and non-amplifying regions of the RL, supported by OCT vibrometry of the cochlear partition and local potential measurements, while stimulating with single tones or complexes. The distinct regions of effect of OHC force production are demonstrated by the phase relationships of the two measurements (214).
While OCT vibrometry has led to a re-invigoration of cochlear mechanics, an issue which acts as an interpretive drawback is the problem of signal competition. Using coherent interferometry, one may be sure that, as long as the beam is focused correctly, the signal one obtains is derived from a vector of motion of a single reflector, in the case of bead use. OCT provides displacement information from a variety of closely situated structures, all within the coherence gate. This produces uncertainty about the true nature of the vibrating structure, and doubt over whether one is measuring a specific region of the OoC, or contributions from many discrete structures, dependent upon their reflectivity and the amplitude of the displacement. Such uncertainty is physically manifested in phase leakage, which may in turn cause distortion of output waveforms. Such a drawback should be carefully considered when attempting to unpick mysteries of cochlear micromechanics (215).
Middle ear mechanics
The focus of this review is primarily inner ear. Middle ear applications are mentioned in brief, but for a detailed technical review, see Ramier et al. [2018] and Tan et al. [2018] (216,217). OCT vibrometry techniques lend themselves equally well to further exploring the acoustically driven mechanical properties of the middle ear. The functional state of each component of the middle ear during acoustic stimulation can aid clinicians in diagnoses, as well as providing more information ahead of surgery. The equipment and approaches required for vibrometry are identical to those needed for imaging, aside from the need to provide calibrated acoustic stimulation (218) (Figure 8). Several research groups have begun to apply vibrometry to the middle ear, first in animal models extratympanically (219-222) then with the use of an OCT endoscope (223), or handheld device (224).

Human middle ear vibrometry poses a challenge different from that of the inner ear. While the inner ear is anatomically remote, the middle ear is less so, but its dimensions and complexity place a demand on both the spatial resolution, and depth of focus of the OCT device. That is, the required micron level spatial resolution, and a depth of focus sufficient to image the ossicle chain work in opposition to one another, as the two optical characteristics are usually subject to mutual compromise. However, the most recent and most promising application of Doppler OCT vibrometry in a transtympanic non-invasive regime show that relatively coarse resolution still yields mechanical data that may differentiate humans suffering from middle ear disorders, relative to controls (225). This mode of operation is limited by the fact that field of view is limited along the (often curved) auditory canal, and that the stapes is obscured by the infra-red opaque incus. Despite this, OCT middle ear scanning could reduce but not eliminate the necessity for CT scanning of the middle ear, cutting cost, time, and patient risk.
Summary
Important progress has been made in the adaptation of OCT to auditory physiology and otology in a versatile and exciting way. The studies and approaches remarked upon here highlight the desire to move OCT from a purely research based tool to a routinely used clinical one, with extensive middle and inner ear structural and vascular imaging. This will have a positive impact in cost, ease of use, safety and reliability for both patient and clinician when considering contemporary technologies.
Diagnostic and assistive capabilities of OCT imaging aside, the distinct and hugely important leap in investigative power by OCT interferometry must be highlighted. When one considers OCT alongside the decades of vibrometry and imaging research in otology, a recurring theme develops. That is, the cochlea exists as a black box, the manipulation of which by the smallest degree changes our interpretation of it. As vibrometry techniques in cochlear mechanics have become more refined, experimental influence on the system has dwindled from a drained, dead cochlea to an unopened, healthy one in limited circumstances, with a new series of limitations introduced by the technology. It is therefore of importance to highlight here that OCT overcomes many of these limitations rather effectively, with the additional advantage of concurrent imaging and vibrational analysis at useful resolutions, combined with scanning capabilities. The recent influx of mechanical data providing simultaneous measurement of many different sites within the auditory periphery has encouraged the field of cochlear mechanics to further shift its focus away from a BM-centric viewpoint, instead concentrating on the interplay between the TM and the RL. Further experiments using and developing OCT will doubtless aid researchers in addressing questions which have existed unanswered for decades.
Acknowledgments
The authors wish to thank Dr. Suzan Dziennis for critical appraisal of the manuscript, and Dr. Neel Patel for provision of CT imaging of the human cochlea. This review was made with the utmost effort to be comprehensive, and we wish to offer apologies to any authors who have been left out.
Funding: AL Nuttall, GW Burwood, A Fridberger—NIDCD R01 000141. RK Wang—NHLBI R01HL093140 and Washington Research Foundation. A Fridberger—Swedish Research Council 2017-06092. AL Nuttall, GW Burwood—NIH DC005983.
Footnote
Conflicts of Interest: The authors have no conflicts of interest to declare.
References
- Manley GA, Lukashkin A, Simoes P, Burwood G, Russell I. The Mammalian Ear: Physics and the Principles of Evolution. Acoustics Today 2018;14:8-16.
- Robles L, Ruggero MA. Mechanics of the mammalian cochlea. Physiol Rev 2001;81:1305-52. [Crossref] [PubMed]
- Von Békésy G, Wever EG. Experiments in hearing. New York: McGraw-Hill, 1960.
- Rhode WS, Recio A. Study of mechanical motions in the basal region of the chinchilla cochlea. J Acoust Soc Am 2000;107:3317-32. [Crossref] [PubMed]
- Nuttall AL, Dolan DF, Avinash G. Laser Doppler velocimetry of basilar membrane vibration. Hear Res 1991;51:203-13. [Crossref] [PubMed]
- Nilsen KE, Russell IJ. The spatial and temporal representation of a tone on the guinea pig basilar membrane. Proc Natl Acad Sci U S A 2000;97:11751-8. [Crossref] [PubMed]
- Greenwood DD. A cochlear frequency-position function for several species—29 years later. J Acoust Soc Am 1990;87:2592-605. [Crossref] [PubMed]
- Davis H. editor. A model for transducer action in the cochlea. Cold Spring Harbor Symposia on Quantitative Biology; 1965: Cold Spring Harbor Laboratory Press.
- Sellick PM, Russell IJ. The responses of inner hair cells to basilar membrane velocity during low frequency auditory stimulation in the guinea pig cochlea. Hear Res 1980;2:439-45. [Crossref] [PubMed]
- Cheatham MA, Dallos P. Response phase: a view from the inner hair cell. J Acoust Soc Am 1999;105:799-810. [Crossref] [PubMed]
- Dallos P. Cochlear amplification, outer hair cells and prestin. Curr Opin Neurobiol 2008;18:370-6. [Crossref] [PubMed]
- Hudspeth AJ. How the ear's works work: mechanoelectrical transduction and amplification by hair cells. C R Biol 2005;328:155-62. [Crossref] [PubMed]
- Davis H. An active process in cochlear mechanics. Hear Res 1983;9:79-90. [Crossref] [PubMed]
- Johnstone BM, Patuzzi R, Yates GK. Basilar membrane measurements and the travelling wave. Hear Res 1986;22:147-53. [Crossref] [PubMed]
- Rhode WS. Observations of the vibration of the basilar membrane in squirrel monkeys using the Mössbauer technique. J Acoust Soc Am 1971;49 Suppl 2:1218. [Crossref] [PubMed]
- Brownell WE, Bader CR, Bertrand D, de Ribaupierre Y. Evoked mechanical responses of isolated cochlear outer hair cells. Science 1985;227:194-6. [Crossref] [PubMed]
- Mellado Lagarde MM, Drexl M, Lukashkina VA, Lukashkin AN, Russell IJ. Outer hair cell somatic, not hair bundle, motility is the basis of the cochlear amplifier. Nat Neurosci 2008;11:746-8. [Crossref] [PubMed]
- Nuttall AL, Dolan DF. Steady-state sinusoidal velocity responses of the basilar membrane in guinea pig. J Acoust Soc Am 1996;99:1556-65. [Crossref] [PubMed]
- Wang RK, Nuttall AL. Phase-sensitive optical coherence tomography imaging of the tissue motion within the organ of Corti at a subnanometer scale: a preliminary study. J Biomed Opt 2010;15:056005. [Crossref] [PubMed]
- Khanna SM, Willemin JF, Ulfendahl M. Measurement of Optical Reflectivity in Cells of the Inner Ear. Acta Otolaryngol Suppl 1989;467:69-75. [Crossref] [PubMed]
- Recio-Spinoso A, Oghalai JS. Mechanical tuning and amplification within the apex of the guinea pig cochlea. J Physiol 2017;595:4549-61. [Crossref] [PubMed]
- Chakeres DW, Spiegel PK. A systematic technique for comprehensive evaluation of the temporal bone by computed tomography. Radiology 1983;146:97-106. [Crossref] [PubMed]
- Chakeres DW, Weider DJ. Computed tomography of the ossicles. Neuroradiology 1985;27:99-107. [Crossref] [PubMed]
- Kanzara T, Virk JS. Diagnostic performance of high resolution computed tomography in otosclerosis. World J Clin Cases 2017;5:286-91. [Crossref] [PubMed]
- New PF, Bachow TB, Wismer GL, Rosen BR, Brady TJ. MR imaging of the acoustic nerves and small acoustic neuromas at 0.6 T: prospective study. AJR Am J Roentgenol 1985;144:1021-6. [Crossref] [PubMed]
- Naganawa S, Nakashima T. Cutting edge of inner ear MRI. Acta Otolaryngol Suppl 2009;129:15-21. [Crossref] [PubMed]
- Chen D, Phillips CD. Imaging the patient with hearing loss. Applied Radiology 2015;44:10.
- Casselman JW, Kuhweide R, Ampe W, D'Hont G, Offeciers EF, Faes WK, Pattyn G. Inner ear malformations in patients with sensorineural hearing loss: detection with gradient-echo (3DFT-CISS) MRI. Neuroradiology 1996;38:278-86. [Crossref] [PubMed]
- Casselman JW, Offeciers EF, De Foer B, Govaerts P, Kuhweide R, Somers T. CT. Eur J Radiol 2001;40:94-104. [Crossref] [PubMed]
- Daniels DL, Millen SJ, Meyer GA, Pojunas KW, Kilgore DP, Shaffer KA, Williams AL, Haughton VM. MR detection of tumor in the internal auditory canal. AJR Am J Roentgenol 1987;148:1219-22. [Crossref] [PubMed]
- Jackler RK, Shapiro MS, Dillon WP, Pitts L, Lanser MJ. Gadolinium-DTPA enhanced magnetic resonance imaging in acoustic neuroma diagnosis and management. Otolaryngol Head Neck Surg 1990;102:670-7. [Crossref] [PubMed]
- Bettman R, Beek E, Van Olphen A, Zonneveld F, Huizing E. MRI versus CT in assessment of cochlear patency in cochlear implant candidates. Acta Otolaryngol 2004;124:577-81. [Crossref] [PubMed]
- Klein HM, Bohndorf K, Hermes H, Schutz WF, Gunther RW, Schlondorff G. Computed tomography and magnetic resonance imaging in the preoperative work-up for cochlear implantation. Eur J Radiol 1992;15:89-92. [Crossref] [PubMed]
- Lane JI, Ward H, Witte RJ, Bernstein MA, Driscoll CL. 3-T imaging of the cochlear nerve and labyrinth in cochlear-implant candidates: 3D fast recovery fast spin-echo versus 3D constructive interference in the steady state techniques. AJNR Am J Neuroradiol 2004;25:618-22. [PubMed]
- Fukushima M, Oya R, Akazawa H, Tsuruta Y, Inohara H. Gadolinium-enhanced inner ear magnetic resonance imaging for evaluation of delayed endolymphatic hydrops, including a bilateral case. Acta Otolaryngol 2016;136:451-5. [Crossref] [PubMed]
- Nakashima T, Naganawa S, Sugiura M, Teranishi M, Sone M, Hayashi H, Nakata S, Katayama N, Ishida IM. Visualization of endolymphatic hydrops in patients with Meniere's disease. Laryngoscope 2007;117:415-20. [Crossref] [PubMed]
- Nakashima T, Naganawa S, Pyykkö I, Gibson WP, Sone M, Nakata S, Teranishi M. Grading of endolymphatic hydrops using magnetic resonance imaging. Acta Otolaryngol Suppl 2009;129:5-8. [Crossref] [PubMed]
- Yoshida T, Sugimoto S, Teranishi M, Otake H, Yamazaki M, Naganawa S, Nakashima T, Sone M. Imaging of the endolymphatic space in patients with Meniere’s disease. Auris Nasus Larynx 2018;45:33-8. [Crossref] [PubMed]
- Hegarty JL, Patel S, Fischbein N, Jackler RK, Lalwani AK. The value of enhanced magnetic resonance imaging in the evaluation of endocochlear disease. Laryngoscope 2002;112:8-17. [Crossref] [PubMed]
- Naganawa S, Komada T, Fukatsu H, Ishigaki T, Takizawa O. Observation of contrast enhancement in the cochlear fluid space of healthy subjects using a 3D-FLAIR sequence at 3 Tesla. Eur Radiol 2006;16:733-7. [Crossref] [PubMed]
- Nakashima T, Naganawa S, Teranishi M, Tagaya M, Nakata S, Sone M, Otake H, Kato K, Iwata T, Nishio N. Endolymphatic hydrops revealed by intravenous gadolinium injection in patients with Meniere's disease. Acta Otolaryngol 2010;130:338-43. [Crossref] [PubMed]
- Duan M, Bjelke B, Fridberger A, Counter SA, Klason T, Skjonsberg A, Herrlin P, Borg E, Laurell G. Imaging of the guinea pig cochlea following round window gadolinium application. Neuroreport 2004;15:1927-30. [Crossref] [PubMed]
- Whiting BR, Holden TA, Brunsden BS, Finley CC, Skinner MW. Use of Computed Tomography Scans for Cochlear Implants. J Digit Imaging 2008;21:323-8. [Crossref] [PubMed]
- Dai M, Nuttall A, Yang Y, Shi X. Visualization and contractile activity of cochlear pericytes in the capillaries of the spiral ligament. Hear Res 2009;254:100-7. [Crossref] [PubMed]
- Axelsson A, Nuttall AL, Miller JM. Observations of cochlear microcirculation using intravital microscopy. Acta Otolaryngol 1990;109:263-70. [Crossref] [PubMed]
- LaRouere MJ, Sillman J, Nuttall A, Miller J. A comparison of laser Doppler and intravital microscopic measures of cochlear blood flow. Otolaryngol Head Neck Surg 1989;101:375-84. [Crossref] [PubMed]
- Weigert R, Porat-Shliom N, Amornphimoltham P. Imaging cell biology in live animals: Ready for prime time. J Cell Biol 2013;201:969-79. [Crossref] [PubMed]
- Lieu D. Ultrasound Physics and Instrumentation for Pathologists. Arch Pathol Lab Med 2010;134:1541-56. [PubMed]
- Brown JA, Torbatian Z, Adamson RB, Van Wijhe R, Pennings RJ, Lockwood GR, Bance ML. High-frequency ex vivo ultrasound imaging of the auditory system. Ultrasound Med Biol 2009;35:1899-907. [Crossref] [PubMed]
- Landry TG, Rainsbury JW, Adamson RB, Bance ML, Brown JA. Real-time imaging of in-vitro human middle ear using high frequency ultrasound. Hear Res 2015;326:1-7. [Crossref] [PubMed]
- Landry TG, Bance ML, Leadbetter J, Adamson RB, Brown JA. In vivo measurement of basilar membrane vibration in the unopened chinchilla cochlea using high frequency ultrasound. J Acoust Soc Am 2017;141:4610-21. [Crossref] [PubMed]
- Johnstone BM, Boyle AJ. Basilar membrane vibration examined with the Mossbauer technique. Science 1967;158:389-90. [Crossref] [PubMed]
- Sellick PM, Patuzzi R, Johnstone B. Measurement of basilar membrane motion in the guinea pig using the Mössbauer technique. J Acoust Soc Am 1982;72:131. [Crossref] [PubMed]
- Kohllöffel LUE. A Study of Basilar Membrane Vibrations III. The Basilar Membrane Frequency Response Curve in the Living Guinea Pig. Acustica 1972;27:82-9.
- Wilson J. A sub-miniature capacitive probe for vibration measurements of the basilar membrane. Journal of Sound Vibration 1973;30:483-93. [Crossref]
- Wilson JP, Johnstone JR. Basilar membrane and middle-ear vibration in guinea pig measured by capacitive probe. J Acoust Soc Am 1975;57:705-23. [Crossref] [PubMed]
- Le Page EL, Johnstone BM. Nonlinear mechanical behaviour of the basilar membrane in the basal turn of the guinea pig cochlea. Hear Res 1980;2:183-9. [Crossref] [PubMed]
- Cooper NP, Rhode WS. Basilar membrane mechanics in the hook region of cat and guinea-pig cochleae: sharp tuning and nonlinearity in the absence of baseline position shifts. Hear Res 1992;63:163-90. [Crossref] [PubMed]
- Ruggero MA, Rich NC. Application of a commercially-manufactured Doppler-shift laser velocimeter to the measurement of basilar-membrane vibration. Hear Res 1991;51:215-30. [Crossref] [PubMed]
- Narayan SS, Temchin AN, Recio A, Ruggero MA. Frequency tuning of basilar membrane and auditory nerve fibers in the same cochleae. Science 1998;282:1882-4. [Crossref] [PubMed]
- Nuttall AL, Ricci AJ, Burwood G, Harte JM, Stenfelt S, Cayé-Thomasen P, Ren T, Ramamoorthy S, Zhang Y, Wilson T, Lunner T, Moore BCJ, Fridberger A. A mechanoelectrical mechanism for detection of sound envelopes in the hearing organ. Nat Commun 2018;9:4175. [Crossref] [PubMed]
- Nowotny M, Gummer AW. Vibration responses of the organ of Corti and the tectorial membrane to electrical stimulation. J Acoust Soc Am 2011;130:3852-72. [Crossref] [PubMed]
- Cooper NP. An improved heterodyne laser interferometer for use in studies of cochlear mechanics. J Neurosci Methods 1999;88:93-102. [Crossref] [PubMed]
- Willemin JF, Dandliker R, Khanna SM. Heterodyne interferometer for submicroscopic vibration measurements in the inner ear. J Acoust Soc Am 1988;83:787-95. [Crossref] [PubMed]
- Hao LF, Khanna SM. Reissner's membrane vibrations in the apical turn of a living guinea pig cochlea. Hear Res 1996;99:176-89. [Crossref] [PubMed]
- Khanna SM, Hao LF. Nonlinearity in the apical turn of living guinea pig cochlea. Hear Res 1999;135:89-104. [Crossref] [PubMed]
- Khanna SM, Hao LF. Amplification in the apical turn of the cochlea with negative feedback. Hear Res 2000;149:55-76. [Crossref] [PubMed]
- Fridberger A, de Monvel JB, Zheng J, Hu N, Zou Y, Ren T, Nuttall A. Organ of Corti potentials and the motion of the basilar membrane. J Neurosci 2004;24:10057-63. [Crossref] [PubMed]
- Jacob S, Johansson C, Ulfendahl M, Fridberger A. A digital heterodyne laser interferometer for studying cochlear mechanics. J Neurosci Methods 2009;179:271-7. [Crossref] [PubMed]
- Hakizimana P, Brownell WE, Jacob S, Fridberger A. Sound-induced length changes in outer hair cell stereocilia. Nat Commun 2012;3:1094. [Crossref] [PubMed]
- Ciganović N, Warren RL, Keçeli B, Jacob S, Fridberger A, Reichenbach T. Static length changes of cochlear outer hair cells can tune low-frequency hearing. PLoS Comput Biol 2018;14:e1005936. [Crossref] [PubMed]
- Strimbu CE, Prasad S, Hakizimana P, Fridberger A. Control of hearing sensitivity by tectorial membrane calcium. Proc Natl Acad Sci U S A 2019;116:5756-64. [Crossref] [PubMed]
- Karavitaki KD, Mountain DC. Imaging Electrically Evoked Micromechanical Motion within the Organ of Corti of the Excised Gerbil Cochlea. Biophys J 2007;92:3294-316. [Crossref] [PubMed]
- Lukashkin AN, Walling MN, Russell IJ. Power amplification in the mammalian cochlea. Curr Biol 2007;17:1340-4. [Crossref] [PubMed]
- Russell IJ, Nilsen KE. The location of the cochlear amplifier: spatial representation of a single tone on the guinea pig basilar membrane. Proc Natl Acad Sci U S A 1997;94:2660-4. [Crossref] [PubMed]
- Nilsen KE, Russell IJ. Timing of cochlear feedback: spatial and temporal representation of a tone across the basilar membrane. Nat Neurosci 1999;2:642-8. [Crossref] [PubMed]
- Legan PK, Lukashkina VA, Goodyear RJ, Kössl M, Russell IJ, Richardson GP. A targeted deletion in α-tectorin reveals that the tectorial membrane is required for the gain and timing of cochlear feedback. Neuron 2000;28:273-85. [Crossref] [PubMed]
- Mellado Lagarde MM, Drexl M, Lukashkin AN, Zuo J, Russell IJ. Prestin's role in cochlear frequency tuning and transmission of mechanical responses to neural excitation. Curr Biol 2008;18:200-2. [Crossref] [PubMed]
- Lukashkin AN, Lukashkina VA, Legan PK, Richardson GP, Russell IJ. Role of the tectorial membrane revealed by otoacoustic emissions recorded from wild-type and transgenic TectaδENT/δENT mice. J Neurophysiol 2004;91:163-71. [Crossref] [PubMed]
- Lukashkin AN, Legan PK, Weddell TD, Lukashkina VA, Goodyear RJ, Welstead LJ, Petit C, Russell IJ, Richardson GP. A mouse model for human deafness DFNB22 reveals that hearing impairment is due to a loss of inner hair cell stimulation. Proc Natl Acad Sci U S A 2012;109:19351-6. [Crossref] [PubMed]
- Lukashkina VA, Levic S, Lukashkin AN, Strenzke N, Russell IJ. A connexin30 mutation rescues hearing and reveals roles for gap junctions in cochlear amplification and micromechanics. Nat Commun 2017;8:14530. [Crossref] [PubMed]
- Lukashkina VA, Yamashita T, Zuo J, Lukashkin AN, Russell IJ. Amplification mode differs along the length of the mouse cochlea as revealed by connexin 26 deletion from specific gap junctions. Sci Rep 2017;7:5185. [Crossref] [PubMed]
- Russell IJ, Legan PK, Lukashkina VA, Lukashkin AN, Goodyear RJ, Richardson GP. Sharpened cochlear tuning in a mouse with a genetically modified tectorial membrane. Nat Neurosci 2007;10:215-23. [Crossref] [PubMed]
- Murugasu E, Russell IJ. The effect of efferent stimulation on basilar membrane displacement in the basal turn of the guinea pig cochlea. J Neurosci 1996;16:325-32. [Crossref] [PubMed]
- Olson ES. Direct measurement of intra-cochlear pressure waves. Nature 1999;402:526-9. [Crossref] [PubMed]
- Olson ES. Intracochlear pressure measurements related to cochlear tuning. J Acoust Soc Am 2001;110:349-67. [Crossref] [PubMed]
- Olson ES. Harmonic distortion in intracochlear pressure and its analysis to explore the cochlear amplifier. J Acoust Soc Am 2004;115:1230-41. [Crossref] [PubMed]
- Dong W, Olson ES. Two-tone distortion in intracochlear pressure. J Acoust Soc Am 2005;117:2999-3015. [Crossref] [PubMed]
- Dong W, Olson ES. Supporting evidence for reverse cochlear traveling waves. J Acoust Soc Am 2008;123:222-40. [Crossref] [PubMed]
- Dong W, Olson ES. Detection of cochlear amplification and its activation. Biophys J 2013;105:1067-78. [Crossref] [PubMed]
- Dong W, Olson ES. Two-Tone Suppression of Simultaneous Electrical and Mechanical Responses in the Cochlea. Biophys J 2016;111:1805-15. [Crossref] [PubMed]
- He W, Kemp D, Ren T. Timing of the reticular lamina and basilar membrane vibration in living gerbil cochleae. eLife 2018;7:e37625. [Crossref] [PubMed]
- Ren T, He W, Barr-Gillespie PG. Reverse transduction measured in the living cochlea by low-coherence heterodyne interferometry. Nat Commun 2016;7:10282. [Crossref] [PubMed]
- Nuttall AL, Fridberger A. Instrumentation for studies of cochlear mechanics: from von Bekesy forward. Hear Res 2012;293:3-11. [Crossref] [PubMed]
- Fercher AF, Drexler W, Hitzenberger CK, Lasser T. Optical coherence tomography-principles and applications. Rep Prog Phys 2003;66:239. [Crossref]
- Tomlins PH, Wang R. Theory, developments and applications of optical coherence tomography. J Phys Condens Matter 2005;38:2519.
- Huang D, Swanson EA, Lin CP, Schuman JS, Stinson WG, Chang W, Hee MR, Flotte T, Gregory K, Puliafito CA. Optical coherence tomography. Science 1991;254:1178-81. [Crossref] [PubMed]
- Wang RK. Signal degradation by multiple scattering in optical coherence tomography of dense tissue: a Monte Carlo study towards optical clearing of biotissues. Phys Med Biol 2002;47:2281. [Crossref] [PubMed]
- Schmitt JM. Optical coherence tomography (OCT): a review. IEEE J Sel Top Quantum Electron 1999;5:1205-15. [Crossref]
- Xi J, Huo L, Li J, Li X. Generic real-time uniform K-space sampling method for high-speed swept-Source optical coherence tomography. Opt Express 2010;18:9511-7. [Crossref] [PubMed]
- Vakoc B, Yun S, De Boer J, Tearney G, Bouma B. Phase-resolved optical frequency domain imaging. Opt Express 2005;13:5483-93. [Crossref] [PubMed]
- Baumann B, Potsaid B, Kraus MF, Liu JJ, Huang D, Hornegger J, Cable AE, Duker JS, Fujimoto JG. Total retinal blood flow measurement with ultrahigh speed swept source/Fourier domain OCT. Biomed Opt Express 2011;2:1539-52. [Crossref] [PubMed]
- Choi W, Potsaid B, Jayaraman V, Baumann B, Grulkowski I, Liu JJ, Lu CD, Cable AE, Huang D, Duker JS. Phase-sensitive swept-source optical coherence tomography imaging of the human retina with a vertical cavity surface-emitting laser light source. Opt Lett 2013;38:338-40. [Crossref] [PubMed]
- Zhang J, Chen Z. In vivo blood flow imaging by a swept laser source based Fourier domain optical Doppler tomography. Opt Express 2005;13:7449-57. [Crossref] [PubMed]
- Lee HY, Raphael PD, Park J, Ellerbee AK, Applegate BE, Oghalai JS. Noninvasive in vivo imaging reveals differences between tectorial membrane and basilar membrane traveling waves in the mouse cochlea. Proc Natl Acad Sci U S A 2015;112:3128-33. [Crossref] [PubMed]
- Song S, Xu J, Men S, Shen TT, Wang RK. Robust numerical phase stabilization for long-range swept-source optical coherence tomography. J Biophotonics 2017;10:1398-410. [Crossref] [PubMed]
- Born M, Wolf E. Principles of Optics 6th ed. Pergamon; 1980.
- Zhang A, Zhang Q, Chen CL, Wang RK. Methods and algorithms for optical coherence tomography-based angiography: a review and comparison. J Biomed Opt 2015;20:100901. [Crossref] [PubMed]
- Chen CL, Wang RK. Optical coherence tomography based angiography. Biomed Opt Express 2017;8:1056-82. [Crossref] [PubMed]
- Fingler J, Zawadzki RJ, Werner JS, Schwartz D, Fraser SE. Volumetric microvascular imaging of human retina using optical coherence tomography with a novel motion contrast technique. Opt Express 2009;17:22190-200. [Crossref] [PubMed]
- Barton J, Stromski S. Flow measurement without phase information in optical coherence tomography images. Opt Express 2005;13:5234-9. [Crossref] [PubMed]
- Mariampillai A, Standish BA, Moriyama EH, Khurana M, Munce NR, Leung MK, Jiang J, Cable A, Wilson BC, Vitkin IA. Speckle variance detection of microvasculature using swept-source optical coherence tomography. Opt Lett 2008;33:1530-2. [Crossref] [PubMed]
- Wang RK. Biology. Three-dimensional optical micro-angiography maps directional blood perfusion deep within microcirculation tissue beds in vivo. Phys Med Biol 2007;52.
- Wang RK, An L, Francis P, Wilson DJ. Depth-resolved imaging of capillary networks in retina and choroid using ultrahigh sensitive optical microangiography. Opt Lett 2010;35:1467-9. [Crossref] [PubMed]
- Xu J, Song S, Li Y, Wang RK. Complex-based OCT angiography algorithm recovers microvascular information better than amplitude-or phase-based algorithms in phase-stable systems. Phys Med Biol 2017;63:015023. [Crossref] [PubMed]
- Wang RK, Jacques SL, Ma Z, Hurst S, Hanson SR, Gruber A. Three dimensional optical angiography. Opt Express 2007;15:4083-97. [Crossref] [PubMed]
- An L, Qin J, Wang RK. Ultrahigh sensitive optical microangiography for in vivo imaging of microcirculations within human skin tissue beds. Opt Express 2010;18:8220-8. [Crossref] [PubMed]
- Yousefi S, Zhi Z, Wang RK. Eigendecomposition-based clutter filtering technique for optical microangiography. IEEE Trans Biomed Eng 2011;58:2316. [Crossref] [PubMed]
- Zhang Q, Wang J, Wang RK. Highly efficient eigen decomposition based statistical optical microangiography. Quant Imaging Med Surg 2016;6:557. [Crossref] [PubMed]
- Le N, Song S, Zhang Q, Wang RK. Robust principal component analysis in optical micro-angiography. Quant Imaging Med Surg 2017;7:654. [Crossref] [PubMed]
- Reif R, Zhi Z, Dziennis S, Nuttall AL, Wang RK. surgery. Changes in cochlear blood flow in mice due to loud sound exposure measured with Doppler optical microangiography and laser Doppler flowmetry. Quant Imaging Med Surg 2013;3:235-42. [PubMed]
- Reif R, Qin J, Shi L, Dziennis S, Zhi Z, Nuttall AL, Wang RK. Monitoring hypoxia induced changes in cochlear blood flow and hemoglobin concentration using a combined dual-wavelength laser speckle contrast imaging and Doppler optical microangiography system. PLoS One 2012;7:e52041. [Crossref] [PubMed]
- Dziennis S, Reif R, Zhi Z, Nuttall AL, Wang RK. Effects of hypoxia on cochlear blood flow in mice evaluated using Doppler optical microangiography. J Biomed Opt 2012;17:106003. [Crossref] [PubMed]
- Subhash HM, Davila V, Sun H, Nguyen-Huynh AT, Shi X, Nuttall AL, Wang RK. Volumetric in vivo imaging of microvascular perfusion within the intact cochlea in mice using ultra-high sensitive optical microangiography. IEEE Trans Med Imaging 2011;30:224-30. [Crossref] [PubMed]
- Wang RK, Ma Z, Kirkpatrick SJ. Tissue Doppler optical coherence elastography for real time strain rate and strain mapping of soft tissue. Applied Physics Letters 2006;89:144103. [Crossref]
- Wang RK, Kirkpatrick S, Hinds M. Phase-sensitive optical coherence elastography for mapping tissue microstrains in real time. Applied Physics Letters 2007;90:164105. [Crossref]
- Smith LM, Dobson CC. Absolute displacement measurements using modulation of the spectrum of white light in a Michelson interferometer. Applied Optics 1989;28:3339-42. [Crossref] [PubMed]
- Wong BJ, de Boer JF, Park BH, Chen Z, Nelson JS. Optical coherence tomography of the rat cochlea. J Biomed Opt 2000;5:367-70. [Crossref] [PubMed]
- Iyer JS, Batts SA, Chu KK, Sahin MI, Leung HM, Tearney GJ, Stankovic KM. Micro-optical coherence tomography of the mammalian cochlea. Sci Rep 2016;6:33288. [Crossref] [PubMed]
- Yamaguchi MK, de Boer JF, Park BH, Nassif N, Zhao Y, Chen Z, Wong BJ-F, editors. Imaging the internal structure of the guinea pig cochlea using optical coherence tomography at 1310 nm. Lasers in Surgery: Advanced Characterization, Therapeutics, and Systems XI; 2001: International Society for Optics and Photonics.
- Wong BJ, Zhao Y, Yamaguchi M, Nassif N, Chen Z, De Boer JF. Imaging the internal structure of the rat cochlea using optical coherence tomography at 0.827 µm and 1.3 µm. Otolaryngol Head Neck Surg 2004;130:334-8. [Crossref] [PubMed]
- Tona Y, Sakamoto T, Nakagawa T, Adachi T, Taniguchi M, Torii H, Hamaguchi K, Kitajiri S, Ito J. In vivo imaging of mouse cochlea by optical coherence tomography. Otol Neurotol 2014;35:e84-9. [Crossref] [PubMed]
- Karvonen T, Uranishi Y, Sakamoto T, Tona Y, Okamoto K, Tamura H, Kuroda T. Estimation of the degree of endolymphatic hydrops using optical coherence tomography. Advanced Biomedical Engineering 2016;5:19-25. [Crossref]
- Liu GS, Kim J, Applegate BE, Oghalai JS. Computer-aided detection and quantification of endolymphatic hydrops within the mouse cochlea in vivo using optical coherence tomography. J Biomed Opt 2017;22:76002. [Crossref] [PubMed]
- Cho NH, Lee JW, Cho JH, Kim J, Jang JH, Jung W. Evaluation of the usefulness of three-dimensional optical coherence tomography in a guinea pig model of endolymphatic hydrops induced by surgical obliteration of the endolymphatic duct. J Biomed Opt 2015;20:036009. [Crossref] [PubMed]
- Gao SS, Xia A, Yuan T, Raphael PD, Shelton RL, Applegate BE, Oghalai JS. Quantitative imaging of cochlear soft tissues in wild-type and hearing-impaired transgenic mice by spectral domain optical coherence tomography. Opt Express 2011;19:15415-28. [Crossref] [PubMed]
- Mohebbi S, Diaz JD, Kühnel MP, Durisin M, Rau T, Mirsalehi M, Ripken T, Meyer H, Lenarz T, Majdani O. Optical Coherence Tomography (OCT) guided inner ear decalcification, fast and safe method. J Biomed Tech 2014;59:564-7.
- Lee J, Kim K, Wijesinghe RE, Jeon D, Lee SH, Jeon M, Jang JH. Decalcification using ethylenediaminetetraacetic acid for clear microstructure imaging of cochlea through optical coherence tomography. J Biomed Opt 2016;21:081204. [Crossref] [PubMed]
- Staecker H, Do KL, Jafir S. Optical coherence tomography: Temporal bone applications. Otolaryngol Head Neck Surg 2004;131:160. [Crossref]
- Lin J, Staecker H, Jafri MS. Optical coherence tomography imaging of the inner ear: a feasibility study with implications for cochlear implantation. Ann Otol Rhinol Laryngol 2008;117:341-6. [Crossref] [PubMed]
- Sepehr A, Djalilian HR, Chang JE, Chen Z, Wong BJ. Optical coherence tomography of the cochlea in the porcine model. Laryngoscope 2008;118:1449-51. [Crossref] [PubMed]
- Mohebbi S, Mirsalehi M, Kahrs LA, Ortmaier T, Lenarz T, Majdani O. Experimental Visualization of Labyrinthine Structure with Optical Coherence Tomography. Iran J Otorhinolaryngol 2017;29:5-9. [PubMed]
- Pau HW, Lankenau E, Just T, Behrend D, Hüttmann G. Optical coherence tomography as an orientation guide in cochlear implant surgery? Acta Otolaryngol 2007;127:907-13. [Crossref] [PubMed]
- Lankenau E, Klinger D, Winter C, Malik A, Müller HH, Oelckers S, Pau H-W, Just T, Hüttmann G. Combining optical coherence tomography (OCT) with an operating microscope. Advances in medical engineering. Springer, 2007:343-8.
- Lankenau E, Klinger D, Müller HH, Malik A, Winter C, Giese A, Oelckers S, Just T, Hüttmann G. [3.01] 3-D intraoperative imaging combining an operating microscope with optical coherence tomography (OCT). Medical Laser Application 2009;24:127. [Crossref]
- Klenzner T, Knapp FB, Schipper J, Raczkowsky J, Woern H, Kahrs LA, Werner M. Hering PJCii. High precision cochleostomy by use of a pulsed CO2 laser–an experimental approach. Cochlear Implants Int 2009;10:58-62. [Crossref] [PubMed]
- Zhang Y, Pfeiffer T, Weller M, Wieser W, Huber R, Raczkowsky J, Schipper J, Worn H, Klenzner T. Optical coherence tomography guided laser cochleostomy: towards the accuracy on tens of micrometer scale. Biomed Res Int 2014;2014:251814. [Crossref] [PubMed]
- Romito M, Stankovic KM, Psaltis D, editors. Imaging of cochlear cells through scattering bone. Laser Science; 2018: Optical Society of America.
- Burkhardt A, Walther J, Cimalla P, Mehner M, Koch E. Endoscopic optical coherence tomography device for forward imaging with broad field of view. J Biomed Opt 2012;17:071302. [Crossref] [PubMed]
- Pitris C, Saunders KT, Fujimoto JG, Brezinski ME. High-resolution imaging of the middle ear with optical coherence tomography: a feasibility study. Arch Otolaryngol Head Neck Surg 2001;127:637-42. [Crossref] [PubMed]
- Dsouza R, Won J, Monroy GL, Hill MC, Porter RG, Novak MA, Boppart SA. In vivo detection of nanometer-scale structural changes of the human tympanic membrane in otitis media. Sci Rep 2018;8:8777. [Crossref] [PubMed]
- Nguyen CT, Jung W, Kim J, Chaney EJ, Novak M, Stewart CN, Boppart SA. Noninvasive in vivo optical detection of biofilm in the human middle ear. Proc Natl Acad Sci U S A 2012;109:9529-34. [Crossref] [PubMed]
- Cho NH, Lee SH, Jung W, Jang JH, Kim J. Optical coherence tomography for the diagnosis and evaluation of human otitis media. J Korean Med Sci 2015;30:328-35. [Crossref] [PubMed]
- Monroy GL, Pande P, Shelton RL, Nolan RM, Spillman DR Jr, Porter RG, Novak MA, Boppart SA. Non-invasive optical assessment of viscosity of middle ear effusions in otitis media. J Biophotonics 2017;10:394-403. [Crossref] [PubMed]
- Just T, Lankenau E, Hüttmann G, Pau H. Optical coherence tomography of the oval window niche. J Laryngol Otol 2009;123:603-8. [Crossref] [PubMed]
- Schuknecht HF, Watanuki K, Takahashi T, Belal AA Jr, Kimura RS, Jones DD, Ota CY. Atrophy of the stria vascularis, a common cause for hearing loss. Laryngoscope 1974;84:1777-821. [Crossref] [PubMed]
- Schulte BA, Schmiedt RA. Lateral wall Na-K-ATPase and endocochlear potentials decline with age in quiet-reared gerbils. Hear Res 1992;61:35-46. [Crossref] [PubMed]
- Gratton MA, Schulte BA. Alterations in microvasculature are associated with atrophy of the stria vascularis in quiet-aged gerbils. Hear Res 1995;82:44-52. [Crossref] [PubMed]
- Spicer SS, Schulte BA. Spiral ligament pathology in quiet-aged gerbils. Hear Res 2002;172:172-85. [Crossref] [PubMed]
- Gates GA, Mills JH. Presbycusis. Lancet 2005;366:1111-20. [Crossref] [PubMed]
- Kubisch C, Schroeder BC, Friedrich T, Lütjohann B, El-Amraoui A, Marlin S, Petit C, Jentsch TJ. KCNQ4, a novel potassium channel expressed in sensory outer hair cells, is mutated in dominant deafness. Cell 1999;96:437-46. [Crossref] [PubMed]
- Birkenhäger R, Otto E, Schurmann MJ, Vollmer M, Ruf EM, Maier-Lutz I, Beekmann F, Fekete A, Omran H, Feldmann D, Milford DV, Jeck N, Konrad M, Landau D, Knoers NV, Antignac C, Sudbrak R, Kispert A, Hildebrandt F. Mutation of BSND causes Bartter syndrome with sensorineural deafness and kidney failure. Nat Genet 2001;29:310-4. [Crossref] [PubMed]
- Gow A, Davies C, Southwood CM, Frolenkov G, Chrustowski M, Ng L, Yamauchi D, Marcus DC, Kachar B. Deafness in Claudin 11-null mice reveals the critical contribution of basal cell tight junctions to stria vascularis function. J Neurosci 2004;24:7051-62. [Crossref] [PubMed]
- Brown JN, Nuttall AL. Autoregulation of cochlear blood flow in guinea pigs. Am J Physiol 1994;266:H458-67. [PubMed]
- Axelsson A, Dengerink H. The effects of noise on histological measures of the cochlear vasculature and red blood cells: a review. Hear Res 1987;31:183-91. [Crossref] [PubMed]
- Lamm K, Arnold W. Noise-induced cochlear hypoxia is intensity dependent, correlates with hearing loss and precedes reduction of cochlear blood flow. Audiology Neurotology 1996;1:148-60. [Crossref] [PubMed]
- Nakashima T, Suzuki T, Morisaki H, Yanagita N. How i do it: Otology and neurotology: A specific issue and its solution: Measurement of cochlear blood flow in sudden deafness. Laryngoscope 1992;102:1308-10. [Crossref] [PubMed]
- Fisch U, Murata K, Hossli G. Measurement of oxygen tension in human perilymph. Acta Otolaryngol 1976;81:278-82. [Crossref] [PubMed]
- Thorne PR, Nuttall AL, Scheibe F, Miller JM. Sound-induced artifact in cochlear blood flow measurements using the laser Doppler flowmeter. Hear Res 1987;31:229-34. [Crossref] [PubMed]
- Thorne PR, Nuttall AL. Laser Doppler measurements of cochlear blood flow during loud sound exposure in the guinea pig. Hear Res 1987;27:1-10. [Crossref] [PubMed]
- Ren T, Brechtelsbauer PB, Miller JM, Nuttall AL. Cochlear blood flow measured by averaged laser Doppler flowmetry (ALDF). Hear Res 1994;77:200-6. [Crossref] [PubMed]
- Nuttall AL. Cochlear blood flow: measurement techniques. Am J Otolaryngol 1988;9:291-301. [Crossref] [PubMed]
- Gao SS, Jia Y, Zhang M, Su JP, Liu G, Hwang TS, Bailey ST, Huang D. Optical coherence tomography angiography. Invest Ophthalmol Vis Sci 2016;57:27-36. [Crossref] [PubMed]
- Chen Z, Milner TE, Srinivas S, Wang X, Malekafzali A, van Gemert MJ, Nelson JS. Noninvasive imaging of in vivo blood flow velocity using optical Doppler tomography. Opt Lett 1997;22:1119-21. [Crossref] [PubMed]
- Wang RK, An L. Doppler optical micro-angiography for volumetric imaging of vascular perfusion in vivo. Opt Express 2009;17:8926-40. [Crossref] [PubMed]
- Tokayer J, Jia Y, Dhalla AH, Huang D. Blood flow velocity quantification using split-spectrum amplitude-decorrelation angiography with optical coherence tomography. Biomed Opt Express 2013;4:1909-24. [Crossref] [PubMed]
- Choi WJ, Qin W, Chen CL, Wang J, Zhang Q, Yang X, Gao BZ, Wang RK. Characterizing relationship between optical microangiography signals and capillary flow using microfluidic channels. Biomed Opt Express 2016;7:2709-28. [Crossref] [PubMed]
- Zhu J, Merkle CW, Bernucci MT, Chong SP, Srinivasan VJ. Can OCT angiography be made a quantitative blood measurement tool? Appl Sci 2017;7:687. [Crossref] [PubMed]
- Wang RK, Zhang Q, Li Y, Song S. Optical coherence tomography angiography-based capillary velocimetry. J Biomed Opt 2017;22:66008. [Crossref] [PubMed]
- Choudhury N, Song G, Chen F, Matthews S, Tschinkel T, Zheng J, Jacques SL, Nuttall AL. Low coherence interferometry of the cochlear partition. Hear Res 2006;220:1-9. [Crossref] [PubMed]
- Dalhoff E, Gärtner R, Hofbauer U, Tiziani H, Zenner HP, Gummer AW. Low-coherence fibre heterodyne interferometer for both dc and high-frequency vibration measurements in the inner ear. Journal of Modern Optics 1998;45:765-75. [Crossref]
- Hong SS, Freeman DM. Doppler optical coherence microscopy for studies of cochlear mechanics. J Biomed Opt 2006;11:054014. [Crossref] [PubMed]
- Cooper N. Radial variation in the vibrations of the cochlear partition. Recent Developments In Auditory Mechanics: (Including Free CD-ROM). World Scientific 2000:109-15.
- Chen F, Choudhury N, Zheng J, Matthews S, Nutall AL, Jacques SL. In vivo imaging and low-coherence interferometry of organ of Corti vibration. J Biomed Opt 2007;12:021006. [Crossref] [PubMed]
- Warren RL, Ramamoorthy S, Ciganovic N, Zhang Y, Wilson TM, Petrie T, Wang RK, Jacques SL, Reichenbach T, Nuttall AL, Fridberger A. Minimal basilar membrane motion in low-frequency hearing. Proc Natl Acad Sci U S A 2016;113:E4304-10. [Crossref] [PubMed]
- Chen F, Zha D, Fridberger A, Zheng J, Choudhury N, Jacques SL, Wang RK, Shi X, Nuttall AL. A differentially amplified motion in the ear for near-threshold sound detection. Nat Neurosci 2011;14:770-4. [Crossref] [PubMed]
- Zha D, Chen F, Ramamoorthy S, Fridberger A, Choudhury N, Jacques SL, Wang RK, Nuttall AL. In vivo outer hair cell length changes expose the active process in the cochlea. PLoS One 2012;7:e32757. [Crossref] [PubMed]
- Ramamoorthy S, Zha D, Chen F, Jacques SL, Wang R, Choudhury N, Nuttall AL, Fridberger A. Filtering of acoustic signals within the hearing organ. J Neurosci 2014;34:9051-8. [Crossref] [PubMed]
- Strimbu CE, Lin NC, Olson ES. Optical coherence tomography reveals complex motion between the basilar membrane and organ of corti in the gerbil cochlea. OCT News 2018;143:1898.
- Cooper NP, Rhode WS. Nonlinear mechanics at the apex of the guinea-pig cochlea. Hear Res 1995;82:225-43. [Crossref] [PubMed]
- Dong W, Xia A, Raphael PD, Puria S, Applegate BE, Oghalai JS. Organ of Corti vibration within the intact gerbil cochlea measured by volumetric optical coherence tomography and vibrometry. J Neurophysiol 2018;120:2847-57. [Crossref] [PubMed]
- Recio-Spinoso A, Oghalai JS. Unusual mechanical processing of sounds at the apex of the guinea pig cochlea. Hear Res 2018;370:84-93. [Crossref] [PubMed]
- Cooper NP, Rhode WS. Fast travelling waves, slow travelling waves and their interactions in experimental studies of apical cochlear mechanics. Auditory Neuroscience 1996;2:207-17.
- Ramamoorthy S, Zhang Y, Petrie T, Fridberger A, Ren T, Wang R, Jacques SL, Nuttall AL. Minimally invasive surgical method to detect sound processing in the cochlear apex by optical coherence tomography. J Biomed Opt 2016;21:25003. [Crossref] [PubMed]
- Ulfendahl M, Khanna SM, Löfstrand P. Changes in the mechanical tuning characteristics of the hearing organ following acoustic overstimulation. Eur J Neurosci 1993;5:713-23. [Crossref] [PubMed]
- Nakajima H, Olson E, Mountain D, Hubbard A. Acoustic overstimulation enhances low-frequency electrically-evoked otoacoustic emissions and reduces high-frequency emissions. Auditory Neuroscience 1996;3:79-99.
- Jacob S, Johansson C, Fridberger A. Noise-induced alterations in cochlear mechanics, electromotility, and cochlear amplification. Pflugers Arch 2013;465:907-17. [Crossref] [PubMed]
- Lin NC, Fallah E, Strimbu CE, Hendon CP, Olson ES. Scanning optical coherence tomography probe for in vivo imaging and displacement measurements in the cochlea. Biomed Opt Express 2019;10:1032-43. [Crossref] [PubMed]
- Allen JB. Cochlear micromechanics--a physical model of transduction. J Acoust Soc Am 1980;68:1660-70. [Crossref] [PubMed]
- Zwislocki JJ. Five decades of research on cochlear mechanics. J Acoust Soc Am 1980;67:1679-85. [PubMed]
- Gummer AW, Hemmert W, Zenner HP. Resonant tectorial membrane motion in the inner ear: its crucial role in frequency tuning. Proc Natl Acad Sci U S A 1996;93:8727-32. [Crossref] [PubMed]
- Ghaffari R, Aranyosi AJ, Freeman DM. Longitudinally propagating traveling waves of the mammalian tectorial membrane. Proc Natl Acad Sci U S A 2007;104:16510-5. [Crossref] [PubMed]
- Ghaffari R, Aranyosi AJ, Richardson GP, Freeman DM. Tectorial membrane travelling waves underlie abnormal hearing in Tectb mutant mice. Nat Commun 2010;1:96. [Crossref] [PubMed]
- Meaud J, Grosh K. The effect of tectorial membrane and basilar membrane longitudinal coupling in cochlear mechanics. J Acoust Soc Am 2010;127:1411-21. [Crossref] [PubMed]
- Jones GP, Lukashkina VA, Russell IJ, Elliott SJ, Lukashkin AN. Frequency-dependent properties of the tectorial membrane facilitate energy transmission and amplification in the cochlea. Biophys J 2013;104:1357-66. [Crossref] [PubMed]
- Sellon JB, Ghaffari R, Farrahi S, Richardson GP, Freeman DM. Porosity controls spread of excitation in tectorial membrane traveling waves. Biophys J 2014;106:1406-13. [Crossref] [PubMed]
- Farrahi S, Sellon J.B, Ghaffari,R, and, Freeman DM. The Role of Tectorial Membrane Stiffness and Viscosity on Traveling Waves and Cochlear Tuning. Mechanics of Hearing 12th International Workshop; Cape Sounio, Greece, 2014: American Institute of Physics; 2014.
- Sellon JB, Farrahi S, Ghaffari R, Freeman DM. Longitudinal spread of mechanical excitation through tectorial membrane traveling waves. Proc Natl Acad Sci U S A 2015;112:12968-73. [Crossref] [PubMed]
- Lee HY, Raphael PD, Xia A, Kim J, Grillet N, Applegate BE, Bowden AKE. Oghalai JSJJoN. Two-dimensional cochlear micromechanics measured in vivo demonstrate radial tuning within the mouse organ of Corti. J Neurosci 2016;36:8160-73. [Crossref] [PubMed]
- Subhash HM, Choudhury N, Chen F, Wang RK, Jacques SL, Nuttall AL. Depth-resolved dual-beamlet vibrometry based on Fourier domain low coherence interferometry. J Biomed Opt 2013;18:036003. [Crossref] [PubMed]
- Dewey JB, Xia A, Muller U, Belyantseva IA, Applegate BE, Oghalai JS. Mammalian Auditory Hair Cell Bundle Stiffness Affects Frequency Tuning by Increasing Coupling along the Length of the Cochlea. Cell Rep 2018;23:2915-27. [Crossref] [PubMed]
- Cooper NP, Vavakou A, van der Heijden M. Vibration hotspots reveal longitudinal funneling of sound-evoked motion in the mammalian cochlea. Nat Commun 2018;9:3054. [Crossref] [PubMed]
- Dewey JB, Applegate BE, Oghalai JS. Amplification and suppression of traveling waves along the mouse organ of Corti: evidence for spatial variation in the longitudinal coupling of outer hair cell-generated forces. J Neurosci 2019;39:1805-16. [Crossref] [PubMed]
- Fallah E, Strimbu CE, Olson ES. Nonlinearity and amplification in cochlear responses to single and multi-tone stimuli. Hear Res 2019;377:271-81. [Crossref] [PubMed]
- Lin NC, Hendon CP, Olson ES. Signal competition in optical coherence tomography and its relevance for cochlear vibrometry. J Acoust Soc Am 2017;141:395-405. [Crossref] [PubMed]
- Ramier A, Rosowski JJ, Yun S-H, editors. Optical coherence tomography for imaging the middle and inner ears: A technical review. AIP Conference Proceedings; 2018: AIP Publishing.
- Tan HEI, Santa Maria PL, Wijesinghe P, Francis Kennedy B, Allardyce BJ, Eikelboom RH, Atlas MD, Dilley RJ. Optical coherence tomography of the tympanic membrane and middle ear: a review. Otolaryngol Head Neck Surg 2018;159:424-38. [Crossref] [PubMed]
- Subhash HM, Nguyen-Huynh A, Wang RK, Jacques SL, Choudhury N, Nuttall AL. Feasibility of spectral-domain phase-sensitive optical coherence tomography for middle ear vibrometry. J Biomed Opt 2012;17:060505. [Crossref] [PubMed]
- Chang EW, Cheng JT, Roosli C, Kobler JB, Rosowski JJ, Yun SH. Simultaneous 3D imaging of sound-induced motions of the tympanic membrane and middle ear ossicles. Hear Res 2013;304:49-56. [Crossref] [PubMed]
- Oh SJ, Lee IW, Wang SG, Kong SK, Kim HK, Goh EK, editors. Extratympanic imaging of middle and inner ear structures of mouse and rat using optical coherence tomography. Optical Imaging, Therapeutics, and Advanced Technology in Head and Neck Surgery and Otolaryngology; 2017: International Society for Optics and Photonics.
- Jeon D, Cho NH, Park K, Kim K, Jeon M, Jang JH, Kim J. In Vivo Vibration Measurement of Middle Ear Structure Using Doppler Optical Coherence Tomography: Preliminary Study. Clin Exp Otorhinolaryngol 2019;12:40-9. [Crossref] [PubMed]
- Ramier A, Cheng JT, Ravicz ME, Rosowski JJ, Yun S-H. Mapping the phase and amplitude of ossicular chain motion using sound-synchronous optical coherence vibrography. Biomed Opt Express 2018;9:5489-502. [Crossref] [PubMed]
- Pawlowski ME, Shrestha S, Park J, Applegate BE, Oghalai JS, Tkaczyk TS. Miniature, minimally invasive, tunable endoscope for investigation of the middle ear. Biomed Opt Express 2015;6:2246-57. [Crossref] [PubMed]
- Kim W, Kim S, Oghalai J, Applegate BE, editors. A Hand-Held Optical Coherence Tomography and Vibrometry Device for Human Inner Ear Imaging with Subnanometer Sensitivity to Vibration. Frontiers in Optics. 2017: Optical Society of America.
- MacDougall D, Farrell J, Jufas N, Bance M, Brown J, Adamson R, editors. Long-range, wide-field, functional optical coherence tomography imaging for clinical otology in live patients and healthy normals. Frontiers in Optics. 2016: Optical Society of America.

