

Optical coherence tomography imaging of cardiac substrates
Cardiovascular disease
Cardiovascular disease is the leading cause of morbidity and mortality in the United States (1). It is estimated that 180,000–300,000 sudden cardiac deaths occur within the US annually, and is the leading cause of death worldwide attributing to 25% (2). Progress within the cardiovascular field towards early diagnosis, increased efficacy in therapy and understanding the underlying mechanisms of cardiovascular diseases have been aided in part by advances in medical imaging technologies. Diseases and abnormalities of the myocardium are due to problems of the heart muscle, ranging from infections to abnormalities in conduction, structure, and contraction. There are a large range of diseases and therapies of the heart that can benefit from the information provided by a high-resolution, real time imaging modality.
Knowledge of a patient’s heart structure will help to plan procedures, potentially identifying arrhythmia substrates, critical structures to avoid, detect transplant rejection, and reduce ambiguity when interpreting electrograms and functional measurements. The structure of the myocardium is important to both electrical conduction and mechanical contractility. Previous research has suggested that heterogeneity in tissue and cellular structure are potential mechanisms for the generation and maintenance of arrhythmias (3-8). At early stages of some diseases, such as arrhythmogenic right ventricular cardiomyopathy (9), healthy myocardium is being progressively replaced by fat or fibrous tissue. Early detection of this process will help to identify patients at risk of sudden cardiac death and may serve as an indication for implantable cardioverter defibrillator therapy or identify targets for RFA. Similarly, basic research of numerous cardiac diseases would greatly benefit from structural imaging at cellular scale which is possible only by histology. Early detection requires imaging on the scale of a myocyte, which is approximately 100 µm × 10 µm. Within this review, we will highlight efforts of optical coherence tomography (OCT) researchers for characterization of the cardiac tissue structure.
OCT review
OCT is a non-invasive imaging modality that provides depth-resolved, high-resolution images of tissue microstructure in real-time. Since its origins in the early 1990 s (10), OCT has become a well-established imaging modality for biomedical and clinical applications. Based on low coherence interferometry, OCT images the depth profile of a tissue sample by measuring the interference between light backscattered from the sample and light reflected from a reference. OCT can non-destructively image the three-dimensional microstructure of biological tissues with an imaging resolution ranging from 1 to 15 µm, penetration depths of 2 to 3 mm (11), and video rate imaging speeds (12). Comprehensive reviews of OCT are available within the following references (13-16). Below, we highlight important considerations when imaging cardiac tissue with OCT.
The basic mechanism of OCT is based on the Michelson interferometer. The first type of OCT system developed was time domain (TD) OCT, and a simplified schematic of a TD-OCT setup is provided in Figure 1. Light from a broadband, low coherence light source is directed towards a beam splitter, which directs the light towards both the sample arm to a tissue sample and the reference arm. Light from both arms are recombined and are collected by the detector. For TD-OCT, the detector is a single-channel photoreceiver. Fourier domain (FD) OCT captures the interference pattern in the spectral domain (SD). FD-OCT has been demonstrated theoretically and experimentally to have superior sensitivity than TD-OCT, enabling higher speed imaging applications (17-19). FD-OCT is divided into two sub-categories: SD OCT, in which a spectrometer and array detector are used for detection, and swept-source (SS) OCT, or optical frequency domain imaging (OFDI), in which a wavelength-swept light source is used for illumination and a single or small number of photoreceivers detect the interference signal over time. Basic schematics of a SD-OCT and SS-OCT setup are provided in Figure 1.

In FD-OCT, the reference arm remains stationary and is fixed at a distance equivalent to the approximate location of the sample. The full depth profile of the tissue sample at a given x-y location is encoded within the detected interferogram in the SD. The spectral interferogram collected by the detector must be pre-processed and inverse Fourier transformed to obtain the intensity depth profile of the sample (Figure 2). Galvo mirrors are used to scan the beam over the sample in lateral dimensions, generating two-dimensional images, called B-scans, or three-dimensional image volumes composed of multiple B-scans. For in vivo applications, fiber based catheters probes can be used to image the myocardium.

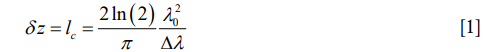
In both TD- and FD-OCT systems, the axial resolution δz is equivalent to the coherence length of the illumination light source lc, governed by the light source’s central wavelength λ0 and full-width at half-maximum (FWHM) bandwidth Δλ. The coherence length is also equivalent to the FWHM of the light source’s coherence function. Assuming a Gaussian source spectrum (22), the axial resolution and coherence length is given by (23):
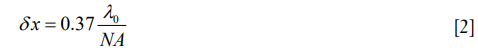
The lateral resolution of an OCT system, δx, is defined as the FWHM of the point spread function of the sample arm beam at the focal plane (23). It is determined by the central wavelength of the light source, λ0, and the numerical aperture, NA, of the objective lens.
The axial field of view, FOVaxial, or depth of focus of an OCT system is defined as the FWHM of the confocal axial response function, which is dependent on the center wavelength of the light source, λ0, and the numerical aperture (NA) of the objective lens (24).
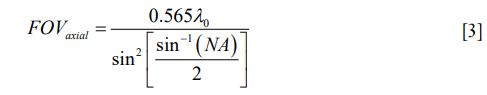
As shown in Eq. [3] and Figure 3, the axial FOV will decrease as lateral resolution improves. Therefore, there is always a trade-off between the axial FOV and lateral resolution of the OCT system. For most OCT systems that do not require high lateral resolution, objectives with NA less than 0.1 are picked for the sample arm to allow for longer signal penetration depth.

For OCT biological imaging, the signal penetration in tissue is typically on the order of a few millimeters in depth. It is mainly dependent on the incident wavelength and the spectroscopic properties of the tissue, including absorption, scattering and anisotropy. The imaging range of the OCT system, zmax, defines the maximum depth profiling range. In TD-OCT, it is determined by the maximum axial scan range of the movable reference mirror, and theoretically does not have an actual limit. In FD-OCT, however, it is limited by the Nyquist sampling theorem, and calculated as (23):
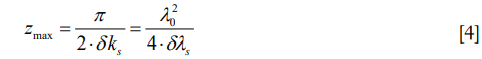
where δks, δλs are the sampling interval in wavenumber and wavelength unit on spectrometer, respectively. One should be noted that all the equations provided above are derived with no consideration of the refractive index of the tissue.
In addition, due to the finite sampling intervals in the FD, SD-OCT is also susceptible to sensitivity degradation along the depth. It is known as sensitivity fall-off. The sensitivity decreases with the depth because the reduction of fringe visibility is more predominant at higher fringe frequencies, due to the finite resolution of the spectrometer. Analytically, it imposed a fall-off factor to the detected intensity profile. This is less of a problem for the SS OCT systems because the broad linewidth of each spectrometer pixel coverage in SD-OCT systems is replaced by the much finer laser linewidth in SS-OCT systems via the sweeping of wavelengths. SS-OCT is emerging as clinical tool that allows faster imaging speed, and has played an important role in in vivo functional OCT imaging of the heart (26,27).
Cardiac OCT imaging
Imaging has played a vital role for early diagnosis of cardiovascular diseases, monitoring and guidance of procedures, and characterization of preclinical models of disease. The unique features of OCT have made it a powerful tool for cardiovascular imaging, from basic scientific research to clinical applications. Due to its high resolution, fast imaging speeds and non-destructive imaging capabilities, the use of OCT to image cardiac microstructure has increased over the past two decades. OCT has been used to image the embryonic chick heart over the first few days of development, where the heart transitions from a tube to a four chamber heart (26-32). Three dimensional OCT imaging of fixed (33) or living (31,34-36) embryonic hearts allows for analysis of morphological and blood flow (37-42) changes as a function of genetic deficiencies (33) or environmental perturbations (41). Within this review, we highlight four applications of OCT imaging of adult hearts, including: (I) myofiber architecture characterization and measurement; (II) structure-function analysis enabled by functional OCT and multimodal analysis; (III) characterization of remodeled tissue including fibrosis and infarction; and (IV) tracking of therapeutic interventions that alter cardiac tissue structure.
The heart is highly scattering (43,44), which is an important consideration for cardiac OCT imaging. When imaging with a system with a 1,300 nm center wavelength, the image penetration can range from 0.5 to 1 mm (45,46). Optical clearing (47,48) has been evaluated within a range of tissue preparations to increase image penetration and increase contrast within OCT images. As shown in Figure 4, the use of glycerol with increasing concentrations enables imaging to allow for a full four chamber view of the mouse heart (49). Other agents that have been used to optically clear cardiac tissue include ScaleA2 (50) and sucrose (51). Although clearing agents cannot be used within a beating heart, its use enables comprehensive imaging with high resolution.

When considering in vivo translation, absorption of near infrared light by blood is a major consideration. For clinical applications, probes come into contact with the tissue with near perpendicular contact to interrogate and treat the cardiac chambers. Examples include endomyocardial biopsy forceps and RFA catheters. Therefore, forward viewing catheters have been designed to image the beating heart, with the goal of imaging with near perpendicular contact (20,21,52-54). When the catheter is placed in direct contact with the tissue surface, blood is displaced from the field of view, enabling in vivo imaging within the cardiac chambers. This was first demonstrated by Rollins’ group from Case Western Reserve University (20). Figure 2D,E,F show the design, placement, and B-scan image from a forward viewing OCT catheter.
Normal myocardium contains well-aligned bundles of cardiomyocytes with homogeneous distribution (55), and is highly birefringent (56). Without controlling the polarization state of light, OCT images will be susceptible to birefringence artifacts (57), which can limit the penetration depth of the signal. Figure 5A shows an example: as the input polarization state changes, a black band in the OCT images, often known as the birefringent artifact, appears and disappears. The polarization state as well as the optical path of incident light is altered after passing through the biological tissues that manifest optical birefringence, and cause the birefringence artifact to occur in the OCT images. The appearance of the birefringence artifact, on the other hand, may provide qualitative information about the tissue architecture. For example, two UHR OCT images in Figure 5B,C were taken from the right ventricular septum of a human heart sample with presence of the chordae tendineae as depicted in the corresponding trichrome slides shown in Figure 5D,E. The chordae tendineae are mainly composed of bundled fibrous tissue that also manifests optical birefringence. The birefringence artifact in the chordae tendineae manifests a “double band” appearance due to the high retardation induced by the dense collagen fiber bundles, while in the myocardium it appeared as a “single band”, indication a slower retardation induced by the bundled cardiomyocytes. Moreover, the trichrome stain also captured the fibrosis regions in both slides. When light interacts with the disorganized collagen in the fibrosis region, it quickly gets depolarized and thus the birefringence artifacts disappear, causing disruption in the otherwise continuous “band”. The heterogeneity in the myocardium was successfully depicted in the UHR OCT images, yet not quite pronounced in corresponding H&E slides as in Figure 5F,G.

Characterizing myofiber architecture with OCT
In biology and medicine, fiber refers to a thread-like, filamentary structure (58). Cardiac fibers refer to strands of myocytes, which are relatively short, branched, with a typical diameter range from 10 to 20 µm (59) in the normal human heart. Myofiber orientation directly influences mechanical contraction. For instance, in healthy ventricles, the fibers follow a left-handed helical path near the epicardium and right-handed helical path near the endocardium (60). It has been shown that stress distributions during heart function are influenced by fiber angle distributions, and deviations from the regular fiber orientation induced by disease may negatively impact mechanical function (61,62). Therefore, changes in fiber orientation structure may result in abnormal mechanical contraction of heart. For electrical conduction, action potentials, which propagate along myofibers within cardiac tissue, show a direction-dependence. The structural anisotropy of the myocardium is correlated with the function. The propagation of the electrical wavefront in the ventricles is about three times faster along the longitudinal axis than along the transverse axis of the myofiber (2,63,64). Abnormal myofiber disarray can cause conduction abnormalities which could promote arrhythmia (65) such as atrial fibrillation (66) and ventricular tachycardia (67).
With its capability to resolve fiber bundles, OCT has been used to image and quantify myofiber structure. Within planes parallel to the surface, myofibers are visible within hearts of small and large animals such as rabbits (45,68), swine (69), canine (70) and humans (71). Myofiber orientation quantification has been demonstrated using intensity-based methods analyzing the gradient strength (45,69,70) observed within planes parallel to the surface (45,50,69,70,72-74). Figure 6 shows an example of fiber orientation measurements and tractography employing a combination of gradient methods and particle filtering. The quantification of fiber orientation is based on an estimation of all possible trace paths as shown in Figure 6B and a weighted evaluation as shown in Figure 6C. Pixel-wise estimation of orientation has also been demonstrated, where the fiber orientation distribution is obtained based on the discrete Fourier transform (73). FD methods have also been used, utilizing the Fourier transform within small windows spanning the en face image to identify local fiber orientation distributions, which are then used to extract the dominant fiber orientation within the windowed region (50,72,73,75). Measurement of fiber bundle thickness has been demonstrated in sheep pulmonary veins, where fiber bundles were identified through thresholding (74). In some cases, optical clearing (50,72) or serial sectioning have been employed (73) to improve imaging depth.

Structure: function analysis enabled by OCT imaging
To investigate structure-function dynamics with OCT, structural information from OCT has been used in combination with optical mapping, an experimental technique for investigating cardiac electrophysiology using voltage-sensitive dyes that emit fluorescent light proportional to changes in transmembrane potential (76,77). Structural features of the cardiac conduction system, including the Purkinje network (78), the atrioventricular node (68,70,79), and the sinoatrial node (68) have been investigated using OCT in the rabbit and canine heart. In a study by Hucker et al., tissue specific structure was identified by OCT imaging, including fiber orientation which was quantified using gradient based analysis (45). The tissue-specific structure identified by OCT was correlated to multilayer electrical conduction and the location of reentry cores during arrhythmia (Figure 7). Correlation of arrhythmic electrophysiological patterns to detailed tissue structure can provide further insight on the structural substrate that maintains abnormal electrical propagation, enabling improved identification of structural targets during therapy. Fiber orientation patterns seen at different depths of the tissue, as imaged by OCT, could be correlated to the electrical activation patterns observed from optical mapping (Figure 8). Additionally, the location of optically mapped reentry cores was associated with tissue regions where shifts in dominant fiber angle distributions were identified at different tissue depths by volumetric OCT imaging (68). Thus, structural information from OCT can assist in the interpretation of optical mapping signals, and may better identify relationships between tissue structure and cardiac electrophysiology as relevant to arrhythmia.


Recently, our group has developed a framework for the development of tissue-specific models of atrial tissue derived from OCT imaging data, which can be useful in future investigations of electrophysiology and optical mapping signals with respect to realistic atrial tissue structure (80). A flow diagram is shown in Figure 9. Due to the thinness of the left atrial wall, detailed imaging within the human left atrium is limited by the resolution of current clinical imaging modalities. With its high resolution, OCT can provide further important details of tissue structure, such as depth-resolved myofiber orientation in thinner regions or distributions of interstitial adipose and collagen tissues. Changes in transmural electrical conduction were observed with the inclusion of OCT-derived, depth-resolved fiber orientation. In addition, structural features such as RFA lesion geometry can be characterized with OCT and used to generate sample specific models (81). Modeling tissue-specific ablation lesions enabled a better understanding of the distribution of fluorescent signals corresponding to non-transmural and transmural lesions with respect to lesion geometry as well as the scattering and absorption of illumination and fluorescent light. With increased interest in the influence of 3D tissue microstructure across the depth of the atrial wall on arrhythmia dynamics (82), as well as ongoing investigations in optical methods for detecting ablation lesions (83-85), such OCT-derived models could facilitate better understanding on structure-function interactions.

Fibrosis and infarction characterization with OCT imaging
Fibrosis is associated with remodeling during cardiomyopathy, increased cardiac stiffness, and the development of heart failure (86), and has been reported to be associated with arrhythmogenic behavior by anchoring reentrant waves and causing conduction delays and fractionation (87). In atrial fibrillation patients, increased amounts of fibrosis have been associated with poorer ablation outcomes (88). Infarction is also associated with myofiber disarray, arrhythmia (67) and heart failure (89).
Animal models, and in particular mouse models, are an invaluable tool for studying cardiac remodeling (90,91). Although OCT has limited penetration depth into myocardial tissue of 1–2 millimeters, this is enough to image through the majority of the ventricular wall of a mouse heart. As an example, Figure 10 shows significant ventricular thinning is observed within a healed myocardial infarction. The entire transmural thickness of the ventricular wall is visible without the use of optical clearing. The area of infarction is characterized by increased signal intensity and a loss of birefringence banding. However, fibers were not visible within image slices parallel to the sample surface. Therefore, for imaging mice hearts, polarization sensitive OCT systems have been used (92-97).

Most applications of OCT concentrate on imaging the static micro-anatomy of near-surface tissue structures. In physical terms, this corresponds to measuring the magnitude of the interferometric signal detected as a function of depth and lateral position in the sample under investigation. Detection of the complex OCT signal also provides interferometric phase information, which is discarded in most conventional implementations, but may be used to assess tissue function in addition to imaging structure. Functional extensions of OCT including polarization sensitive (98), Doppler, elastography and angiography (99,100) can enable structure-function analysis of cardiac tissue.
A polarization sensitive optical coherence tomography (PSOCT) system can be used for artifact free imaging and quantitative birefringence measurements (101). By using polarization sensitive techniques, it is possible to provide additional polarization-based contrast for the structure and tissue composition of the myocardium (93,94,102,103). Changes in the myocardial tissue composition may disrupt the normal organization of myofiber bundles and thus reflected through the polarization contrast. Myofiber disorganization and variability identified through OCT have been correlated to regions of infarction and cardiomyopathy in mouse or rat ventricles (92,96,97). Figure 11 is an example of OCT enabled quantification of fiber orientation changes with depth within the left (LV) and right ventricle (RV) of mice (96). Structural remodeling within a mouse model of cardiomyopathy was explored with PSOCT. Whole heart imaging was conducted by mounting each heart onto a 20-gauge needle and rotating it while imaging. As shown in Figure 11A, a cross section (C-scan) through the stitched volume allows for visualization of the cardiac chambers. Fiber orientation measurements for selected regions of interest within the LV and RV are shown in panel b. Optical coherence elastography (OCE), another functional extension of OCT, has also been demonstrated as a method for nondestructive biomechanical assessment of myocardial infarctions within a mouse model, where they showed a reduce elastic wave velocity and less mechanical anisotropy within healed myocardial infarctions characterized by fibrotic scar (104). OCT based angiography has also been demonstrated as a method for assessing perfusion within the myocardium, characterizing the microcirculation (99).

Numerous groups are working towards developing efficient and robust tissue classification algorithms to extract physiological data from acquired OCT images. Automated algorithms developed to identify differences in optical properties and image texture for tissue classification can aid in procedural guidance and evaluation. In 2009, general features such as myofiber organization from small regions from the human right atrium, LVs and RVs, atrioventricular node, and sinoatrial node were presented (51). In 2016, different tissue types within human left atrial tissue, including dense collagen, loose collagen, fibrotic myocardium, adipose tissue, and normal myocardium, were imaged and analyzed using an automatic classification scheme (46). In Figure 12, we present representative parametric images from left and right atrial samples. The feature set includes pixel-based, A-Line-based, and layer-based features, such as attenuation coefficient, entropy, skewness. Texture based features such as entropy and skewness describe the distributions of intensity or texture pattern of an image region, and are derived from gray-level co-occurrence matrices. Attenuation coefficient, calculated from a previously described method (105), describes how quickly the intensity of light is decreased as it passes through a medium. These features can be incorporated into automated classification algorithms. Together with a layer based segmentation, to identify layers within the cardiac tissue, regions are automatically classified using a relevance vector machine model.

An ultra-high resolution OCT system was developed and shown to image detailed tissue features such elastic fibers, collagen fiber bundles, adipose tissue, myofibers, and chordae tendineae in the human ventricular septum (25). However, these imaging studies focused on small regions of the human heart chambers, without providing a comprehensive study of the distribution of different tissue types throughout the chamber or analyzing the tissue features identified with OCT in relation to cardiac anatomy. Through the use of stitching algorithms to combine multiple OCT image volumes encompassing the whole heart, morphological parameters such as heart size, wall thickness, and mass have also been measured for diseased and normal small animal hearts (49,96). Recently, imaging studies characterizing sheep (74) and human pulmonary veins has been carried out (71). Within sheep pulmonary veins, the radius of fiber bundles was found to vary at different depths. In human pulmonary veins, it was demonstrated that OCT was capable of providing distinguishing features between venous media and myocardial sleeves, as well as details on the patterns of fibrosis that could be identified within the myocardial sleeves. As shown in Figure 13, regions containing underlying myocardium could be distinguished from regions of solely venous media and adventitia through the increased penetration depth or increased heterogeneity within venous media and adventitial regions (71). Interstitial collagen fibers within the myocardium could be identified by bright, highly backscattering strands within myocardial sleeve regions. The size of the strands of collagen fibers, as well as their directionality, could be identified with OCT imaging (71).

Second harmonic generation imaging studies on fibrotic myocardium have indicated that increased amount of entangled and less orderly collagen fibers deposition was found within the myofibers, which may also result in the interruption of the birefringence of the normal myocardium (106,107). Furthermore, disruption of birefringence artifact within the intrinsic intensity OCT images was also observed when imaging fibrotic myocardium by using a regular high-resolution SD-OCT system without polarization selective detection (25). These findings suggest that myocardial fibrosis may be differentiated with the addition of polarization-based contrast.
As one of the polarization sensitive techniques, cross-polarization (CP) OCT system provides an alternative way to access the tissue polarization properties in a simplified fashion. CP-OCT system uses linearly polarized light to interrogate the sample, usually non-birefringent, and the loss of polarized backscattering is analyzed by comparing the signal strength from CP and co-polarization channels (108-111). The loss of polarization, or depolarization effect, can be thus used as contrast to localize depolarized particles presented in tissue. CP-OCT produces a qualitative contrast describing the depolarization of the incident polarized light, which is calculated by taking the ratio between the cross- and co- polarization channels as Iratio = Ax/Ay. According to Schmitt et al. (108), the depolarization effect is characterized by a significant intensity drop in the co-polarization channel, which gives rise to a higher ratio between the cross- and co- polarization intensity signals along the A-line profile. As shown within Figure 14, with a high resolution CPOCT system Iratio and retardance measurements were able to show distinguishing features between endocardial scar, thickened endocardium, fibrosis, and ablation lesions in the right ventricular septum (112).

Real time tracking of cardiac ablation therapy with OCT
Cardiac arrhythmias are a major source of morbidity and mortality in the United States. Since pharmacological therapies have limited effectiveness, catheter ablation directed at interrupting critical components of arrhythmia circuits has emerged as a prominent approach for the treatment of a broad range of atrial and ventricular tachyarrhythmias.
Radiofrequency ablation (RFA) therapy is now the standard of care for the treatment of cardiac arrhythmias. RF energy is a form of alternating electrical energy that is used to generate a lesion in the heart by electrical heating of the myocardium. The goal of catheter ablation using RF energy is to transfer electro-magnetic energy into thermal energy in the tissue. Through this process, the area supporting the arrhythmia will be destroyed by heating to a temperature which creates discrete areas of necrosis (113,114). Current techniques to guide ablation therapy utilize low resolution two dimensional fluoroscopic images or static images from computed tomography merged onto fluoroscopy (115,116).
The clinical utility of OCT monitoring of cardiac RFA therapy includes providing a direct visualization of the catheter-heart interface, direct visualization of normal areas of the heart to avoid during ablation, visualization of areas to target for ablation and direct visualization of lesions that are made. Thermal damage of the myocardium has been shown to cause changes in the optical properties of tissue, in particular anisotropy coefficient, scattering coefficient (117-119), and birefringence (120). With its high imaging speed and resolution, OCT has been proposed as a real-time imaging guidance tool for RFA procedures. OCT-integrated catheters have been developed (21,52,53,121) and imaging of myocardial features have been demonstrated in vivo in swine hearts (20,54). Forward viewing catheters (21,52-54,122) are designed to image while the catheter is in contact with the cardiac tissue surface. OCT is able to identify tissue contact between the probe and the cardiac wall (20,21,54), as myocardial features become more apparent with the displacement of blood that occurs at probe contact. The location and development of ablation lesions can be tracked with OCT by the appearance of the birefringence artifact band, which is a dark band in the myocardium that disappears within regions corresponding to ablation lesions (21,121,123). However, because the depth at which the birefringent artifact occurs may fluctuate in an in vivo setting (54), PS-OCT approaches to identifying the ablation lesion have been proposed as a more sensitive indicator to discriminate ablation lesions from normal myocardium (52,53,112). This change of the polarization contrast can be used for characterization of myocardial infarction (92) and lesions created by RFA (53,103). An example of lesion monitoring in pig atrium in vivo is shown in Figure 15 (52). Phase retardance measured by PSOCT, an indication of viable tissue, gradually disappears as the tissue is treated with RFA. At the same time, the tissue becomes more scattering and more homogeneous in the OCT (reflectance) images.

OCT imaging during ablation may also be able to provide information of tissue structural changes indicative of complications occurring during energy delivery, such as the formation of tears within the ablated region (Figure 16) (20,123). It is current practice to use the increase of tissue-electrode impedance as a signal to detect overtreatment of the tissue and coagulum development (124). However, previous studies have shown that adverse effects such as steam pops are not always associated with a large change in impedance (125). More than ever, this is important for saline irrigated RFA catheters. Depth resolved imaging provided by OCT has the potential for identifying early stages of complications. In addition, tissue features such as fat and vessels may also be identified during epicardial ablation have unique texture signatures within OCT imaging, enabling potential substrate guided ablation (121).

Summary
OCT has emerged as a promising imaging modality that provides high penetration, high sensitivity, and high axial resolution to allow for architectural and functional imaging of cardiac tissue. The specifications of OCT, including axial resolution and lateral resolutions on a micron-scale, functional contrast extensions such as PSOCT and OCE, high speed imaging, and enabling catheter based technology, makes OCT well suited for both basic science applications and translational applications imaging the heart. With continued technical advances in OCT image quality and real-time automated processing, OCT will continue to grow as an imaging modality for assessing the structure and function of heart muscle.
Acknowledgments
Funding: Research summarized from the Structure Function Imaging Laboratory at Columbia University was funded in part by the National Institute of Health (NIH) 1DP2HL127776-01 (CPH), the National Science Foundation NSF EEC-1342273 (CPH) and NSF Career Award 1454365 (CPH), Fieldston Medical Foundation (CPH), and Columbia University Provost Junior Faculty Award (CPH).
Footnote
Conflicts of Interest: The authors have no conflicts of interest to declare.
References
- Heron M. Deaths: Leading Causes for 2016. Natl Vital Stat Rep 2018;67:1-77. [PubMed]
- Clerc L. Directional differences of impulse spread in trabecular muscle from mammalian heart. J Physiol 1976;255:335-46. [Crossref] [PubMed]
- Aslanidi OV, Boyett MR, Dobrzynski H, Li J, Zhang H. Mechanisms of transition from normal to reentrant electrical activity in a model of rabbit atrial tissue: interaction of tissue heterogeneity and anisotropy. Biophys J 2009;96:798-817. [Crossref] [PubMed]
- Zhao J, Butters TD, Zhang H, Pullan AJ, LeGrice IJ, Sands GB, Smaill BH. An image-based model of atrial muscular architecture: effects of structural anisotropy on electrical activation. Circ Arrhythm Electrophysiol 2012;5:361-70. [Crossref] [PubMed]
- Maesen B, Zeemering S, Afonso C, Eckstein J, Burton RA, van Hunnik A, Stuckey DJ, Tyler D, Maessen J, Grau V, Verheule S, Kohl P, Schotten U. Rearrangement of atrial bundle architecture and consequent changes in anisotropy of conduction constitute the 3-dimensional substrate for atrial fibrillation. Circ Arrhythm Electrophysiol 2013;6:967-75. [Crossref] [PubMed]
- Angel N, Li LI, Macleod RS, Marrouche N, Ranjan R, Dosdall DJ. Diverse Fibrosis Architecture and Premature Stimulation Facilitate Initiation of Reentrant Activity Following Chronic Atrial Fibrillation. J Cardiovasc Electrophysiol 2015;26:1352-60. [Crossref] [PubMed]
- Tereshchenko LG, Rizzi P, Mewton N, Volpe GJ, Murthy S, Strauss DG, Liu CY, Marchlinski FE, Spooner P, Berger RD, Kellman P, Lima JA. Infiltrated atrial fat characterizes underlying atrial fibrillation substrate in patients at risk as defined by the ARIC atrial fibrillation risk score. Int J Cardiol 2014;172:196-201. [Crossref] [PubMed]
- Haissaguerre M, Shah AJ, Cochet H, Hocini M, Dubois R, Efimov I, Vigmond E, Bernus O, Trayanova N. Intermittent drivers anchoring to structural heterogeneities as a major pathophysiological mechanism of human persistent atrial fibrillation. J Physiol 2016;594:2387-98. [Crossref] [PubMed]
- Burke AP, Farb A, Tashko G, Virmani R. Arrhythmogenic right ventricular cardiomyopathy and fatty replacement of the right ventricular myocardium: are they different diseases? Circulation 1998;97:1571-80. [Crossref] [PubMed]
- Huang D, Swanson EA, Lin CP, Schuman JS, Stinson WG, Chang W, Hee MR, Flotte T, Gregory K, Puliafito CA, Fujimoto JG. Optical coherence tomography. Science 1991;254:1178-81. [Crossref] [PubMed]
- Fujimoto JG, Pitris C, Boppart SA, Brezinski ME. Optical Coherence Tomography: An Emerging Technology for Biomedical Imaging and Optical Biopsy. Neoplasia 2000;2:9-25. [Crossref] [PubMed]
- Rollins A, Yazdanfar S, Kulkarni M, Ung-Arunyawee R, Izatt J. In vivo video rate optical coherence tomography. Opt Express 1998;3:219-29. [Crossref] [PubMed]
- Schmitt JM. Optical coherence tomography (OCT): a review. IEEE J Sel Top Quantum Electron 1999;5:1205-15. [Crossref]
- Fercher AF, Drexler W, Hitzenberger CK, Lasser T. Optical coherence tomography-principles and applications. Rep Prog Phys 2003;66:2003. [Crossref]
- Drexler W, Fujimoto JG. Optical coherence tomography: technology and applications. Second Edition. Springer Science & Business Media, 2015.
- Fujimoto J, Swanson E. The Development, Commercialization, and Impact of Optical Coherence Tomography. Invest Ophthalmol Vis Sci 2016;57:1-13. [PubMed]
- Choma M, Sarunic MV, Yang C, Izatt JA. Sensitivity advantage of swept source and Fourier domain optical coherence tomography. Optics Express 2003;11:2183-9. [Crossref] [PubMed]
- de Boer JF, Cense B, Park BH, Pierce MC, Tearney GJ, Bouma BE. Improved signal-to-noise ratio in spectral-domain compared with time-domain optical coherence tomography. Optics Letters 2003;28:2067-9. [Crossref] [PubMed]
- Leitgeb R, Hitzenberger C, Fercher A. Performance of fourier domain vs. time domain optical coherence tomography. Opt Express 2003;11:889-94. [Crossref] [PubMed]
- Fleming CP, Rosenthal N, Rollins AM, Arruda MM. First in vivo Real-Time Imaging of Endocardial Radiofrequency Ablation by Optical Coherence Tomography: Implications on Safety and The Birth of ‘‘Electro-structural’’ Substrate-Guided Ablation. J Innov Card Rhythm Manag 2011;2:199-201.
- Fleming CP, Wang H, Quan KJ, Rollins AM. Real-time monitoring of cardiac radio-frequency ablation lesion formation using an optical coherence tomography forward-imaging catheter. J Biomed Opt 2010;15:030516. [Crossref] [PubMed]
- Akcay AC, Rolland JP, Eichenholz JM. Spectral shaping to improve the point spread function in optical coherence tomography. Opt Lett 2003;28:1921-3. [Crossref] [PubMed]
- Izatt JA, Choma MA. Theory of Optical Coherence Tomography. In: Drexler W, Fujimoto JG, editors. Optical Coherence Tomography: Technology and Applications. Berlin, Heidelberg: Springer Berlin Heidelberg, 2008:47-72.
- Fujimoto J, Drexler W. Introduction to Optical Coherence Tomography. In: Drexler W, Fujimoto JG. editors. Optical Coherence Tomography: Technology and Applications. Berlin, Heidelberg: Springer Berlin Heidelberg, 2008:1-45.
- Yao X, Gan Y, Marboe CC, Hendon CP. Myocardial imaging using ultrahigh-resolution spectral domain optical coherence tomography. J Biomed Opt 2016;21:61006. [Crossref] [PubMed]
- Bhat S, Larina IV, Larin KV, Dickinson ME, Liebling M. 4D reconstruction of the beating embryonic heart from two orthogonal sets of parallel optical coherence tomography slice-sequences. IEEE Trans Med Imaging 2013;32:578-88. [Crossref] [PubMed]
- Peterson LM, Jenkins MW, Gu S, Barwick L, Watanabe M, Rollins AM. 4D shear stress maps of the developing heart using Doppler optical coherence tomography. Biomed Opt Express 2012;3:3022-32. [Crossref] [PubMed]
- Li A, Ahsen OO, Liu JJ, Du C, McKee ML, Yang Y, Wasco W, Newton-Cheh CH, O'Donnell CJ, Fujimoto JG, Zhou C, Tanzi RE. Silencing of the Drosophila ortholog of SOX5 in heart leads to cardiac dysfunction as detected by optical coherence tomography. Hum Mol Genet 2013;22:3798-806. [Crossref] [PubMed]
- Men J, Jerwick J, Wu P, Chen M, Alex A, Ma Y, Tanzi RE, Li A, Zhou C. Drosophila Preparation and Longitudinal Imaging of Heart Function In Vivo Using Optical Coherence Microscopy (OCM). J Vis Exp 2016.55002. [PubMed]
- Tsai MT, Lee CK, Chang FY, Wu JT, Wu CP, Chi TT, Yang CC. Noninvasive imaging of heart chamber in Drosophila with dual-beam optical coherence tomography. J Biophotonics 2013;6:708-17. [Crossref] [PubMed]
- Jenkins MW, Chughtai OQ, Basavanhally AN, Watanabe M, Rollins AM. In vivo gated 4D imaging of the embryonic heart using optical coherence tomography. J Biomed Opt 2007;12:030505. [Crossref] [PubMed]
- Jenkins MW, Watanabe M, Rollins AM. Longitudinal Imaging of Heart Development With Optical Coherence Tomography. IEEE J Sel Top Quantum Electron 2012;18:1166-75. [Crossref] [PubMed]
- Jenkins MW, Patel P, Deng H, Montano MM, Watanabe M, Rollins AM. Phenotyping transgenic embryonic murine hearts using optical coherence tomography. Applied Optics 2007;46:1776-81. [Crossref] [PubMed]
- Jenkins MW, Adler DC, Gargesha M, Huber R, Rothenberg F. Belding2 J, Watanabe M, Wilson DL, Fujimoto JG, Rollins AM. Ultrahigh-speed optical coherence tomography imaging and visualization of the embryonic avian heart using a buffered Fourier Domain Mode Locked laser. Optics Express 2007;15:6251-67. [Crossref] [PubMed]
- Gargesha M, Jenkins MW, Wilson DL, Rollins AM. High temporal resolution OCT using image-based retrospective gating. Optics Express 2009;17:10786-99. [Crossref] [PubMed]
- Männer J, Thrane L, Norozi K, Yelbuz TM. High-resolution in vivo imaging of the cross-sectional deformations of contracting embryonic heart loops using optical coherence tomography. Dev Dyn 2008;237:953-61. [Crossref] [PubMed]
- Yazdanfar S, Kulkarni MD, Izatt JA. High Resolution Imaging of In Vivo Cardiac Dynamics Using Color Doppler Optical Coherence Tomography. Optics Express 1997;1:424-31. [Crossref] [PubMed]
- Yang VXD, Gordon ML, Qi B, Pekar J, Lo S, Seng-Yue E, Mok A, Wilson BC, Vitkin IA. High speed, wide velocity dynamic range Doppler optical coherence tomography (Part II): Imaging in vivo cardiac dynamics of Xenopus laevis. Optics Express 2003;11:1650-8. [Crossref] [PubMed]
- Davis A, Izatt J, Rothenberg F. Quantitative Measurement of Blood Flow Dynamics in Embryonic Vasculature Using Spectral Doppler Velocimetry. Anat Rec (Hoboken) 2009;292:311-9. [Crossref] [PubMed]
- Larina IV, Sudheendran N, Ghosn M, Jiang J, Cable A, Larin KV, Dickinson M. Live imaging of blood flow in mammalian embryos using Doppler swept-source optical coherence tomography. J Biomed Opt 2008;13:060506. [Crossref] [PubMed]
- Rugonyi S, Shaut C, Liu A, Thornburg K, Wang RK. Changes in wall motion and blood flow in the outflow tract of chick embryonic hearts observed with optical coherence tomography after outflow tract banding and vitelline-vein ligation. Phys Med Biol 2008;53:5077-91. [Crossref] [PubMed]
- Larina IV, Ivers S, Syed S, Dickinson ME, Larin KV. Hemodynamic measurements from individual blood cells in early mammalian embryos with Doppler swept source OCT. Optics Letters 2009;34:986-8. [Crossref] [PubMed]
- Jacques SL. Optical properties of biological tissues: a review. Phys Med Biol 2013;58:R37-61. [Crossref] [PubMed]
- Splinter R, Svenson RH, Littmann L, Chuang CH, Tuntelder JR, Thompson M, Tatsis GP, Keijzer M. Computer simulated light distributions in myocardial tissues at the Nd-YAG wavelength of 1064 nm. Lasers Med Sci 1993;8:15-21. [Crossref]
- Fleming CP, Ripplinger CM, Webb B, Efimov IR, Rollins AM. Quantification of cardiac fiber orientation using optical coherence tomography. J Biomed Opt 2008;13:030505. [Crossref] [PubMed]
- Gan Y, Tsay D, Amir SB, Marboe CC, Hendon CP. Automated classification of optical coherence tomography images of human atrial tissue. J Biomed Opt 2016;21:101407. [Crossref] [PubMed]
- Sudheendran N, Mohamed M, Ghosn MG, Tuchin VV, Larin KV. Assessment of tissue optical clearing as a function of glucose concentration using optical coherence tomography. J Innov Opt Health Sci 2010;3:169-76. [Crossref] [PubMed]
- Zhernovaya O, Tuchin VV, Leahy MJ. Blood optical clearing studied by optical coherence tomography. J Biomed Opt 2013;18:26014. [Crossref] [PubMed]
- Cua M, Lin E, Lee L, Sheng X, Wong KS, Tibbits GF, Beg MF, Sarunic MV. Morphological phenotyping of mouse hearts using optical coherence tomography. J Biomed Opt 2014;19:116007. [Crossref] [PubMed]
- Goergen CJ, Radhakrishnan H, Sakadzic S, Mandeville ET, Lo EH, Sosnovik DE, Srinivasan VJ. Optical coherence tractography using intrinsic contrast. Opt Lett 2012;37:3882-4. [Crossref] [PubMed]
- Ambrosi CM, Moazami N, Rollins AM, Efimov IR. Virtual histology of the human heart using optical coherence tomography. J Biomed Opt 2009;14:054002. [Crossref] [PubMed]
- Zhao X, Fu X, Blumenthal C, Wang YT, Jenkins MW, Snyder C, Arruda M, Rollins AM. Integrated RFA/PSOCT catheter for real-time guidance of cardiac radio-frequency ablation. Biomed Opt Express 2018;9:6400-11. [Crossref] [PubMed]
- Fu X, Wang Z, Wang H, Wang YT, Jenkins MW, Rollins AM. Fiber-optic catheter-based polarization-sensitive OCT for radio-frequency ablation monitoring. Optics Letters 2014;39:5066-9. [Crossref] [PubMed]
- Wang H, Kang W, Carrigan T, Bishop A, Rosenthal N, Arruda M, Rollins AM. In vivo intracardiac optical coherence tomography imaging through percutaneous access: toward image-guided radio-frequency ablation. J Biomed Opt 2011;16:110505. [Crossref] [PubMed]
- Wood MFG, Ghosh N, Wallenburg MA, Li SH, Weisel RD, Wilson BC, Li RK, Vitkin IA. Polarization birefringence measurements for characterizing the myocardium, including healthy, infarcted, and stem-cell-regenerated tissues. J Biomed Opt 2010;15:047009. [Crossref] [PubMed]
- Ahmad I. Review of the emerging role of optical polarimetry in characterization of pathological myocardium. J Biomed Opt 2017;22:1-8. [Crossref] [PubMed]
- Everett MJ, Schoenenberger K, Colston BW Jr, Da Silva LB. Birefringence characterization of biological tissue by use of optical coherence tomography. Opt Lett 1998;23:228-30. [Crossref] [PubMed]
- Gould GM. An Illustrated Dictionary of Medicine, Biology and Allied Sciences: Including the Pronunciation, Accentuation, Derivation, and Definition of the Terms Used in Medicine, Anatomy, Surgery. P. Blakiston, Son & Company, 1896.
- Armstrong AT, Binkley PF, Baker PB, Myerowitz PD, Leier CV. Quantitative investigation of cardiomyocyte hypertrophy and myocardial fibrosis over 6 years after cardiac transplantation. J Am Coll Cardiol 1998;32:704-10. [Crossref] [PubMed]
- Pluijmert M, Kroon W, Rossi AC, Bovendeerd PHM, Delhaas T. Why SIT Works: Normal Function Despite Typical Myofiber Pattern in Situs Inversus Totalis (SIT) Hearts Derived by Shear-induced Myofiber Reorientation. PLoS Comput Biol 2012;8:e1002611. [Crossref] [PubMed]
- Nikou A, Gorman RC, Wenk JF. Sensitivity of left ventricular mechanics to myofiber architecture: A finite element study. Proc Inst Mech Eng H 2016;230:594-8. [Crossref] [PubMed]
- Wang HM, Gao H, Luo XY, Berry C, Griffith BE, Ogden RW, Wang TJ. Structure-based finite strain modelling of the human left ventricle in diastole. Int J Numer Method Biomed Eng 2013;29:83-103. [Crossref] [PubMed]
- Shenasa M, Hindricks G, Borggrefe M, Breithardt G, Josephson ME, Zipe DP. Cardiac Mapping. Wiley, 2012.
- Sano T, Takayama N, Shimamoto T. Directional difference of conduction velocity in the cardiac ventricular syncytium studied by microelectrodes. Circ Res 1959;7:262-7. [Crossref] [PubMed]
- Kléber AG, Rudy Y. Basic Mechanisms of Cardiac Impulse Propagation and Associated Arrhythmias. Physiol Rev 2004;84:431-88. [Crossref] [PubMed]
- Ho SY, Sanchez-Quintana D. The importance of atrial structure and fibers. Clin Anat 2009;22:52-63. [Crossref] [PubMed]
- Sosnovik DE, Wang R, Dai G, Wang T, Aikawa E, Novikov M, Rosenzweig A, Gilbert RJ, Wedeen VJ. Diffusion spectrum MRI tractography reveals the presence of a complex network of residual myofibers in infarcted myocardium. Circ Cardiovasc Imaging 2009;2:206-12. [Crossref] [PubMed]
- Hucker WJ, Ripplinger CM, Fleming CP, Fedorov VV, Rollins AM, Efimov IR. Bimodal biophotonic imaging of the structure-function relationship in cardiac tissue. J Biomed Opt 2008;13:054012. [Crossref] [PubMed]
- Gan Y, Fleming CP. Extracting three-dimensional orientation and tractography of myofibers using optical coherence tomography. Biomed Opt Express 2013;4:2150-65. [Crossref] [PubMed]
- Ambrosi CM, Fedorov VV, Schuessler RB, Rollins AM, Efimov IR. Quantification of fiber orientation in the canine atrial pacemaker complex using optical coherence tomography. J Biomed Opt 2012;17:071309. [Crossref] [PubMed]
- Lye TH, Iyer V, Marboe CC, Hendon CP. Mapping the human pulmonary venoatrial junction with optical coherence tomography. Biomed Opt Express 2019;10:434-48. [Crossref] [PubMed]
- Goergen CJ, Chen HH, Sakadžić S, Srinivasan VJ, Sosnovik DE. Microstructural characterization of myocardial infarction with optical coherence tractography and two-photon microscopy. Physiol Rep 2016;4. [Crossref] [PubMed]
- Castonguay A, Lefebvre J, Pouliot P, Avti P, Moeini M, Lesage F. Serial optical coherence scanning reveals an association between cardiac function and the heart architecture in the aging rodent heart. Biomed Opt Express 2017;8:5027-38. [Crossref] [PubMed]
- Li Z, Tang Q, Dickfeld T, Chen Y. Depth-resolved mapping of muscular bundles in myocardium pulmonary junction using optical coherence tomography. J Biomed Opt 2018;23:1-5. [PubMed]
- McLean JP, Gan Y, Lye TH, Qu D, Lu H, Hendon CP. High-speed collagen fiber modeling and orientation quantification for optical coherence tomography imaging. Optics Express 2019;27:14457-71. [Crossref]
- Efimov IR. Innovation in optical imaging: looking inside the heart. Heart Rhythm 2007;4:925-6. [Crossref] [PubMed]
- Efimov IR, Nikolski VP, Salama G. Optical imaging of the heart. Circ Res 2004;95:21-33. [Crossref] [PubMed]
- Jenkins M, Wade RS, Cheng Y, Rollins AM, Efimov IR. Optical coherence tomography imaging of the purkinje network. J Cardiovasc Electrophysiol 2005;16:559-60. [Crossref] [PubMed]
- Gupta M, Rollins AM, Izatt JA, Efimov IR. Imaging of the atrioventricular node using optical coherence tomography. J Cardiovasc Electrophysiol 2002;13:95. [Crossref] [PubMed]
- Lye TH, Vincent KP, McCulloch AD, Hendon CP. Tissue-Specific Optical Mapping Models of Swine Atria Informed by Optical Coherence Tomography. Biophys J 2018;114:1477-89. [Crossref] [PubMed]
- Rivas RN, Lye TH, Hendon CP. Impact of radiofrequency ablation geometry on electrical conduction. Proc SPIE 10471 Diagnostic and Therapeutic Applications of Light in Cardiology 2018;2018:104710Q.
- Gutbrod SR, Walton R, Gilbert S, Meillet V, Jais P, Hocini M, Haissaguerre M, Dubois R, Bernus O, Efimov IR. Quantification of the transmural dynamics of atrial fibrillation by simultaneous endocardial and epicardial optical mapping in an acute sheep model. Circ Arrhythm Electrophysiol 2015;8:456-65. [Crossref] [PubMed]
- Singh-Moon RP, Marboe CC, Hendon CP. Near-infrared spectroscopy integrated catheter for characterization of myocardial tissues: preliminary demonstrations to radiofrequency ablation therapy for atrial fibrillation. Biomed Opt Express 2015;6:2494-511. [Crossref] [PubMed]
- Singh-Moon RP, Yao X, Iyer V, Marboe C, Whang W, Hendon CP. Real RealReal. RealRealReal Hendon CP. Realaracterization of myocardial tissues: preliminary demonstrations to radiofrJ Biophotonics 2019;12:e201800144.
- Mercader M, Swift L, Sood S, Asfour H, Kay M, Sarvazyan N. Use of endogenous NADH fluorescence for real-time in situ visualization of epicardial radiofrequency ablation lesions and gaps. Am J Physiol Heart Circ Physiol 2012;302:H2131-8. [Crossref] [PubMed]
- Conrad CH, Brooks WW, Hayes JA, Sen S, Robinson KG, Bing OH. Myocardial fibrosis and stiffness with hypertrophy and heart failure in the spontaneously hypertensive rat. Circulation 1995;91:161-70. [Crossref] [PubMed]
- Tanaka K, Zlochiver S, Vikstrom KL, Yamazaki M, Moreno J, Klos M, Zaitsev AV, Vaidyanathan R, Auerbach DS, Landas S, Guiraudon G, Jalife J, Berenfeld O, Kalifa J. Spatial distribution of fibrosis governs fibrillation wave dynamics in the posterior left atrium during heart failure. Circ Res 2007;101:839-47. [Crossref] [PubMed]
- Marrouche NF, Wilber D, Hindricks G, Jais P, Akoum N, Marchlinski F, Kholmovski E, Burgon N, Hu N, Mont L, Deneke T, Duytschaever M, Neumann T, Mansour M, Mahnkopf C, Herweg B, Daoud E, Wissner E, Bansmann P, Brachmann J. Association of atrial tissue fibrosis identified by delayed enhancement MRI and atrial fibrillation catheter ablation: the DECAAF study. JAMA 2014;311:498-506. [Crossref] [PubMed]
- McMurray JJ, Pfeffer MA. Heart failure. Lancet 2005;365:1877-89. [Crossref] [PubMed]
- Hanif W, Alex L, Su Y, Shinde AV, Russo I, Li N, Frangogiannis NG. Left atrial remodeling, hypertrophy, and fibrosis in mouse models of heart failure. Cardiovasc Pathol 2017;30:27-37. [Crossref] [PubMed]
- Clauss S, Bleyer C, Schuttler D, Tomsits P, Renner S, Klymiuk N, Wakili R, Massberg S, Wolf E, Kaab S. Animal models of arrhythmia: classic electrophysiology to genetically modified large animals. Nat Rev Cardiol 2019. Epub ahead of print. [Crossref] [PubMed]
- Sun CW, Wang YM, Lu LS, Lu CW, Hsu IJ, Tsai MT, Yang CC, Kiang YW, Wu CC. Myocardial tissue characterization based on a polarization-sensitive optical coherence tomography system with an ultrashort pulsed laser. J Biomed Opt 2006;11:054016. [Crossref] [PubMed]
- Fan C, Yao G. Imaging myocardial fiber orientation using polarization sensitive optical coherence tomography. Biomed Opt Express 2013;4:460-5. [Crossref] [PubMed]
- Wang Y, Yao G. Optical tractography of the mouse heart using polarization-sensitive optical coherence tomography. Biomed Opt Express 2013;4:2540-5. [Crossref] [PubMed]
- Wang Y, Zhang K, Wasala NB, Yao X, Duan D, Yao G. Histology validation of mapping depth-resolved cardiac fiber orientation in fresh mouse heart using optical polarization tractography. Biomed Opt Express 2014;5:2843-55. [Crossref] [PubMed]
- Wang Y, Zhang K, Duan D, Yao G. Heart structural remodeling in a mouse model of Duchenne cardiomyopathy revealed using optical polarization tractography. Biomed Opt Express 2017;8:1271-6. [Crossref] [PubMed]
- Wang Y, Ravanfar M, Zhang K, Duan D, Yao G. Automatic quantification of microscopic heart damage in a mouse model of Duchenne muscular dystrophy using optical polarization tractography. J Biophotonics 2018;11:e201700284. [Crossref] [PubMed]
- Kim J, Brown W, Maher JR, Levinson H, Wax A. Functional optical coherence tomography: principles and progress. Phys Med Biol 2015;60:R211-37. [Crossref] [PubMed]
- Qin W, Roberts MA, Qi X, Murry CE, Zheng Y, Wang RK. Depth-resolved 3D visualization of coronary microvasculature with optical microangiography. Phys Med Biol 2016;61:7536-50. [Crossref] [PubMed]
- Redd MA, Zeinstra N, Qin W, Wei W, Martinson A, Wang Y, Wang RK, Murry CE, Zheng Y. Patterned human microvascular grafts enable rapid vascularization and increase perfusion in infarcted rat hearts. Nat Commun 2019;10:584. [Crossref] [PubMed]
- de Boer JF, Hitzenberger CK, Yasuno Y. Polarization sensitive optical coherence tomography - a review. Biomed Opt Express 2017;8:1838-73. [Crossref] [PubMed]
- Ghosh N, Wood MF, Li SH, Weisel RD, Wilson BC, Li RK, Vitkin IA. Mueller matrix decomposition for polarized light assessment of biological tissues. J Biophotonics 2009;2:145-56. [Crossref] [PubMed]
- Ahmad I, Gribble A, Ikram M, Pop M, Vitkin A. Polarimetric assessment of healthy and radiofrequency ablated porcine myocardial tissue. J Biophotonics 2016;9:750-9. [Crossref] [PubMed]
- Wang S, Singh M, Tran TT, Leach J, Aglyamov SR, Larina IV, Martin JF, Larin KV. Biomechanical assessment of myocardial infarction using optical coherence elastography. Biomed Opt Express 2018;9:728-42. [Crossref] [PubMed]
- van Soest G, Goderie T, Regar E, Koljenovic S, van Leenders GL, Gonzalo N, van Noorden S, Okamura T, Bouma BE, Tearney GJ, Oosterhuis JW, Serruys PW, van der Steen AF. Atherosclerotic tissue characterization in vivo by optical coherence tomography attenuation imaging. J Biomed Opt 2010;15:011105. [Crossref] [PubMed]
- Tsai MR, Chiu YW, Lo MT, Sun CK. Second-harmonic generation imaging of collagen fibers in myocardium for atrial fibrillation diagnosis. J Biomed Opt 2010;15:026002-6. [Crossref] [PubMed]
- Martin TP, Norris G, McConnell G, Currie S. A novel approach for assessing cardiac fibrosis using label-free second harmonic generation. Int J Cardiovasc Imaging 2013;29:1733-40. [Crossref] [PubMed]
- Schmitt JM, Xiang SH. Cross-polarized backscatter in optical coherence tomography of biological tissue. Optics Letters 1998;23:1060-2. [Crossref] [PubMed]
- Feldchtein F, Gelikonov GV, Gelikonov VM, Iksanov RR, Kuranov RV, Sergeev AM, Gladkova ND, Ourutina MN, Warren JA, Reitze DH. In vivo OCT imaging of hard and soft tissue of the oral cavity. Optics Express 1998;3:239-50. [Crossref] [PubMed]
- Gladkova N, Streltsova O, Zagaynova E, Kiseleva E, Gelikonov V, Gelikonov G, Karabut M, Yunusova K, Evdokimova O. Cross-polarization optical coherence tomography for early bladder-cancer detection: statistical study. J Biophotonics 2011;4:519-32. [Crossref] [PubMed]
- Rasmussen K, Reilly C, Li Y, Jones RS. Real-time imaging of anti-biofilm effects using CP-OCT. Biotechnol Bioeng 2016;113:198-205. [Crossref] [PubMed]
- Yao X, Gan Y, Ling Y, Marboe CC, Hendon CP. Multicontrast endomyocardial imaging by single-channel high-resolution cross-polarization optical coherence tomography. J Biophotonics 2018;11:e201700204. [Crossref] [PubMed]
- Haines DE. The biophysics of radiofrequency catheter ablation in the heart: the importance of temperature monitoring. Pacing Clin Electrophysiol 1993;16:586-91. [Crossref] [PubMed]
- Demazumder D, Mirotznik MS, Schwartzman D. Biophysics of radiofrequency ablation using an irrigated electrode. J Interv Card Electrophysiol 2001;5:377-89. [Crossref] [PubMed]
- Sra J, Narayan G, Krum D, Malloy A, Cooley R, Bhatia A, Dhala A, Blanck Z, Nangia V, Akhtar M. Computed tomography-fluoroscopy image integration-guided catheter ablation of atrial fibrillation. J Cardiovasc Electrophysiol 2007;18:409-14. [Crossref] [PubMed]
- Calkins H, Hindricks G, Cappato R, Kim YH, Saad EB, Aguinaga L, Akar JG, Badhwar V, Brugada J, Camm J, Chen PS, Chen SA, Chung MK, Nielsen JC, Curtis AB, Davies DW, Day JD, d'Avila A, de Groot N, Di Biase L, Duytschaever M, Edgerton JR, Ellenbogen KA, Ellinor PT, Ernst S, Fenelon G, Gerstenfeld EP, Haines DE, Haissaguerre M, Helm RH, Hylek E, Jackman WM, Jalife J, Kalman JM, Kautzner J, Kottkamp H, Kuck KH, Kumagai K, Lee R, Lewalter T, Lindsay BD, Macle L, Mansour M, Marchlinski FE, Michaud GF, Nakagawa H, Natale A, Nattel S, Okumura K, Packer D, Pokushalov E, Reynolds MR, Sanders P, Scanavacca M, Schilling R, Tondo C, Tsao HM, Verma A, Wilber DJ, Yamane T. 2017 HRS/EHRA/ECAS/APHRS/SOLAECE expert consensus statement on catheter and surgical ablation of atrial fibrillation: Executive summary. J Arrhythm 2017;33:369-409. [Crossref] [PubMed]
- Swartling J, Palsson S, Platonov P, Olsson SB, Andersson-Engels S. Changes in tissue optical properties due to radio-frequency ablation of myocardium. Med Biol Eng Comput 2003;41:403-9. [Crossref] [PubMed]
- Sato S, Shimada T, Ishihara M, Arai T, Matsui T, Kurita A, Obara M, Kikuchi M, Wakisaka H, Ashida H. Laser Ablation Characteristics of Myocardium Tissue in the UV Spectral Region: An In-vitro Study with Porcine Myocardium Tissue. OSA BOSD1999.
- Bosman S. Heat-induced structural alterations in myocardium in relation to changing optical properties. Applied Optics 1993;32:461-3. [Crossref] [PubMed]
- Whittaker P, Zheng S-m, Patterson MJ, Kloner RA, Daly KE, Hartman RA. Histologic Signatures of Thermal Injury: Applications in Transmyocardial Laser Revascularization and Radiofrequency Ablation. Lasers Surg Med 2000;27:305-18. [Crossref] [PubMed]
- Fleming CP, Quan KJ, Rollins AM. Toward guidance of epicardial cardiac radiofrequency ablation therapy using optical coherence tomography. J Biomed Opt 2010;15:041510. [Crossref] [PubMed]
- Herranz D, Lloret J, Jiménez-Valero S, Rubio-Guivernau JL, Margallo-Balbás E. Novel catheter enabling simultaneous radiofrequency ablation and optical coherence reflectometry. Biomed Opt Express 2015;6:3268-75. [Crossref] [PubMed]
- Fleming CP, Quan KJ, Wang H, Amit G, Rollins AM. In vitro characterization of cardiac radiofrequency ablation lesions using optical coherence tomography. Opt Express 2010;18:3079-92. [Crossref] [PubMed]
- Huang SKS, Wood MA. Catheter Ablation of Cardiac Arrhythmias. Saunders; 2006.
- Cooper JM, Sapp JL, Tedrow U, Pellegrin CP, Robinson D, Epstein LM, Stevenson WG. Ablation with an internally irrigated radiofrequency catheter: Learning how to avoid steam pops. Heart Rhythm 2004;1:329-33. [Crossref] [PubMed]

