

Renal cell carcinoma: preoperative evaluate the grade of histological malignancy using volumetric histogram analysis derived from magnetic resonance diffusion kurtosis imaging
Introduction
Renal cell carcinoma (RCC) is the most common pathological type of kidney cancer. Its global morbidity and mortality increased at a rate of about 2–3% per decade (1). Histologic grade of RCC affects both patient’s prognosis and surgical planning. Consequently, an accurate preoperative assessment is essential (2,3). Histologic grade is mainly based on the Fuhrman classification system, which requires a needle biopsy or postoperative pathological examination. However, a biopsy is inherently invasive with multiple possible complications. Problems such as sampling errors and observer variability limit its application (4,5). Therefore, there is a need to develop non-invasive preoperative assessment methods.
Multi-parametric magnetic resonance imaging (MRI) technology is a powerful tool for the diagnosis of renal disease benefit from its characteristics of non-invasive, no ionizing radiation, high soft tissue resolution, and multi-parameter imaging. Diffusion-weighted imaging (DWI) is a functional technology that develops image contrast based on the inhibition of migration of water molecules in tissues by tissue microstructures. As a result of the dense cellularity, malignant tissue has restricted diffusion, which is reflected by a low mean apparent diffusion coefficient (ADC). DWI is based on the Gaussian distribution of the diffusion motion of water molecules. However, the diffusion motion of water molecules in biological tissues is limited by various tissue microstructures including cell size, arrangement, distribution, which make the diffusion does not follow a Gaussian distribution.
Diffusion kurtosis imaging (DKI) is a further extension of the DWI model. It quantifies the non-Gaussian diffusion behavior of water molecules, yields a corrected ADC (Dapp) and apparent kurtosis coefficient (Kapp). Kapp can quantify diffusion heterogeneity and assess the complexity of tissue microstructural environment (6,7). Routine parameter measurements only provide mean values without considering its potential spatial distribution. Histogram analysis is a mathematical approach to evaluate the variations of parameters of all voxels in a region of interest (ROI), it more comprehensively estimates biological characteristics of the tumor, including spatial distribution and histological heterogeneity. This method had been widely applied in neoplasms for diagnosis, grading, staging, typing, and treatment response assessment (8-15). In advanced rectal adenocarcinoma, DKI metrics with whole tumor volume histogram analysis was associated with important prognostic factors (9). In another study of glioma, DKI histogram parameters were able to improve the accuracy of glioma grading before surgery (10). However, to the best of our knowledge, the use of DKI histogram analysis as a surrogate marker of RCC histological grading has not been explored yet. This study uses a histogram analysis of DKI to differentiate high and low- grade of RCCs for the first time. The observations in histogram analysis of DKI may be a potential biomarker reflecting increased heterogeneity and asymmetric distribution of RCC. We hypothesized that DKI histogram parameters might differ between different grades of RCC. Therefore, the purpose of this study was to investigate the value of histogram parameters derived from DKI in the assessment of RCC grading before surgery.
Methods
Patients
This study was approved by the Ethics Committee of our hospital. Informed consent requirement was waived because of its retrospective nature. From May 2015 to June 2018, 109 patients who underwent preoperative MRI, including routine sequences and DKI sequence, were involved in the present study. They were all diagnosed as RCC based on the histological assessment. The exclusion criteria were: (I) patients who underwent anti-tumor therapy before MRI examination (n=15); (II) image artifacts leaded to inability of observe lesions or accurately depict the ROI (n=12) (motion artifact, n=4 cases; magnetic sensitive artifact, n=8); (III) time between operation and MRI examination exceeded 1 month (n=7); (IV) recurrent tumor patients (n=2). Finally, 73 patients composed the study population. Among the 73 patients, there were 45 male patients (mean age, 59.2 years; range, 35–80 years) and 28 female patients (mean age, 57.4 years; range, 38–71 years) with an overall mean age of 58.5 years (range, 35–80 years). The average maximum diameter of the tumors was 4.3 cm (range, 2.3–12.8 cm).
MRI protocol
All MRI examinations were performed on a 3.0T MRI system (MAGNETOM Prisma, Siemens Medical Solutions, Erlangen, Germany) using a 16-channel phased array body coil for anatomic coverage of the abdomen. All patients underwent a supine position scan. The routine MRI protocol included axial T1 weighted imaging, axial T2 fat suppression weighted imaging, and coronal T2-weighted imaging sequence. The DKI sequence was acquired using a single shot diffusion-weighted echo-plane imaging sequence with five b values of 200, 500, 1,000, 1,500 and 2,000 s/mm2 in three orthogonal directions under free breathing. Imaging parameters were as follows: repetition time/echo time =4,400/86 ms, field of view =320×240 mm, section thickness =5 mm, intersection gap =1 mm, the number of average of five b value is 1, 1, 2, 3 and 4, respectively, scan matrix =128×128, number of slices =30. The acquisition time was 3 min 26 s.
Image analysis
Original digital imaging and communications in medicine (DICOM) data of DKI sequence were post-processed using an in-house program written in MATLAB (version 2013b, MathWorks, Natick, Massachusetts, USA). For the DKI model, five b value data were fitted according to the following equation [1]:
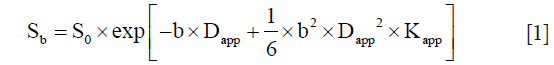
Where Sb is the DWI signal intensity at a specified b value, S0 is the baseline signal at b=0. Kapp is the apparent kurtosis coefficient, and it is a unitless parameter indicates the deviation of water motion from the Gaussian distribution. Dapp is similar to ADC after the correction of Gaussian diffusion behavior of water molecules. ADC was obtained from the same data using all b values for fitting based on the mono-exponential model according to the >equation [2]:

Where Sb is the signal intensity for a given b value, S0 is signal intensity at b=0, b is the diffusion sensitivity factor.
All parameter maps were analyzed by two abdominal radiologists with 7 and 20 years of experience, respectively, who were blinded to clinical data and pathological diagnosis. Freehand ROI were outlined around the tumor on DW b1,000 (b=1,000 s/mm2) images and simultaneously copied to ADC, Dapp and Kapp maps using the in-house program written in MATLAB. ROIs of all slices that cover the whole tumor were selected in each patient and excluded the bleeding, calcifications, necrosis and cystic areas. Raw data of ADC, Dapp, and Kapp for each voxel in the ROI were automatically generated by the software (Figure 1).

Histologic results
Pathologic characteristics were evaluated from surgical resection specimens, and assessed by a dedicated urological pathologist with 12 years of experience. He was blinded to the previous MRI findings and clinical information and reviewed all the histological slides (×200) using an optical microscope (Nikon Eclipse E600, Nikon, Osaka, Japan). Images were digitally photographed, and a nuclear grade 1–4 (G1–4) for each sample was assigned based on the Fuhrman grading system (16).
Statistical analysis
Voxel-based raw data of each ROI were used for histogram analysis, then the following parameters for each ROI were calculated: mean, standard deviation (SD), skewness (skew), kurtosis and cumulative frequency distributions of 10th, 25th, 50th, 75th, and 90th percentiles. The interobserver agreement for DKI parameters was assessed by calculating the interclass correlation coefficient (ICC). Data of G1 and G2 were combined into low-grade group and G3 and G4 were combined into high-grade group because of the small number of G1 and G4 tumors. Data were expressed as mean ± SD, or median (25th–75th percentile). The normality of variables was evaluated. Differences of all histogram parameters between the two group were evaluated using Student’s t-test or Mann-Whiney U test. Receiver operating characteristic (ROC) curve was used to assess the area under the curve (AUC) and determine the optimum threshold of each histogram metric in distinguish low- grade RCC from high-grade RCC. The best cut-off point was selected by the biggest Youden index. A two-sided P value of less than 0.05 was considered to be significantly different. All statistical analyses were performed using IBM SPSS software (version 21.0, Chicago, IL, USA).
Results
According to the histologic evaluation results, 73 specimens were classified as G1 (n=6), G2 (n=34), G3 (n=29) and G4 (n=4). G1 and G2 were classified as low- grade groups, while G3 and G4 were merged into high-grade groups. The ICC of DKI and DWI parameters of the two radiologists were all higher than 0.75, which suggest good intra-observer agreements. Therefore, our result was based on the more experienced reader’s observation.
The histogram analysis values of Kapp, Dapp, and ADC for all lesions were summarized in Table 1. The Kapp 10th, 25th, 50th, 75th, and 90th percentile, Kapp mean and Kapp SD values were significantly higher in high- grade group than that in low-grade group (P<0.05). In contrast, ADC 50th percentile, mean and kurtosis values and Dapp 25th percentile were significantly higher in the low-grade group than that in the high-grade group (P<0.05). Dapp mean and Dapp kurtosis were different in high- and low-grade groups, but the differences were not significant, their P value were 0.057 and 0.072, respectively. The Box plot also showed a comparison of different grades of RCC (Figure 2). These parameters were significantly different between high- and low-grade tumors (P<0.05).

Full table

The ROC curve analysis showed that ADC 50th, ADC mean, ADC kurtosis, Dapp 25th, Kapp 10th, 25th, 50th, 75th, 90th percentile, Kapp mean and Kapp SD values could effectively distinguish between high- and low-grade RCCs. Kapp mean had the highest AUC value (0.889). Kapp 90th and Kapp mean they had the same highest sensitivity (89.7%). Kapp 25th had the highest specificity (92.5%). Kapp 25th had the highest positive predictive value (PPV) (88%), and Kapp mean had the highest negative predictive value (NPV) (88.9%). Kapp mean and Kapp 75th had the same highest diagnostic accuracy (83.6%) (Table 2, Figure 3).

Full table

Discussion
In this study, we found that histogram metrics of ADC, Dapp and Kapp were significantly different between high- and low- grade RCCs. Furthermore, in comparison with ADC value derived from mono-exponential DWI model, Kapp mean based on DKI model may yield better diagnostic accuracy and reflect the microstructural complexity of the tumor. Histogram analysis based on voxel distribution was able to provide more quantitative information about tumor heterogeneity by obtaining additional parameters to depict the distribution of signal intensity. Such as SD, kurtosis and skewness, either of them could reflect the deviation of the histogram from the normal distribution. Histogram analysis of dynamic contrast-enhanced (DCE) MRI and DWI had demonstrated their potential for RCC assessment and subtype differentiation (17,18). Wang et al. (17) showed that although the histogram method was not superior to the conventional mean value method, it could provide more information about tumor heterogeneity. Li et al. (18) demonstrated that quantitative volumetric ADC histogram analysis helped differentiate various subtypes of small solid renal tumors.
DKI could quantify the extent of diffusion restriction and the tissue microstructure complexity. The complexity of tissue structures was associated with high Kapp values (7,19). Some studies showed that the mean Kapp value was significantly lower in low- grade tumors than that in high- grade tumors (20,21). Our results were consistent with theirs, in the present study, the 10th, 25th, 50th, 75th, 90th percentile, mean and SD of Kapp in low-grade RCC were all significantly lower than those in high-grade group. Kapp mean was the best parameter of differentiating RCC grades (AUC =0.889). More complex cell structure, higher cell densities, and more nuclear atypia associated with greater angiogenesis and tissue necrosis were observed in high-grade tumors (20-22). Thus, the 10th, 25th, 50th, 75th, 90th percentile and mean of Kapp of high-grade RCC were higher than those of low-grade tumors. Also, the standard deviation of the Kapp value of the high-grade group was higher than that of the low-grade group, which was indicated the heterogeneity of histogram distribution, and also indicated the increase of the complexity of tumor microstructure.
Previously published studies had shown that the ADC obtained from DWI and true diffusion coefficient (D) obtained from intravoxel incoherent motion (IVIM) DWI helped differentiate the pathological grade of RCC. Several studies have also reported that the ADC and D values of high-grade RCC were significantly lower than those of low- grade RCC (20,23-26). Zhang et al. (20) showed that the 10th percentile ADC had the highest accuracy in discriminating low- from high-grade clear cell RCC. Dai et al. (26) reported that mean Dapp value was significantly lower in G1 and G2 RCC than that in G3&4. Our results were similar to theirs. In the present study, the mean ADC and 50th percentile ADC values of low-grade group were significantly higher than that of high-grade group. The reason may be because these results reflect the pathological characteristics of RCCs in common. Cell density and cell composition of the tumors are key factors that determine their pathological grade (2,3,27). In high-grade tumors, the quantity and density of the tumor cells increase fast. The cells proliferate actively, arrange densely, and increased nuclear atypia, polykaryocyte, megakaryocyte, and cytoplasm ratios, restrict the diffusion of water molecules and decrease the ADC value.
Also, the present study also showed that the Dapp 25th percentile and ADC 50th percentile in low-grade group were significantly higher than those in high-grade group, and the ADC kurtosis was lower than that of high- grade group. Zhang et al. (20) reported that mean, median, and 10th percentile ADC of low-grade clear cell RCC were significantly higher than those of high-grade clear cell RCC. Dai et al. (26) showed a negative correlation between mean Dapp value and nuclear-to-cytoplasm (N/C) ratio of RCC, high-grade tumors had lower mean Dapp value and higher N/C ratio than those of low-grade tumors. These findings provide a more detailed distribution of tumor cells of RCC, finding that high-grade tumors have a higher heterogeneity, as the density and quantity are higher. As a result, the diffusion of water molecules in high-grade tumors are more restricted, then the 25th percentile Dapp and 50th percentile ADC decrease. In high-grade group, the histogram distribution of voxels is more likely to skew to the left or right, then the skewness of ADC value increases and the peak of data distribution tends to be sharper, the ADC kurtosis value increase.
Dai et al. (27) reported that mean Kapp had the highest diagnostic value between normal renal parenchyma and clear cell RCC when the optimum diagnostic threshold was 0.54, but ROC analysis of different grade of RCC was not given in the study. Wu et al. (21) reported the high AUC value of mean Dapp and mean Kapp between the different grade of RCC. The results of our study were consistent with the previous studies. Kapp mean had the highest diagnostic value. The AUC and the cut-off value of Kapp mean were 0.886 and 0.625, respectively, and the sensitivity, specificity, and accuracy were 87.9%, 80%, and 83.6%, respectively. The specificity and accuracy of Kapp were higher than those of ADC and Dapp. Besides, the 75th percentile Kapp showed high diagnostic accuracy, which was equal to Kapp mean.
This study also had several limitations. Firstly, the sample size was small, especially for the G1 and G4 tumor samples, the reliability of the results should be confirmed in larger patient samples by prospective studies. Secondly, high b value DWI images had a low signal-to-noise ratio and hence impairing the fitting of DKI and DWI parameters. A multi-step weighted linear least-squares approach would be useful which could provide high performance in terms of accuracy (28). Thirdly, free breathing was used during the scan, although kidney is a retroperitoneal organ, motion artifacts may still occur, resulting in biased results. The use of 3D non-rigid registration techniques may greatly reduce the effects of motion displacement. Finally, artifacts in the body DWI sequence was also a problem. Respiratory gating techniques can be used to suppress motion artifacts, but this will significantly increase scan time. Rapid imaging techniques, such as compressed sensing, are expected to solve this problem. However, RCC patients with a large amount of bleeding, DWI and DKI maybe not applicable.
In conclusion, the present study had demonstrated that DKI histogram parameters derived from Magnetic Resonance DKI were able to distinguish between high and low-grade RCC. Kapp mean was the best parameter of differentiating RCC grades. DKI is feasible for evaluating the non-Gaussian behavior of water diffusion and provides better performance than DWI in grading RCC. Further studies with larger sample sizes are warranted to explore the full potential of DKI for non-invasive imaging of RCCs.
Data availability
The data that support the findings of this study are available on request from the corresponding author (Guangyao Wu). The data are not publicly available because of the data above containing information that could compromise research participant privacy.
Acknowledgements
Funding: All the authors declare no conflict of interest. This study was supported by the National Natural Science Foundation of China (Grant no. 81227902), the National Key Basic Research Program (Grant no. 2016YFC1304702) and Shenzhen University Presidential Fund (Grant no. 85706-0000040544).
Footnote
Conflicts of Interest: The authors have no conflicts of interest to declare.
Ethical Statement: This study was approved by the Ethics Committee of our hospital. Informed consent requirement was waived because of its retrospective nature.
References
- Gupta K, Miller JD, Li JZ, Russell MW, Charbonneau C. Epidemiologic and socioeconomic burden of metastatic renal cell carcinoma (mRCC): a literature review. Cancer Treat Rev 2008;34:193-205. [Crossref] [PubMed]
- Minardi D, Lucarini G, Mazzucchelli R, Milanese G, Natali D, Galosi AB, Montironi R, Biagini G, Muzzonigro G. Prognostic role of Fuhrman grade and vascular endothelial growth factor in pT1a clear cell carcinoma in partial nephrectomy specimens. J Urol 2005;174:1208-12. [Crossref] [PubMed]
- Tsui KH, Shvarts O, Smith RB, Figlin RA, DeKernion JB, Belldegrun A. Prognostic indicators for renal cell carcinoma: a multivariate analysis of 643 patients using the revised 1997 TNM staging criteria. J Urol 2000;163:1090-5. [Crossref] [PubMed]
- Leveridge MJ, Finelli A, Kachura JR, Evans A, Chung H, Shiff DA, Fernandes K, Jewett MA. Outcomes of small renal mass needle core biopsy, nondiagnostic percutaneous biopsy, and the role of repeat biopsy. Eur Urol 2011;60:578-84. [Crossref] [PubMed]
- Lane BR, Samplaski MK, Herts BR, Zhou M, Novick AC, Campbell SC. Renal mass biopsy--a renaissance? J Urol 2008;179:20-7. [Crossref] [PubMed]
- Jensen JH, Helpern JA, Ramani A, Lu H, Kaczynski K. Diffusional kurtosis imaging: the quantification of non-gaussian water diffusion by means of magnetic resonance imaging. Magn Reson Med 2005;53:1432-40. [Crossref] [PubMed]
- Jensen JH, Helpern JA. MRI quantification of non-Gaussian water diffusion by kurtosis analysis. NMR Biomed 2010;23:698-710. [Crossref] [PubMed]
- Hu XX, Yang ZX, Liang HY, Ding Y, Grimm R, Fu CX, Liu H, Yan X, Ji Y, Zeng MS, Rao SX. Whole-tumor MRI histogram analyses of hepatocellular carcinoma: Correlations with Ki-67 labeling index. J Magn Reson Imaging 2017;46:383-92. [Crossref] [PubMed]
- Cui Y, Yang X, Du X, Zhuo Z, Xin L, Cheng X. Whole-tumour diffusion kurtosis MR imaging histogram analysis of rectal adenocarcinoma: Correlation with clinical pathologic prognostic factors. Eur Radiol 2018;28:1485-94. [Crossref] [PubMed]
- Qi XX, Shi DF, Ren SX, Zhang SY, Li L, Li QC, Guan LM. Histogram analysis of diffusion kurtosis imaging derived maps may distinguish between low and high grade gliomas before surgery. Eur Radiol 2018;28:1748-55. [Crossref] [PubMed]
- Just N. Improving tumour heterogeneity MRI assessment with histograms. Br J Cancer 2014;111:2205-13. [Crossref] [PubMed]
- Kyriazi S, Collins DJ, Messiou C, Pennert K, Davidson RL, Giles SL, Kaye SB, Desouza NM. Metastatic ovarian and primary peritoneal cancer: assessing chemotherapy response with diffusion-weighted MR imaging--value of histogram analysis of apparent diffusion coefficients. Radiology 2011;261:182-92. [Crossref] [PubMed]
- Suo S, Zhang K, Cao M, Suo X, Hua J, Geng X, Chen J, Zhuang Z, Ji X, Lu Q, Wang H, Xu J. Characterization of breast masses as benign or malignant at 3.0T MRI with whole-lesion histogram analysis of the apparent diffusion coefficient. J Magn Reson Imaging 2016;43:894-902. [Crossref] [PubMed]
- Wang S, Kim S, Zhang Y, Wang L, Lee EB, Syre P, Poptani H, Melhem ER, Lee JY. Determination of grade and subtype of meningiomas by using histogram analysis of diffusion-tensor imaging metrics. Radiology 2012;262:584-92. [Crossref] [PubMed]
- Xu XQ, Hu H, Su GY, Liu H, Hong XN, Shi HB, Wu FY. Utility of histogram analysis of ADC maps for differentiating orbital tumors. Diagn Interv Radiol 2016;22:161-7. [Crossref] [PubMed]
- Erdoğan F, Demirel A, Polat O. Prognostic significance of morphologic parameters in renal cell carcinoma. Int J Clin Pract 2004;58:333-6. [Crossref] [PubMed]
- Wang HY, Su ZH, Xu X, Sun ZP, Duan FX, Song YY, Li L, Wang YW, Ma X, Guo AT, Ma L, Ye HY. Dynamic Contrast-enhanced MR Imaging in Renal Cell Carcinoma: Reproducibility of Histogram Analysis on Pharmacokinetic Parameters. Sci Rep 2016;6:29146. [Crossref] [PubMed]
- Li A, Xing W, Li H, Hu Y, Hu D, Li Z, Kamel IR. Subtype Differentiation of Small (<= 4 cm) Solid Renal Mass Using Volumetric Histogram Analysis of DWI at 3-T MRI. AJR Am J Roentgenol 2018;211:614-23. [Crossref] [PubMed]
- Jensen JH, Falangola MF, Hu C, Tabesh A, Rapalino O, Lo C, Helpern JA. Preliminary observations of increased diffusional kurtosis in human brain following recent cerebral infarction. NMR Biomed 2011;24:452-7. [Crossref] [PubMed]
- Zhang YD, Wu CJ, Wang Q, Zhang J, Wang XN, Liu XS, Shi HB. Comparison of Utility of Histogram Apparent Diffusion Coefficient and R2* for Differentiation of Low-Grade From High-Grade Clear Cell Renal Cell Carcinoma. AJR Am J Roentgenol 2015;205:W193-201. [Crossref] [PubMed]
- Wu G, Zhao Z, Yao Q, Kong W, Xu J, Zhang J, Liu G, Dai Y. The Study of Clear Cell Renal Cell Carcinoma with MR Diffusion Kurtosis Tensor Imaging and Its Histopathologic Correlation. Acad Radiol 2018;25:430-8. [Crossref] [PubMed]
- Yu X, Lin M, Ouyang H, Zhou C, Zhang H. Application of ADC measurement in characterization of renal cell carcinomas with different pathological types and grades by 3.0T diffusion-weighted MRI. Eur J Radiol 2012;81:3061-6. [Crossref] [PubMed]
- Zhu Q, Ye J, Zhu W, Wu J, Chen W. Value of intravoxel incoherent motion in assessment of pathological grade of clear cell renal cell carcinoma. Acta Radiol 2018;59:121-7. [Crossref] [PubMed]
- Woo S, Suh CH, Kim SY, Cho JY, Kim SH. Diagnostic Performance of DWI for Differentiating High- From Low-Grade Clear Cell Renal Cell Carcinoma: A Systematic Review and Meta-Analysis. AJR Am J Roentgenol 2017;209:W374-W381. [Crossref] [PubMed]
- Parada Villavicencio C, Mc CR, Miller FH. Can diffusion-weighted magnetic resonance imaging of clear cell renal carcinoma predict low from high nuclear grade tumors. Abdom Radiol (NY) 2017;42:1241-9. [Crossref] [PubMed]
- Dai Y, Yao Q, Wu G, Wu D, Wu L, Zhu L, Xue R, Xu J. Characterization of clear cell renal cell carcinoma with diffusion kurtosis imaging: correlation between diffusion kurtosis parameters and tumor cellularity. NMR Biomed 2016;29:873-81. [Crossref] [PubMed]
- Taneja K, Arora S, Rogers CG, Gupta NS, Williamson SR. Pathological staging of renal cell carcinoma: a review of 300 consecutive cases with emphasis on retrograde venous invasion. Histopathology 2018;73:681-91. [Crossref] [PubMed]
- Veraart J, Sijbers J, Sunaert S, Leemans A, Jeurissen B. Weighted linear least squares estimation of diffusion MRI parameters: strengths, limitations, and pitfalls. Neuroimage 2013;81:335-46. [Crossref] [PubMed]

