

Fully automated segmentation of wrist bones on T2-weighted fat-suppressed MR images in early rheumatoid arthritis
Introduction
The wrist is one of the most commonly affected joints in rheumatoid arthritis (RA) and is usually involved at an early stage of the disease. Early rheumatoid arthritis (ERA) is defined as RA with symptom duration of less than 24 months. MRI of the wrist is now commonly used to evaluate the degree of inflammation in patients with ERA (1-3). Determining the level of inflammatory change present has implications for (I) determining treatment need, (II) monitoring treatment response, and (III) predicting disease outcome.
There are two components to wrist inflammation in RA patients. The first is soft tissue inflammation, namely synovitis (inflammation of the joint synovium), and tenosynovitis (inflammation of the tendon sheath synovium) (2). The second is bony inflammation with osteitis, manifest on MR imaging as bone marrow oedema (BME) (2). Osteitis is a precursor of bone erosion (4).
Currently, the Rheumatoid Arthritis MRI score (RAMRIS) (5,6) system is routinely used to semi-quantitatively quantify inflammation on MRI in RA patients, with the severity of synovitis/tenosynovitis and osteitis being graded visually (7-9). RAMRIS can be applied to both the wrist and metacarpophalangeal joints though incorporating the metacarpophalangeal joints does not strengthen association with patient-related outcomes compared with studying the wrist alone (10). The time taken to perform RAMRIS and its semi-quantitative nature limits uptake into routine clinical practice (10). A fully automated quantitative system would be preferable. One important step in an automated process is accurate segmentation of the wrist bones.
Previous work on MRI wrist bone segmentation involved either (I) atlas- (7,11,12) or (II) seed-based (13-15) algorithms applied to T1-weighted spin echo sequences. Little work has been done on segmenting wrist bones directly from T2-weighted fat-suppressed images, which are the preferred images to depict BME (16). Convolution neural network (CNN) has been used to good effect for medical image segmentation and may be applicable to wrist bone segmentation. To test this possibility, a robust CNN, known as the U-net, designed for medical image segmentation (17), was implemented and tested. Our preliminary findings indicated that U-net yielded an unsatisfactory result for coronal T2W fat-suppressed images with the network consistently trapped in local minima that returned poor labels. The main factor that led to this unsatisfactory result was the conflict between unwanted tendons and wanted wrist bones, both of which appeared as elongated objects of low signal intensity with weak discriminatory contrast on coronal T2-weighted fat-suppressed images.
Although the inability of a trained and converged CNN to handle specific features is usually the result of either inadequate network depth, biased training samples or undesirable initial parameters, this can be mitigated by state-of-the-art hardware, more data, and/or, pertinent strategies that exploit uncommon characteristic features. In this study, we classified and separated images with the candidate features into individual groups, which were trained independently with the same model to yield multiple model parameter sets, allowing performance comparable to a deeper network to be achieved without additional resources. To do this, we proposed a novel strategy of coupling the image classification network Inception V3 (18) and the image segmentation network U-net to, first, classify the wrist region into groups of contiguous 2D images possessing different features and, second, to segment these images into different groups using multiple independently trained U-nets for wrist bone segmentation.
Methods
Data acquisition
MRI data from a cross-sectional prospective study of treatment naïve ERA patients recruited between October 2012 to January 2016 was utilized. The study protocol was approved by the local Ethics Committee with signed informed consent being obtained from each patient. All 51 patients (mean age: 53±12 years) fulfilled the 2010 American College of Rheumatology (ACR)/European League Against Rheumatism classification (EULAR) criteria for RA (19) with symptom-duration of less than 24 months at the time of recruitment.
MRI of the most symptomatic wrist was performed in all patients. Wrists were scanned in the prone position on a 3.0T system (Achieva TX, Philips Healthcare, Best) with a dedicated wrist coil to optimize signal reception. T2-weighted fat-suppressed coronal images were chosen for segmentation as each bone margin is clearly seen on coronal images and BME is only clearly seen on this sequence (6). The sequence used has a TE, TR, flip angle and field-of-view (FOV) of 70 ms, 3,121 ms, 90° and 80 mm × 80 mm respectively. Each coronal image had a 448×448 reconstruction matrix yielding a uniform pixel size of 0.178 mm × 0.178 mm with 1.65 mm inter-slice spacing.
Manual segmentation was undertaken by tracing the margin of each carpal bone on continuous images using the software ITK-SNAP, an open source medical image segmentation tool (20). The distal portion of the radius and ulna, as well as the proximal portions of the five metacarpal bones were also segmented.
Image classification
In early testing, we found U-net unhelpful for bone segmentation on coronal T2-weighted fat-suppressed images due to a conflict between unwanted hypointense tendons and wanted wrist bones, which are anatomically quite closely apposed. To overcome this issue, we first systematically classified MR images and trained multiple U-nets for wrist bone segmentation. The T2-weighted fat-suppressed coronal images in the training dataset were first classified into three groups as follows:
- Type A: superficial images;
- Type B: images with tendons;
- Type C: other images.
Type A is defined as images reconstructed at superficial locations that do not include any bony structures. Type B refers to images that include both tendons and bone areas, both of which are represented as hypointense objects on T2W fat-suppressed images. Any other images were classified as type C, which contained mainly bone areas and no tendons. The rationale behind this classification was to separate the source of conflicting features, which originates from the co-existence of elongated soft tissue and bony structures. A typical example of the classification is shown in Figure 1.

To illustrate this, DICE evolution during training of networks under identical conditions for 50 epochs with and without classification is shown (Figure 2). An epoch refers to a single training cycle in which the complete training dataset is passed once through the neural network. DICE provides an objective reference to the networks’ performance. Training with classification achieved overall better results than training without classification. The curves also support our impression that the major factor limiting in U-net’s performance was the coexistence of tendons and elongated bony structures, present in type B images.

Classification was done automatically by training and utilizing the Inception V3 network (18). The Inception network is a well-established image classification network that was originally adopted for classifying images of nature, but soon became used to classify medical images for detection and diagnosis (21-23). The high-level feature classification capability of the trained network is comparable to human classification under controlled conditions (24). In our case, we utilized the network to classify images into types A–C.
Segmentation
U-net was employed for segmentation with a minor modification to the original U-net design being made to best suit this particular application. Batch norm kernels were added as the first layer and at the beginning of each downward transition convolutional layer of U-net. The extra batch norm layers helped avoid vanishing or exploding gradients in the training process (25). Upwards transition merging was replaced by a plain bilinear interpolation instead of a concatenation.
Type B and type C classified images were fed separately into two individually trained U-nets and the results reconstructed to give pixel-wise structural-likelihood which was used for bone segmentation.
Bone segmentation results from network output then underwent post-processing: two binary image filters, namely a hole-filling filter and a median-edge-smoothing filter, were applied sequentially to each of the slices in the network output. We used a constant radius of 3×3×1 px3 for the median-edge-smoothing filter. Connected components with a volume <15 mm3 were considered as noise and removed (Figure 3).

Testing and training
The image dataset from 51 patients was randomly divided into testing and training subgroups comprising 11 and 40 patients respectively, yielding a total of 222 and 818 coronal slices respectively. Each wrist MR examination was graded by RAMRIS based on the degree of synovitis/tenosynovitis, bone erosion and BME. The mean RAMRIS scores of the two groups were similar at 14.3±15.3 and 16.2±13.2 (P=0.677). Each coronal image was first assigned with a unique image number and then manually classified into type A, B or C to serve as the classification ground-truth. Image type data was provided with a unique image ID that was referenced to reconstruct the segmented images back into a volume.
Training
The networks were implemented and trained with the PyTorch API (26) on a machine with an NVIDIA TITAN Xp graphic processing unit (GPU). For both networks, we optimized the parameters by using stochastic gradient descent (SGD) to minimize the negative-log-likelihood loss L which was defined as:
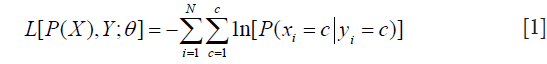
where P(X) is the network output, xi, yi are the i-th component of predicted label X and ground-truth Y, C is the number of classes, N is the total number of components in X or Y, each element of P(X) is a length C vector 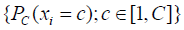 which stored the probabilities predicted by the model with parameters while each component of Y should only contain one truth value. The networks were iterated until convergences were observed. The learning rates rk and momentum mk were decayed before the (k+1)-th epoch by following the equation:
We ran the network for a large number of epochs to ensure convergence. Some key training parameters were tabulated in Table 1.

Full table
Performance evaluation
The classification accuracies were evaluated by simple accuracy. A confusion matrix was plotted from the test result. Columns represent the predicted values by the network and rows the truth values.
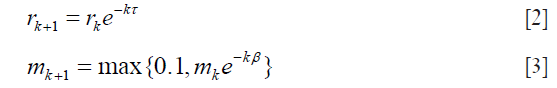
For the segmentation, fitness was evaluated by DICE (27) and Jaccard similarity coefficient (JAC) (9), which are defined as follows for binary labels:
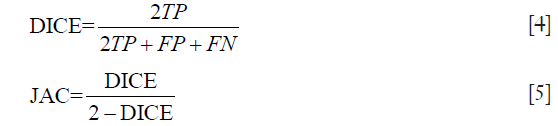
The error was evaluated with global consistency error (GCE) (28) and the distance of volume between output and ground-truth evaluated by volumetric distance (VD) (29) normalized to the range 0–1. Definitions are listed as follow:
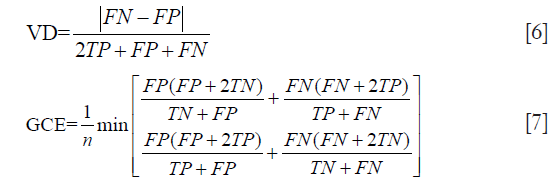
for the upper equations, TP, FP, TN and FN represent true-positive, false-positive, true-negative and false-negative statistics respectively, and n is the number of voxels.
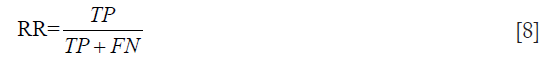
We also compared our results with recent work that involves atlas-based segmentation against coronal T1-weight fat-saturated images (11). The recall rate (RR), also known as the percentage match or positive predictive value, was defined according to (11):
To provide quantitative references for segmentation performance from both technical and clinical perspectives, the results are evaluated by-image and by-case respectively. This is because our technique processes data image-by-image independent of inter-image information while clinical relevance relates to the complete wrist volume.
Results
A total of 222 test images were classified. Accuracy was 82.0%, with 6 (2.7%) of the 222 images misclassified as type A. The confusion matrix listing the hit/miss frequency is shown in Table 2.

Full table
Trained models were used to process the testing data. Similarity and distance metrics were evaluated image by image for different severity of BME and RAMRIS. A single U-net was also trained with identical parameters and tested on non-classified data to show improvements after employing the classification. In the image by image comparison, images with either empty predicted label or empty ground truth were excluded as comparison metrics are not well defined in these cases (Table 2). Exclusion was not necessary for case-by case comparison as none of the involved label images were empty. Results are shown in Tables 3-5.

Full table

Full table

Full table
All statistical analyses were performed using SPSS (30). ANOVA and least significant distance were used to evaluate the mean difference and performance comparisons by-image while Mann-Whitney test was used for comparisons by-case.
Coupling U-net with classification achieved 0.86 DICE coefficient compared with 0.81 DICE without classification for by-image comparison and 0.89 DICE coefficient compared with 0.87 DICE without classification for by-case comparison (Table 3). The smaller difference in the by-case comparisons was mainly due to the inclusion of empty images. Type B images of patients with severe ERA (RAMRIS score ≥30, or BME score ≥15) most strongly influenced segmentation accuracy (Tables 4,5).
Graphical results showed that the algorithm delivered good accuracy for T2-fat-suppressed segmentation with oedematous tissues (Figure 4). This can be seen visually in Figure 5, where meshes were rendered on a single testing case. The calculated Hausdorff distance, which provides a measure of mesh differences (31) between the predicted and manually drawn label, was small (Figure 5).


Recently, a feasibility study addressing fully automated evaluation of BME was conducted, using an atlas-based method to segment carpals from T1-weighted fat-saturated images (11). The reported RR was 0.58–0.82 for different carpal bones. In that study, although the predicted label mostly lies within the manually labelled region, it tends to miss out a relatively high portion of the carpal volume. In comparison, our method achieved a mean RR of 0.88±0.02 based on segmentation direct from T2W fat-saturated images.
Discussion
We have proposed a multi-step and automated CNN-based process to segment wrist bones from T2W fat-saturated images of ERA patients. Regarding the classification step, although the accuracy of Inception V3 was good, the overall accuracy of classification was not as high as expected. Misclassification into type A occurred at a rate of 2.7%, strongly affecting segmentation accuracy as these type A slices were not processed for segmentation. This inaccuracy is also likely resulted from network overfitting as the Inception network demonstrated a 99.9% accuracy during training. An increased in sample size will help to reduce this inaccuracy.
The algorithm was made more robust by verifying if type A image positions were within type B and C images. Falsely classifying type A images into type B and C images only occurs in about 4% cases.
For segmentation, there was a consistent underestimation of wrist bone volume by U-net (Figure 4). The wrist bone labels are slightly smaller than the ground truth in most cases. This is not a significant limiting factor as underestimation of the wrist bone margin is preferred over overestimation since the latter will lead to the inclusion of inflammatory soft tissue surrounding the bone which will affect BME quantification. The average volumetric distance is small at only 2% when compared by-case. Global consistency error values also indicate the algorithm is reasonably consistent with margins drawn manually by a trained expert.
This study has some limitations. First, the segmentation labels do not differentiate between carpal bones. Quantification of BME considers the volume of oedematous tissue relative to the whole label rather than on a bone-by-bone basis. Multi-label segmentation by out-of-the-box U-net was tested without success. This limitation is to be anticipated because 2D features between different carpals are similar, and U-net is weak in defining positional information. We have not tested our data on 3D segmentation networks and thus, cannot make any inferences as to whether 3D segmentation is superior to 2D segmentation by U-net. Nevertheless, we do expect that additional post-processing, such as connected component analysis or surface point cloud k-mean clustering, may be helpful in further refining the U-net segmented binary label into different wrist bones.
Second, the study focused on the wrist bones rather than the metacarpal joints. Focusing on the wrist allows higher resolution data acquisition. Also incorporating the metacarpophalangeal joints does not seem to strengthen association with patient-related outcomes compared with studying the wrist alone (10). We anticipate that the technique could be easily extended to larger field-of view images as the anatomy of the metacarpals and phalanges is not as complex as the carpus.
In conclusion, a novel strategy of coupling Inception V3 image classification network with segmentation network U-net to achieve segmentation of the wrist bones in ERA patients from T2W fat-saturated images was presented. The proposed method is comparable to existing atlas-based methods that utilize T1W sequences. We also showed that adding a classification step can improve training stability, lessen difficulty and improve the performance of wrist bone segmentation by CNN.
Acknowledgements
None.
Footnote
Conflicts of Interest: The authors have no conflicts of interest to declare.
Ethical Statement: The study protocol was approved by the local Ethics Committee with signed informed consent being obtained from each patient.
References
- Haavardsholm EA, Bøyesen P, Østergaard M, Schildvold A, Kvien TK. Magnetic resonance imaging findings in 84 patients with early rheumatoid arthritis: Bone marrow oedema predicts erosive progression. Ann Rheum Dis 2008;67:794-800. [Crossref] [PubMed]
- Østergaard M, McQueen F, Wiell C, Bird P, Bøyesen P, Ejbjerg B, Peterfy C, Gandjbakhch F, Duer-Jensen A, Coates L, Haavardsholm EA, Hermann KGA, Lassere M, O’Connor P, Emery P, Genant H, Conaghan PG. The OMERACT Psoriatic Arthritis Magnetic Resonance Imaging Scoring System (PsAMRIS): Definitions of key pathologies, suggested MRI sequences, and preliminary scoring system for PsA hands. J Rheumatol 2009;36:1816-24. [Crossref] [PubMed]
- Tam LS, Griffith JF, Yu AB, Li TK, Li EK. Rapid improvement in rheumatoid arthritis patients on combination of methotrexate and infliximab: Clinical and magnetic resonance imaging evaluation. Clin Rheumatol 2007;26:941-6. [Crossref] [PubMed]
- McQueen FM, Stewart N, Crabbe J, Robinson E, Yeoman S, Tan PL, McLean L. Magnetic resonance imaging of the wrist in early rheumatoid arthritis reveals a high prevalence of erosions at four months after symptom onset. Ann Rheum Dis 1998;57:350-6. [Crossref] [PubMed]
- Østergaard M, Peterfy C, Conaghan P, McQueen F, Bird P, Ejbjerg B, Shnier R, O’Connor P, Klarlund M, Emery P, Genant H, Lassere M, Edmonds J. OMERACT rheumatoid arthritis magnetic resonance imaging studies. Core set of MRI acquisitions, joint pathology definitions, and the OMERACT RA-MRI scoring system. J Rheumatol 2003;30:1385-6. [PubMed]
- Østergaard M, Peterfy CG, Bird P, Gandjbakhch F, Glinatsi D, Eshed I, Haavardsholm EA, Lillegraven S, Bøyesen P, Ejbjerg B, Foltz V, Emery P, Genant HK, Conaghan PG. The OMERACT rheumatoid arthritis magnetic resonance imaging (MRI) scoring system: Updated recommendations by the OMERACT MRI in arthritis working group. J Rheumatol 2017;44:1706-12. [Crossref] [PubMed]
- Alphonse E, Roex H. Early Detection of Rheumatoid Arthritis using extremity MRI: Quantification of Bone Marrow Edema in the Carpal bones. Available online: http://resolver.tudelft.nl/uuid:7145d7a6-25bb-42a4-ba48-240d70a68792
- Chand AS, McHaffie A, Clarke AW, Reeves Q, Tan YM, Dalbeth N, Williams M, McQueen F. Quantifying synovitis in rheumatoid arthritis using computer-assisted manual segmentation with 3 tesla MRI scanning. J Magn Reson Imaging 2011;33:1106-13. [Crossref] [PubMed]
- Crum WR, Camara O, Hill DLG. Generalized overlap measures for evaluation and validation in medical image analysis. IEEE Trans Med Imaging 2006;25:1451-61. [Crossref] [PubMed]
- Glinatsi D, Baker JF, Hetland ML, Hørslev-Petersen K, Ejbjerg BJ, Stengaard-Pedersen K, Junker P, Ellingsen T, Lindegaard HM, Hansen I, Lottenburger T, Møller JM, Ørnbjerg L, Vestergaard A, Jurik AG, Thomsen HS, Torfing T, Møller-Bisgaard S, Axelsen MB, Østergaard M. Magnetic resonance imaging assessed inflammation in the wrist is associated with patient-reported physical impairment, global assessment of disease activity and pain in early rheumatoid arthritis: longitudinal results from two randomised controlled trials. Ann Rheum Dis 2017;76:1707-15. [Crossref] [PubMed]
- Aizenberg E, Roex EAH, Nieuwenhuis WP, Mangnus L, van der Helm-van Mil AHM, Reijnierse M, Bloem JL, Lelieveldt BPF, Stoel BC. Automatic quantification of bone marrow edema on MRI of the wrist in patients with early arthritis: A feasibility study. Magn Reson Med 2018;79:1127-34. [Crossref] [PubMed]
- Gemme L, Nardotto S, Dellepiane SG. Automatic MPST-cut for segmentation of carpal bones from MR volumes. Comput Biol Med 2017;87:335-46. [Crossref] [PubMed]
- Conte D, Foggia P, Tufano F, Vento M. An Enhanced Level Set Algorithm for Wrist Bone Segmentation. Image Segmentation, Image Segmentation, Pei-Gee Ho, IntechOpen. (April 19th 2011). Available online: https://www.intechopen.com/books/image-segmentation/an-enhanced-level-set-algorithm-for-wrist-bone-segmentation
- Włodarczyk J, Czaplicka K, Tabor Z, Wojciechowski W, Urbanik A. Segmentation of bones in magnetic resonance images of the wrist. Int J Comput Assist Radiol Surg 2015;10:419-31. [Crossref] [PubMed]
- Włodarczyk J, Wojciechowski W, Czaplicka K, Urbanik A, Tabor Z. Fast automated segmentation of wrist bones in magnetic resonance images. Comput Biol Med 2015;65:44-53. [Crossref] [PubMed]
- Manara M, Varenna M. A clinical overview of bone marrow edema. Reumatismo 2014;66:184. [Crossref] [PubMed]
- Ronneberger O, Fischer P, Brox T. U-Net: Convolutional networks for biomedical image segmentation. In: Navab N, Hornegger J, Wells W, Frangi A. editors. Medical Image Computing and Computer-Assisted Intervention – MICCAI 2015. Cham: Springer, 2015.
- Szegedy C, Vanhoucke V, Ioffe S, Shlens J, Wojna Z. Rethinking the Inception Architecture for Computer Vision. In: The IEEE Conference on Computer Vision and Pattern Recognition (CVPR), 2016:2818-26.
- Aletaha D, Neogi T, Silman AJ, Funovits J, Felson DT, Bingham CO, Birnbaum NS, Burmester GR, Bykerk VP, Cohen MD, Combe B, Costenbader KH, Dougados M, Emery P, Ferraccioli G, Hazes JMW, Hobbs K, Huizinga TWJ, Kavanaugh A, Kay J, Kvien TK, Laing T, Mease P, Ménard HA, Moreland LW, Naden RL, Pincus T, Smolen JS, Stanislawska-Biernat E, Symmons D, Tak PP, Upchurch KS, Vencovský J, Wolfe F, Hawker G. 2010 Rheumatoid arthritis classification criteria: An American College of Rheumatology/European League Against Rheumatism collaborative initiative. Arthritis Rheum 2010;62:2569-81. [Crossref] [PubMed]
- Yushkevich PA, Piven J, Hazlett C, Smith G, Ho S, Gee JC, Gerig G. User-guided 3D active contour segmentation of anatomical structures: Significantly improved efficiency and reliability. Neuroimage 2006;31:1116-28. [Crossref] [PubMed]
- Chang J, Yu J, Han T, Chang HJ, Park E. A method for classifying medical images using transfer learning: a pilot study on histopathology of breast cancer. In: 2017 IEEE 19th International Conference on e-Health Networking, Applications and Services (Healthcom). Piscataway, NJ: IEEE; 2017:1-4.
- Midya A, Chakraborty J, Pak LM, Zheng J, Jarnagin WR, Do RKG, Simpson AL. Deep convolutional neural network for the classification of hepatocellular carcinoma and intrahepatic cholangiocarcinoma. Proc. SPIE 10575, Medical Imaging 2018: Computer-Aided Diagnosis, 1057528 (27 February 2018). Available online: https://doi.org/ [Crossref]
- Torres Figueroa F, Salinas Miranda E, Bravo Sarmiento MA, Triana G, Arbeláez Escalante PA. Bone age detection via carpogram analysis using convolutional neural networks. 13th Int Conf Med Inf Process Anal 2017;1057217:45.
- Tschandl P, Kittler H, Argenziano G. A pretrained neural network shows similar diagnostic accuracy to medical students in categorizing dermatoscopic images after comparable training conditions. Br J Dermatol 2017;177:867-9. [Crossref] [PubMed]
- Ioffe S, Szegedy C. Batch Normalization: Accelerating Deep Network Training by Reducing Internal Covariate Shift. Available online: http://proceedings.mlr.press/v37/ioffe15.pdf
- Paszke A, Chanan G, Lin Z, Gross S, Yang E, Antiga L, Devito Z. Automatic differentiation in PyTorch. In: The NIPS workshop on the future of gradient-based machine learning software & techniques, 2017.
- Dice LR. Measures of the Amount of Ecologic Association Between Species. Ecology 1945;26:297-302. [Crossref]
- Martin D, Fowlkes C, Tal D, Malik J. A database of human segmented natural images and its application to\nevaluating segmentation algorithms and measuring ecological statistics. Proc Eighth IEEE Int Conf Comput Vision ICCV 2001;2:416-23.
- Taha AA, Hanbury A. Metrics for evaluating 3D medical image segmentation: Analysis, selection, and tool. BMC Med Imaging 2015;15:29. [Crossref] [PubMed]
- IBM SPSS Inc. SPSS Statistics for Windows. IBM Corp Released 2012 2012;Version 20:1-8.
- Aspert N, Santa-cruz D, Ebrahimi T. MESH: measuring errors between surfaces using the Hausdorff distance. In: IEEE International Conference on Multimedia and Expo. Lausanne, Switzerland: IEEE, 2002:705-8.

