

Personalized administration of contrast medium with high delivery rate in low tube voltage coronary computed tomography angiography
Introduction
The application of lower tube voltage (i.e., 100 kVp) protocol in coronary computed tomography angiography (CCTA) has been increasing over the past decade (1,2). It is mainly due to the benefit of radiation dose and total iodine dose (TID) reductions at lower tube voltage compared to the standard 120 kVp. Known as the “double low dose strategy”, it ensures safety as there will be less radiation exposure, in addition to reducing the risk of nephrotoxicity caused by the contrast medium (3,4).
When a lower tube voltage is applied, the mean photon energy (approximately half of the peak tube voltage) of the CCTA X-ray beam is reduced until it becomes close to the K-edge of iodine (33.2 keV). Photons with lower energies are more likely to be absorbed because of the K-edge of iodine, resulting in an increase of photoelectric effects. As the CT number of iodine is higher, a good vessel contrast enhancement (VCE) can be achieved while administering a lower TID to patients undergoing CCTA with low tube voltage protocol (5).
Initially, many studies have attempted to reduce TID by adjusting the contrast concentration or volume, and they mostly use a low iodine delivery rate (IDR) which was between 1.08 and 1.70 gI·s–1 (6-12). IDR represents the rate at which iodine is delivered into the arterial system and is the main determinant of VCE in CCTA. At a given administered TID, the higher the iodine concentration and the injection rate, the greater the IDR and the VCE (13,14). Thus, a high delivery rate becomes an important factor when using low TID to optimize contrast medium administration (14-16).
Although IDR of 1.5 to 2.0 gI·s–1 is usually recommended in CCTA (13,17,18), higher rate of more than 2.0 gI·s–1 has been proven to be feasible in clinical practice (13,17-22). A personalized contrast volume calculation algorithm incorporating high IDR may accurately reduce TID and produce optimal VCE in low tube voltage CCTA. To the best of our knowledge, no study has assessed the potential of using a “double low dose strategy” with a high IDR of more than 2.0 gI·s–1 in terms of TID reduction, image quality and radiation exposure.
This study has two purposes: (I) development of a personalized contrast volume calculation algorithm using a high delivery rate and, (II) compare the developed algorithm in low tube voltage CCTA with the standard protocol ECG-gated CCTA scans in terms of reductions in iodine and radiation doses and assessment of image quality.
Methods
Patient and data sources
Data from 141 patients who underwent CCTA at the University of Malaya Medical Centre between January 2014 and December 2016 were retrieved to develop the personalized contrast volume calculation algorithm (thereafter referred to as “Group 1”). Subsequently, 45 patients with body mass index (BMI) of ≤30 kg·m–2 who were scheduled to undergo CCTA at the same hospital from January 2017 to October 2017 were prospectively enrolled for validation of the algorithm (thereafter referred to as “Group 2”). This validation study was approved by the Medical Ethics Committee of the University of Malaya Medical Centre (Protocol No. 989.35) and informed consent was obtained from these patients. Lastly, another 45 patients with similar BMI to Group 2 subjects (thereafter known as “Reference Group”) were chosen from Group 1 to compare their TID, image quality and radiation dose. Figure 1 shows the assignment of subjects in the prospective and retrospective parts of this study.

All patients were referred for CCTA due to suspected coronary artery disease. Oral Lorazepam (1 mg, Lorans 1, Medochemie Ltd, Cyprus) was selectively given to patients with anxiety and for patients with systolic blood pressure of more than 90 mmHg, beta blocker, Metoprolol Tartrate (100–150 mg, Betaloc, AstraZeneca Pty Ltd., Australia) was given 60 minutes before the scanning to achieve a low and regular heart rate (less than 65 bpm). For asthmatic patients, an oral dose of Verapamil Hydrochloride (80–120 mg, Akilen 40, Medochemie Ltd., Malta) was given as an alternative to Metoprolol Tartrate. An 18 G intravenous cannula was inserted at the median cubital vein for contrast medium administration. Sublingual nitroglycerin (0.5 mg, Myonit Insta, Troikaa Pharmaceuticals Ltd., India) was given, 5 minutes before data acquisition, to dilate the coronary arteries. Patient characteristics, such as sex, age, body weight and heart rate, were recorded.
CCTA image acquisition
Calcium score (non-contrast CT) was performed with sequential scans and the following scanning parameters: slice acquisition, 6×3.0 mm; tube potential, 120 kVp; reference mAs, 74 mAs; reconstructed slice thickness 3.0 mm.
All CCTA scans were performed with retrospectively ECG-gated protocol, using a 2×32 detector row dual-source CT scanner (Siemens Somatom Definition DS, Siemens Healthcare, Erlangen, Germany). A tube potential of 120 kVp and reference tube current-time product of 320 mAs were used for Group 1 and the Reference Group, whereas it was 100 kVp and 370 mAs for Group 2. Other scanning parameters were as follows: slice acquisition at 2×32×0.6 mm (19.2 mm z-axis coverage); full tube current for 20% to 75% of R-R interval; rotation time of 330 ms; temporal resolution at approximately 82.5 ms; and, reconstructed slice thickness of 0.6 mm. The scan length was set from the carina of trachea to the apex of the heart.
Contrast medium injection protocol
The contrast medium (Ultravist 370, Bayer HealthCare Pharmaceuticals, Berlin, Germany) was injected into the median cubital vein using a CT injection system (Medrad Stellant CT, Bayer HealthCare Pharmaceuticals, Berlin, Germany). An injection rate of 6 mL·s–1 was used to achieve high IDR of 2.22 gI·s–1 for both test bolus and full bolus during the CCTA scan. A triphasic protocol recommended by the Society of Cardiovascular Computed Tomography (SCCT) was applied in the full bolus—an initial undiluted contrast bolus (first bolus), followed by a 20:80 mixture of contrast medium (10 mL) and saline (40 mL) before being completed with a 50 mL saline flush (23).
For Group 1 and the Reference Group, the contrast volume of the first bolus (50, 55 or 60 mL) was adjusted to a product of the estimated scan time and injection rate (thereafter referred to as “routine contrast protocol”). In this group, 75 patients (53.2%) received 60 mL, 24 patients (17.0%) received 50 mL and 42 patients (29.8%) received 55 mL of the first bolus. For Group 2, the contrast volume of the first bolus was calculated using the developed algorithm.
Development of personalized contrast volume calculation algorithm
The algorithm development consisted of three steps: establishing the relationship between VCE and contrast volume; establishing the relationship between VCE, patient characteristics and test bolus parameters; and, developing a 100-to-120 kVp contrast enhancement conversion factor (Ec). Details are summarized in Figure 2.

The VCE of scan images was calculated as the mean CT attenuation value (measured in HU). Using the RadiAnt DICOM Viewer software (Medixant, Poznan, Poland), a circular region of interest (ROI) was placed in the left main (LM) coronary artery and proximal right coronary artery (RCA). All ROIs were made as large as possible according to vessel size, but vessel walls, calcifications or metallic components were avoided to prevent partial volume effects.
Data from Group 1 was used to establish the relationship between VCE and contrast volume. Four contrast volumes were included, namely 0, 50, 55 and 60 mL. The VCE corresponding to 0 mL of contrast volume was measured in calcium score images, acquired prior to CCTA scan in every patient.
In establishing the relationship between VCE, patient characteristics and test bolus parameters, data from 75 patients that received 60 mL of the first bolus in Group 1 were used (thereafter referred as “Group 1a”). Mean VCE was compared with age, sex, body surface area (BSA), heart rate, and PCE and time-to-peak (TTP) of the test bolus. The BSA was calculated from body weight, based on the equation derived by Livingston & Lee (24) in Eq. [1].

Finally, a phantom study was conducted to construct the iodine attenuation curves for 100 and 120 kVp (Appendix I). The relative difference in the contrast enhancement between the two different tube voltages was used to develop the Ec.
Prospective clinical validation
The developed algorithm was applied to Group 2 with a targeted VCE of 350 HU. The mean CT attenuation value was measured in the LM and proximal RCA arteries using the acquired axial images (thereafter referred to as “measured VCE”).
The assessment of quantitative and qualitative image quality and radiation dose was performed in Group 2 and the Reference Group. The quantitative image analysis, including image noise, signal-to-noise ratio (SNR), contrast-to-noise ratio (CNR), and figure of merit (FOM) was performed on the axial images of both groups.
A circular ROI was placed in the ascending aorta (AA), RCA, LM, left anterior descending (LAD) and left circumflex (LCx) arteries. For measurements in AA, three ROIs were placed in the AA at the level of LM ostium and one slice above and below this level. For RCA, LM and LAD, three ROIs were placed at the proximal, middle and distal segments of the arteries. For LCx, only two ROIs were placed at the proximal and distal segments of the artery.
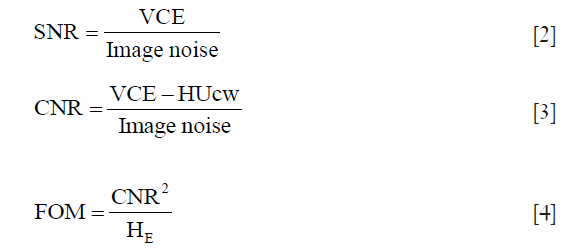
VCE was defined as the mean CT attenuation value (measured in HU) in each artery. The image noise was defined as the mean standard deviation of CT attenuation value for the ROIs placed in the AA. The SNR was calculated by dividing the VCE by the mean image noise measured in AA {Eq. [2]}. The CNR was calculated by subtracting the mean CT attenuation value (HU) measured in the chest wall muscle (HUcw) from the VCE, and dividing this difference by the mean image noise measured in AA {Eq. [3]}.
FOM was defined as the ratio of CNR squared to effective dose (HE) {Eq. [4]}. FOM reflects the relationship between image contrast, noise, and amount of radiation exposure.
Qualitative image analysis was performed by two cardiovascular radiologists (Raja Aman RR and Mohamed Sani F, each with more than 10 years of experience in cardiac CT image reporting) using a post-processing and evaluation software (Centricity RIS-i Version 5, GE Healthcare, Chicago, USA). Using axial, multiplanar reformation (MPR) and thin-slab maximum intensity projection (MIP) images, the images were interpreted individually and in a random order. The evaluators were allowed to freely adjust the window settings. The VCE in the major coronary arteries (RCA, LM, LAD and LCx) were graded using a 5-point scale as follows: 1= poor opacification, insufficient for diagnosis; 2= suboptimal opacification, low diagnostic confidence; 3= acceptable opacification, sufficient for diagnosis; 4= good opacification of proximal and distal segments; and 5= excellent opacification of proximal and distal segments (Figure 3).

For radiation dose assessment, the HE of each CCTA scan was estimated by multiplying the air-kerma length product (PKL) to a PKL-to-HE conversion factor (EKL) (25,26). The EKL for chest, 0.014 mSv·mGy–1·cm–1 as recommended by the European Commission (EC) and Public Health England (PHE) (formerly NRPB) was used in this study (27,28).
Statistical analysis
Data analyses were performed using a statistical software (IBM SPSS Version 23, IBM Corporation, Armonk, USA). The Mann-Whitney U Test was used to compare patient characteristics (age, body weight, BMI, BSA, heart rate, PCE and TTP at test bolus, and measured VCE) between Group 2 and the Reference Group. Linear regression was used to determine the correlation between VCE and contrast volume, as well as contrast enhancement and iodine concentration during construction of the iodine attenuation curve. Multiple linear regression was used to correlate VCE with patient characteristics and test bolus parameters. Finally, the TID, quantitative and qualitative image quality scores, radiation dose of Group 2 were compared with the Reference Group using the Mann-Whitney U Test. For qualitative image quality analysis, the Wilcoxon Signed-Rank Test was used to assess interobserver variabilities in VCE scoring between the two groups. A P value less than 0.05 was considered statistically significant.
Results
Patient characteristics, test bolus and scanning parameters for Groups 1a, 2 and the Reference Group are shown in Table 1. The PCE at test bolus was the only significantly different parameter (P=0.017).

Full table
Development of personalized contrast volume calculation algorithm
The mean VCE for contrast volumes of 0, 50, 55 and 60 mL were 58.5, 450.1, 471.4 and 494.4 HU, respectively, as derived from Figure 4. These four points showed a linear correlation (r=0.97, P<0.05). The relationship between VCE, patient characteristics and test bolus parameters are shown in Tables 2,3. In Table 2, BSA showed the strongest inverse correlation with VCE (r=−0.61, P<0.05), whereas, age (r=0.52, P<0.05) and PCE at test bolus (r=0.60, P<0.05) showed significant positive correlation.


Full table

Full table
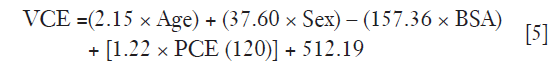
Multiple linear regression analysis in Table 3 found that the strongest predictor for VCE is BSA (correlation coefficient −157.36, P<0.05), followed by sex (correlation coefficient 37.60, P<0.05), age (correlation coefficient 2.15, P<0.05) and PCE at test bolus (correlation coefficient 1.22, P<0.05). A linear relationship between iodine concentration and contrast enhancement was observed for 100 and 120 kVp (Figure 5). The contrast enhancement at 100 kVp was higher by 19.6% compared to 120 kVp. The calculated Ec was (29.089/35.862)=0.81.

In multiple linear regression analysis, the relationship between patient characteristics and test bolus parameters with VCE could be described in Eq. [5]. Under sex parameter, male patients were labelled as “0” while females were labelled as “1”.
As PCE(120) in Eq. [5] was meant for a 120 kVp tube voltage, it was necessary to convert the PCE at 100 kVp [PCE(100)] by multiplying its value with the calculated Ec derived from the iodine attenuation curve as shown in Eq. [6].

The correlation between VCE and contrast volume is positively linear as described in Eq. [7],

where m is the constant and VCE0 is the Y-intercept when contrast medium has not been administered.
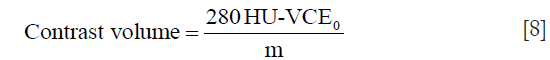
The VCE in Eq. [7] was estimated using patient characteristics and test bolus parameters derived from Eq. [5]. Then, m in Eq. [7] was determined by filling in the VCE0 measured from calcium scoring images, the contrast volume of 60 mL and the estimated VCE from Eq. [5]. Once m was determined, the algorithm was used to calculate the contrast volume to achieve a VCE of 350 HU at 100 kVp {Eq. [8]}. The value of 280 HU was obtained by multiplying 350 HU with the calculated Ec.
Prospective clinical validation
Table 4 shows the comparison of measured VCE, TID, radiation dose, quantitative and qualitative image analysis for Group 2 and the Reference Group. All scans for Group 2 were successfully performed with a mean measured VCE of 393.5±33.0 HU (314.5 to 444.0 HU). The measured VCE was significantly lower (P=0.0001) in Group 2 compared with the Reference Group.

Full table
When TID of Group 2 was compared with the Reference Group, which used a tube voltage of 120 kVp and the routine contrast protocol, a significant reduction (P=0.0001) was achieved. The HE was significantly lower (P=0.0001) in Group 2 compared to the Reference Group. By using the 100 kVp, the radiation dose was reduced by 38.5%.
For quantitative image analysis, comparable image noise and FOM were observed in Group 2 and the Reference Group. The SNR and CNR in Group 2 were significantly lower (P<0.05) compared to the Reference Group. Image quality was considered sufficient for diagnosis by the evaluators in all examinations in Group 2 and the Reference Group. In Group 2, the VCE was graded as acceptable to excellent (3.5 to 5.0) for LM and LCx and good to excellent (4.0 to 5.0) for RCA and LAD. In Reference group, the VCE was graded as acceptable to excellent (3.5 to 5.0) for LCx and good to excellent (4.0 to 5.0) for RCA, LM and LAD. There was no significant difference in VCE scores in the major coronary arteries between both groups. The Wilcoxon Signed Rank Test demonstrated no significant interobserver variabilities in VCE scores made by the two evaluators for both groups.
Discussion
CCTA with lower tube voltage is a widely used protocol to reduce the radiation dose. However, it also drastically increased the VCE. Although there was no consensus on the upper limit of VCE, an optimal range should be between 250 and 450 HU based on the detection of coronary stenosis, quantitative analysis of atherosclerotic plaque and diagnostic performance of CCTA (23,29-34). The developed algorithm in this study used 350 HU as a targeted VCE, which was within this optimal range, while achieving TID reduction with high IDR.
There were several advantages in using the personalized contrast volume calculation algorithm. First, it reduced the risk of nephropathy induced by the contrast medium (35). Second, it helped to keep the VCE within optimal range for quantitative analysis of coronary artery disease and plaques (34). Third, it helped to reduce the radiation exposure to the contrast-enhanced organs (36). Several studies have reported that using contrast medium during a CT examination would increase the organ dose by 17% to 74% (36-38). The increase of X-ray photon absorption in contrast-enhanced organs might lead to unnecessary biological effects (38). In an in vitro study conducted by Grudzenski et al. (39), the use of iodinated contrast medium during CT examination has been reported to cause 30% increase in DNA double-strand breaks in peripheral blood lymphocytes, compared to the unenhanced CT examination. This finding was supported by another in vivo study conducted by Wang et al. (40) which reported a 38% increase in DNA double-strand breaks in the peripheral blood lymphocytes during contrast-enhanced CT. Furthermore, the injection of iodinated contrast medium before a CT examination had been observed to cause more DNA damage (90%) compared with injection after examination (40).
In analyzing the relationship between VCE and contrast volume, although no data were available for VCE with contrast volume of between 10 and 40 mL, a linear fit was chosen to correlate the VCE at 0, 50, 55 and 60 mL. The linear relationship between VCE and contrast volume has been reported by Burbank et al. (41) by doubling the contrast volume, the peak iodine concentration in the blood and VCE are doubled.
From the multiple linear regression analysis between VCE, patient characteristics and test bolus parameters, the best predictor for VCE was BSA, which were negatively correlated with each other. A similar result was reported by Komatsu et al. (34), and the inverse relationship between BSA and VCE had also been reported (15,42,43). Using a BSA-adapted contrast medium protocol, Pazhenkottil et al. (43) had successfully reduced TID by 11% compared with the fixed-contrast medium protocol.
Two other patient characteristics, age and sex were also significant predictors. The association between VCE and age could be explained by the reduction in cardiac output among older patients, which caused a higher PCE (44-46). The inverse relationship between PCE and cardiac output (L.min-1) and cardiac index (L.min-1m-2) had been demonstrated by Sakai et al. (47). In their study, every reduction in cardiac index led to a 38% increase in PCE. There was a difference in blood volume between men and women, therefore, a slight difference in PCE and TTP could be expected in different sexes. For a given BMI, men had 5% to 10% more blood compared with women. Thus, a higher VCE would be observed in women when they were given the same TID per body weight as men (48).
The PCE at test bolus was found to be a significant predictor for VCE. Previous studies also concurred with this result (49-51). Every increment of 1.0 HU in PCE at test bolus was found to lead to an increment of 1.2 HU in the VCE of our study. This is comparable to the results by Komatsu et al. (34), who observed an increment of 1.3 HU in VCE with every increment of 1.0 HU in PCE at test bolus.
As TTP increases with the decrease in cardiac output, TTP was reported to be directly correlated with PCE in several studies (34,47). However, there was no significant relationship found between TTP at test bolus and VCE. This could be due to the less variation of cardiac output in Group 1a, that can be indicated by the narrow range of TTP at test bolus (12 to 22 s), compared to the wider range between 15 to 36 s in the other study (47). From the iodine attenuation curves, there was an increase of contrast enhancement by 19.6% at a tube voltage of 100 kVp compared with 120 kVp, and this was comparable with those observed by Higashigaito et al. (52).
When applying the personalized contrast volume calculation algorithm in the Group 2 patients, the resulting images had significantly lower VCE than the Reference Group, but the quality was still acceptable as it fell within the optimal VCE range. This study achieved a higher TID reduction of 32.1% when using the personalized contrast volume calculation algorithm compared with other studies, which reported a reduction of between 14.9% and 27.3% (6,7,10,12). Those studies also used a tube voltage of 100 kVp and tried to maintain a similar VCE value as 120 kVp, but their IDR was lower, resulting in a TID of 18.9 to 20.9 g (6,7,10,12).
Although contrast concentration had been reported as an important factor affecting PCE, a higher concentration of iodine contrast medium would not necessarily produce a better image. Mihl et al. (53) observed that IDR, and not contrast concentration, was the determinant factor in VCE. Thus, unlike the previous studies, a higher IDR of 2.22 gI·s–1 was applied in our study, which was achieved with an injection rate of 6 mL·s–1 and contrast concentration of 370 mg/mL. As PCE increases proportionally with IDR, a higher IDR results in more TID reduction (54,55).
A personalized contrast protocol based on automatic tube voltage selection was developed in a recent study conducted by Eijsvoogel et al. (19). The authors have focused on only one patient factor, which is the calculated blood volume to tailor the contrast medium administration to individual patient (19). While in our study, we have presented a personalized contrast volume calculation algorithm based on parameters which are closely associated with the patient’s cardiovascular and contrast pharmacokinetic response during CCTA scanning, including the patient’s age, sex, BSA and PCE at test bolus.
The radiation dose was lowered by 38.5% in the 100 kVp protocol. This finding was consistent with the findings from the other studies, where the HE was lowered by 30% to 53% in 100 kVp compared with 120 kVp (10,56-58).
Despite lower SNR and CNR, the images produced by combining the developed algorithm and 100 kVp protocol were rated as sufficient for diagnosis by the evaluators. As the image noise increases at lower tube voltage, a higher reference mAs (370 mAs) was used at 100 kVp and successfully produced similar image noise compared to routine protocol. The comparable FOM in Group 2 and the Reference Group indicated that the dose efficiency achieved by combining the developed algorithm and 100 kVp protocol was similar to the routine protocol.
This study had several limitations. First, it did not evaluate the diagnostic accuracy of the developed algorithm and 100 kVp protocol in the detection of coronary stenosis as not all patients had undergone invasive coronary angiography for confirmation of the stenosis. Since there would be changes in contrast protocol and tube voltage, the diagnostic accuracy might be affected. Second, the comparison of TID, image quality and radiation dose were performed on two groups of patients rather than scanning the same patients with two protocols. However, the effects of comparing different groups of patients were minimized by matching their features (such as BMI) as close as possible. We deemed it unethical to repeatedly expose a single group of patients to CT radiation by sending them for a second examination. Third, the clinical applicability of the developed algorithm using a lower tube voltage of 80 and 70 kVp could not be performed due to technical limitations of the current scanner. This could be investigated when the latest models, such as third generation dual-source CT scanners, become available.
Conclusions
The combination of developed personalized contrast volume calculation algorithm using high IDR and 100 kVp significantly reduced TID and radiation dose while maintaining optimal VCE and acceptable image quality, compared with standard 120 kVp and routine contrast protocol.
Appendix I
A phantom study was conducted to construct the iodine attenuation curves for 100 and 120 kVp. Five polyethylene vials were filled with 2 mL of iodinated contrast medium (Ultravist 370, Bayer HealthCare Pharmaceuticals, Berlin, Germany) at different concentrations: 5, 10, 15, 20 and 25 mg/mL, respectively. One control vial was filled with 2 mL of saline (Figure S1A). The vials were then placed in a plug location for heart, in a female adult anthropomorphic phantom (702-G, CIRS Inc., Norfolk, Virginia, USA) Figure S1B.

CCTA scan was performed with sequential mode for 100 and 120 kVp, using a 2×32 detector row dual-source CT scanner (Siemens Somatom Definition DS, Siemens Healthcare, Erlingen, Germany). To avoid the influence of different noise level on the contrast enhancement, 250 and 138 mAs were used for 100 and 120 kVp, respectively, to achieve the same CTDI volume (CTDIvol) of 28.0 mGy.
Images were reconstructed with a medium smooth reconstruction kernel (B26f), at slice thickness of 0.75 mm and pixel matrix of 512×512. The mean CT attenuation value (HU) for saline and each concentration of iodine was measured in axial images by placing a circular region of interest (ROI) in the control and contrast-containing vials Figure S1C and determined as contrast enhancement.
The iodine attenuation curves for both 100 and 120 kVp were constructed and relative difference in the contrast enhancement between the two different tube voltages was used to develop a 100-to-120 kVp contrast enhancement conversion factor (Ec).
Acknowledgements
Funding: This study was supported by the High Impact Research Chancellory Grant UM.C/625/1/HIR/MOHE/MED/36 from the Ministry of Education, Malaysia, and the Postgraduate Research Grant PG307-2016A from the University of Malaya, Malaysia.
Footnote
Conflicts of Interest: The authors have no conflicts of interest to declare.
Ethical Statement: This study was approved by the Medical Ethics Committee of the University of Malaya Medical Centre (Protocol No.: 989.35) and informed consent was obtained from patients involved in prospective study.
References
- Bischoff B, Hein F, Meyer T, Hadamitzky M, Martinoff S, Schömig A, Hausleiter J. Impact of a Reduced Tube Voltage on CT Angiography and Radiation Dose: Results of the PROTECTION I Study. JACC Cardiovasc Imaging 2009;2:940-6. [Crossref] [PubMed]
- Hausleiter J, Martinoff S, Hadamitzky M, Martuscelli E, Pschierer I, Feuchtner GM, Catalan-Sanz P, Czermak B, Meyer TS, Hein F, Bischoff B, Kuse M, Schomig A, Achenbach S. Image quality and radiation exposure with a low tube voltage protocol for coronary CT angiography results of the PROTECTION II Trial. JACC Cardiovasc Imaging 2010;3:1113-23. [Crossref] [PubMed]
- van Hamersvelt RW, Eijsvoogel NG, Mihl C, de Jong PA, Schilham AM, Buls N, Das M, Leiner T, Willemink MJ. Contrast agent concentration optimization in CTA using low tube voltage and dual-energy CT in multiple vendors: a phantom study. Int J Cardiovasc Imaging 2018;34:1265-75. [Crossref] [PubMed]
- Zhang W, Ba Z, Wang Z, Lv H, Zhao J, Zhang Y, Zhang F, Song L. Diagnostic performance of low-radiation-dose and low-contrast-dose (double low-dose) coronary CT angiography for coronary artery stenosis. Medicine 2018;97:e11798. [Crossref] [PubMed]
- Aschoff AJ, Catalano C, Kirchin MA. Low radiation dose in computed tomography: the role of iodine. Br J Radiol 2017;90:20170079. [Crossref] [PubMed]
- Pan YN, Li AJ, Chen XM, Wang J, Ren DW, Huang QL. Coronary Computed Tomographic Angiography at Low Concentration of Contrast Agent and Low Tube Voltage in Patients with Obesity:: A Feasibility Study. Acad Radiol 2016;23:438-45. [Crossref] [PubMed]
- Shen Y, Fan Z, Sun Z, Xu L, Li Y, Zhang N, Yan Z. High Pitch Dual-Source Whole Aorta CT Angiography in the Detection of Coronary Arteries: A Feasibility Study of Using Iodixanol 270 and 100 kVp with Iterative Reconstruction. J Med Imaging Health Inform 2015;5:117-25. [Crossref]
- Tan SK, Yeong CH, Aman RR, Ng KH, Abdul Aziz YF, Chee KH, Sun Z. Low tube voltage prospectively ECG-triggered coronary CT angiography: A systematic review of image quality and radiation dose. Br J Radiol 2018;91:20170874. [Crossref] [PubMed]
- Ylä-Herttuala S, Nikkari T, Hirvonen J, Laaksonen H, Mottonen M, Pesonen E, Raekallio J, Akerblom HK. Biochemical composition of coronary arteries in Finnish children. Arteriosclerosis 1986;6:230-6. [Crossref] [PubMed]
- Zhang C, Zhang Z, Yan Z, Xu L, Yu W, Wang R. 320-row CT coronary angiography: effect of 100-kV tube voltages on image quality, contrast volume, and radiation dose. Int J Cardiovasc Imaging 2011;27:1059-68. [Crossref] [PubMed]
- Zheng M, Liu Y, Wei M, Wu Y, Zhao H, Li J. Low concentration contrast medium for dual-source computed tomography coronary angiography by a combination of iterative reconstruction and low-tube-voltage technique: feasibility study. Eur J Radiol 2014;83:e92-9. [Crossref] [PubMed]
- Yin WH, Lu B, Gao JB, Li PL, Sun K, Wu ZF, Yang WJ, Zhang XQ, Zheng MW, McQuiston AD, Meinel FG, Schoepf UJ. Effect of reduced x-ray tube voltage, low iodine concentration contrast medium, and sinogram-affirmed iterative reconstruction on image quality and radiation dose at coronary CT angiography: results of the prospective multicenter REALISE trial. J Cardiovasc Comput Tomogr 2015;9:215-24. [Crossref] [PubMed]
- Catalano C, Anzidei M, Napoli A. Cardiovascular CT and MR imaging. From technique to clinical interpretation. Berlin, Germany: Springer, 2013.
- Faggioni L, Gabelloni M. Iodine Concentration and Optimization in Computed Tomography Angiography: Current Issues. Invest Radiol 2016;51:816-22. [Crossref] [PubMed]
- Bae KT, Seeck BA, Hildebolt CF, Tao C, Zhu F, Kanematsu M, Woodard PK. Contrast enhancement in cardiovascular MDCT: effect of body weight, height, body surface area, body mass index, and obesity. AJR Am J Roentgenol 2008;190:777-84. [Crossref] [PubMed]
- Fleischmann D. CT angiography: injection and acquisition technique. Radiol Clin North Am 2010;48:237-47. vii. [Crossref] [PubMed]
- Baert AL, Knauth M, Sartor K. Multislice CT. Berlin, Germany: Springer, 2009.
- Laghi A. MDCT Protocols. Whole Body and Emergencies. Milan, Italy: Springer-Verlag, 2012.
- Eijsvoogel NG, Hendriks BM, Willigers JL, Martens B, Carati LF, Horehledova B, Kietselaer B, Crijns H, Wildberger JE, Das M. Personalization of injection protocols to the individual patient's blood volume and automated tube voltage selection (ATVS) in coronary CTA. PLoS One 2018;13:e0203682. [Crossref] [PubMed]
- Kumamaru KK, Steigner ML, Soga S, Signorelli J, Bedayat A, Adams K, Mitsouras D, Rybicki FJ. Coronary enhancement for prospective ECG-gated single R-R axial 320-MDCT angiography: comparison of 60- and 80-mL iopamidol 370 injection. AJR Am J Roentgenol 2011;197:844-50. [Crossref] [PubMed]
- Liu J, Gao J, Wu R, Zhang Y, Hu L, Hou P. Optimizing contrast medium injection protocol individually with body weight for high-pitch prospective ECG-triggering coronary CT angiography. Int J Cardiovasc Imaging 2013;29:1115-20. [Crossref] [PubMed]
- Seifarth H, Puesken M, Kalafut JF, Wienbeck S, Wessling J, Maintz D, Heindel W, Juergens KU. Introduction of an individually optimized protocol for the injection of contrast medium for coronary CT angiography. Eur Radiol 2009;19:2373-82. [Crossref] [PubMed]
- Abbara S, Blanke P, Maroules CD, Cheezum M, Choi AD, Han BK, Marwan M, Naoum C, Norgaard BL, Rubinshtein R, Schoenhagen P, Villines T, Leipsic J. SCCT guidelines for the performance and acquisition of coronary computed tomographic angiography: A report of the society of Cardiovascular Computed Tomography Guidelines Committee: Endorsed by the North American Society for Cardiovascular Imaging (NASCI). J Cardiovasc Comput Tomogr 2016;10:435-49. [Crossref] [PubMed]
- Livingston EH, Lee S. Body surface area prediction in normal-weight and obese patients. Am J Physiol Endocrinol Metab 2001;281:E586-91. [Crossref] [PubMed]
- IAEA. Dosimetry in Diagnostic Radiology: An International Code of Practice. Technical Report Series No. 457. Vienna: International Atomic Energy Agency, 2007.
- ICRP. The 2007 Recommendations of the International Commission on Radiological Protection. ICRP publication 103. Ann ICRP 2007;37:1-332. [PubMed]
- Shrimpton PC. Assessment of patient dose in CT. In: EUR. European guidelines for multislice computed tomography funded by the European Commission 2004: contract number FIGMCT2000-20078-CTTIP, Appendix C.: European Commission 2004.
- Shrimpton PC, Hillier MC, Lewis MA, Dunn M. Doses from computed tomography (CT) examinations in the UK: 2003 review. Report NRPB-W67: National Radiological Protection Board 2005.
- Abbara S, Arbab-Zadeh A, Callister TQ, Desai MY, Mamuya W, Thomson L, Weigold WG. SCCT guidelines for performance of coronary computed tomographic angiography: a report of the Society of Cardiovascular Computed Tomography Guidelines Committee. J Cardiovasc Comput Tomogr 2009;3:190-204. [Crossref] [PubMed]
- Cademartiri F, Maffei E, Palumbo AA, Malago R, La Grutta L, Meiijboom WB, Aldrovandi A, Fusaro M, Vignali L, Menozzi A, Brambilla V, Coruzzi P, Midiri M, Kirchin MA, Mollet NR, Krestin GP. Influence of intra-coronary enhancement on diagnostic accuracy with 64-slice CT coronary angiography. Eur Radiol 2008;18:576-83. [Crossref] [PubMed]
- Dalager MG, Bottcher M, Andersen G, Thygesen J, Pedersen EM, Dejbjerg L, Gotzsche O, Botker HE. Impact of luminal density on plaque classification by CT coronary angiography. Int J Cardiovasc Imaging 2011;27:593-600. [Crossref] [PubMed]
- Fei X, Du X, Yang Q, Shen Y, Li P, Liao J, Li K. 64-MDCT coronary angiography: phantom study of effects of vascular attenuation on detection of coronary stenosis. AJR Am J Roentgenol 2008;191:43-9. [Crossref] [PubMed]
- Horiguchi J, Fujioka C, Kiguchi M, Shen Y, Althoff CE, Yamamoto H, Ito K. Soft and Intermediate Plaques in Coronary Arteries: How Accurately Can We Measure CT Attenuation Using 64-MDCT? AJR Am J Roentgenol 2007;189:981-8. [Crossref] [PubMed]
- Komatsu S, Kamata T, Imai A, Ohara T, Takewa M, Miyaji K, Yoshida J, Kodama K. Controlling intracoronary CT number for coronary CT angiography. J Cardiol 2013;61:155-61. [Crossref] [PubMed]
- Andreucci M, Faga T, Pisani A, Sabbatini M, Russo D, Michael A. Prevention of Contrast-Induced Nephropathy through a Knowledge of Its Pathogenesis and Risk Factors. ScientificWorldJournal 2014;2014:823169. [Crossref] [PubMed]
- Amato E, Salamone I, Naso S, Bottari A, Gaeta M, Blandino A. Can contrast media increase organ doses in CT examinations? A clinical study. AJR Am J Roentgenol 2013;200:1288-93. [Crossref] [PubMed]
- Amato E, Lizio D, Settineri N, Di Pasquale A, Salamone I, Pandolfo I. A method to evaluate the dose increase in CT with iodinated contrast medium. Med Phys 2010;37:4249-56. [Crossref] [PubMed]
- Sahbaee P, Abadi E, Segars WP, Marin D, Nelson RC, Samei E. The Effect of Contrast Material on Radiation Dose at CT: Part II. A Systematic Evaluation across 58 Patient Models. Radiology 2017;283:749-57. [Crossref] [PubMed]
- Grudzenski S, Kuefner MA, Heckmann MB, Uder M, Lobrich M. Contrast medium-enhanced radiation damage caused by CT examinations. Radiology 2009;253:706-14. [Crossref] [PubMed]
- Wang L, Li Q, Wang XM, Hao GY, Jie B, Hu S, Hu CH. Enhanced radiation damage caused by iodinated contrast agents during CT examination. Eur J Radiol 2017;92:72-7. [Crossref] [PubMed]
- Burbank FH, Brody WR, Bradley BR. Effect of volume and rate of contrast medium injection on intravenous digital subtraction angiographic contrast medium curves. J Am Coll Cardiol 1984;4:308-15. [Crossref] [PubMed]
- Herzog BA, Husmann L, Valenta I, Tay FM, Burkhard N, Gaemperli O, Wyss CA, Landmesser U, Kaufmann PA. Determinants of vessel contrast in BMI-adapted low dose CT coronary angiography with prospective ECG-triggering. Int J Cardiovasc Imaging 2009;25:625-30. [Crossref] [PubMed]
- Pazhenkottil AP, Husmann L, Buechel RR, Herzog BA, Nkoulou R, Burger IA, Vetterli A, Valenta I, Ghadri JR, von Schulthess P, Kaufmann PA. Validation of a new contrast material protocol adapted to body surface area for optimized low-dose CT coronary angiography with prospective ECG-triggering. Int J Cardiovasc Imaging 2010;26:591-7. [Crossref] [PubMed]
- Bae KT, Heiken JP, Brink JA. Aortic and hepatic contrast medium enhancement at CT. Part I. Prediction with a computer model. Radiology 1998;207:647-55. [Crossref] [PubMed]
- Katori R. Normal cardiac output in relation to age and body size. Tohoku J Exp Med 1979;128:377-87. [Crossref] [PubMed]
- Nakajima Y, Yoshimine T, Yoshida H, Sakashita K, Okamoto M, Kishikawa M, Yagi K, Yokota J, Hayakawa T. Computerized tomography angiography of ruptured cerebral aneurysms: factors affecting time to maximum contrast concentration. J Neurosurg 1998;88:663-9. [Crossref] [PubMed]
- Sakai S, Yabuuchi H, Chishaki A, Okafuji T, Matsuo Y, Kamitani T, Setoguchi T, Honda H. Effect of cardiac function on aortic peak time and peak enhancement during coronary CT angiography. Eur J Radiol 2010;75:173-7. [Crossref] [PubMed]
- Suzuki H, Oshima H, Shiraki N, Ikeya C, Shibamoto Y. Comparison of two contrast materials with different iodine concentrations in enhancing the density of the the aorta, portal vein and liver at multi-detector row CT: a randomized study. Eur Radiol 2004;14:2099-104. [Crossref] [PubMed]
- Mahnken AH, Rauscher A, Klotz E, Muhlenbruch G, Das M, Gunther RW, Wildberger JE. Quantitative prediction of contrast enhancement from test bolus data in cardiac MSCT. Eur Radiol 2007;17:1310-9. [Crossref] [PubMed]
- van Hoe L, Marchal G, Baert AL, Gryspeerdt S, Mertens L. Determination of scan delay time in spiral CT-angiography: utility of a test bolus injection. J Comput Assist Tomogr 1995;19:216-20. [Crossref] [PubMed]
- Yang WJ, Chen KM, Liu B, Pang LF, Zhang H, Pan ZL, Yan FH. Contrast media volume optimization in high-pitch dual-source CT coronary angiography: feasibility study. Int J Cardiovasc Imaging 2013;29:245-52. [Crossref] [PubMed]
- Higashigaito K, Schmid T, Puippe G, Morsbach F, Lachat M, Seifert B, Pfammatter T, Alkadhi H, Husarik DB. CT Angiography of the Aorta: Prospective Evaluation of Individualized Low-Volume Contrast Media Protocols. Radiology 2016;280:960-8. [Crossref] [PubMed]
- Mihl C, Maas M, Turek J, Seehofnerova A, Leijenaar RT, Kok M, Lobbes MB, Wildberger JE, Das M. Contrast Media Administration in Coronary Computed Tomography Angiography - A Systematic Review. RoFo 2017;189:312-25. [Crossref] [PubMed]
- Bae KT. Intravenous contrast medium administration and scan timing at CT: considerations and approaches. Radiology 2010;256:32-61. [Crossref] [PubMed]
- Weininger M, Barraza JM, Kemper CA, Kalafut JF, Costello P, Schoepf UJ. Cardiothoracic CT angiography: current contrast medium delivery strategies. AJR Am J Roentgenol 2011;196:W260-72. [Crossref] [PubMed]
- Alkadhi H, Stolzmann P, Scheffel H, Desbiolles L, Baumuller S, Plass A, Genoni M, Marincek B, Leschka S. Radiation dose of cardiac dual-source CT: the effect of tailoring the protocol to patient-specific parameters. Eur J Radiol 2008;68:385-91. [Crossref] [PubMed]
- Khan AN, Khosa F, Nikolic B, Shuaib W, Lin PJ, Khan MK. Cancerogenesis Risks between 64 and 320 Row Detector CT for Coronary CTA Screening. J Clin Imaging Sci 2014;4:18. [Crossref] [PubMed]
- Zhang C, Yu Y, Zhang Z, Wang Q, Zheng L, Feng Y, Zhou Z, Zhang G, Li K. Imaging quality evaluation of low tube voltage coronary CT angiography using low concentration contrast medium. PLoS One 2015;10:e0120539. [Crossref] [PubMed]

