

The value of the computer-aided diagnosis system for thyroid lesions based on computed tomography images
Introduction
The thyroid gland is one of the most important organs in the human body. It releases thyroid hormones to regulate metabolic functions such as heart rate, cardiac output and heat regulation (1). A lump within the thyroid is called a thyroid nodule because of the abnormal growth of thyroid cells. Although there are up to 70% of adults identified with thyroid nodules in ultrasound examinations, a small proportion of thyroid nodules (<7%) are diagnosed to be malignant (2). The major challenge is the differential diagnosis of benign or malignant thyroid nodules. A precise diagnosis can optimize patient health care and avoid unnecessary surgical treatment (3).
The extensive efforts have been made to develop evaluation methods for thyroid nodule diagnosis. Invasive biopsy and noninvasive imaging technique are the two main approaches implemented in the clinic recently. The former is a fine-needle aspiration biopsy (FNAB) (4). In FNAB, a thin needle is inserted into the thyroid nodule, and a sample of cells is collected and examined. It is currently the most reliable diagnostic tool for determining benign or malignant thyroid nodules (5). However, there are still a few cases reported as indeterminateness if the target samples are not well located during the operation in FNAB. Furthermore, it may cause tumor transportation and hematoma (6). Hence, FNAB is recommended for those nodules with intermediate or high suspicion patterns (7).
The latter are medical imaging techniques which provide the functional and anatomic information of the thyroid and play a very promising role in the evaluation of thyroid nodules (8). Cross-sectional imaging techniques including ultrasonography (USG), magnetic resonance imaging (MRI), positron emission tomography (PET), and computed tomography (CT) could be used to detect incidental thyroid nodules (ITNs) and evaluate the thyroid nodules (9-11). USG is a highly sensitive imaging modality for detecting small thyroid nodule (12). The characteristics of thyroid nodules in ultrasound, such as solid component, hypoechogenicity, irregular margins, micro-calcifications, and taller-than-wide shape, can show a significant relationship with nodule malignancy (12). Accordingly, the ultrasound computer-aided diagnosis (CAD) systems have been developed to contour thyroid nodules and make an objective differentiation between benign and malignant thyroid lesions (13-15). MRI plays an adjuvant role in clinical practice (8). A recent study revealed that quantitative diffusion-weighted MRI could be a promising noninvasive method to identify thyroid cancer (16). Fluorine-18-Fluorodeoxyglucose (FDG) PET is well-established in patients with metastasis, particularly in patients presenting elevated serum thyroglobulin levels and negative radioiodine during whole-body scans (17).
CT is sensitive to detect intra-glandular calcification (8). In clinical practice, radiologists visually inspect a lot of thyroid CT images, which is tedious and error-prone. Some subtle CT features, like micro-calcification, could be missed in visual inspection (18). To resolve these issues, we have developed a CAD system to differentiate the nodule from the normal thyroid CT images (19). However, the limitation of our previous system is that it has no functions in identifying the nodule malignancy.
In this retrospective study, we proposed a CAD system to evaluate the thyroid nodules in CT images. In the preprocessing, we used a median filter to reduce noises and delineated the contour of the thyroid manually. After that, seventeen features were extracted from thyroid regions, including first-order statistics and gray level co-occurrence matrix (GLCM) texture features. To identify the benign and malignant nodules, we used a support vector machine (SVM), linear discriminant analysis, random forest, and bootstrap aggregating (bagging) to evaluate the system’s performance. Based on the experimental results, our system performs well in the cross-validation, indicating its potential to release the radiologists’ burden and improve the malignancy diagnosis of thyroid nodules.
Methods
Thyroid database
In this study, the retrospective database includes CT images, radiological and pathological diagnoses from February 2015 to January 2016. The consents of all patients were waived in this retrospective study.
Ninety-eight thyroid nodules (52 benign; 46 malignant) were selected from 90 patients (age: 15–80 years) which were scanned in the neck or chest in Ruian People Hospital (Zhejiang, China). All images were obtained using a 16-channel Helical CT scanner (Sensation, Siemens Medical Solution). The imaging parameters were set as follows: tube voltage, 120 kVp; tube current, 300 mA; detector configuration, 16×0.6 mm; slice thickness and cross-sectional distance, 3 mm; pitch, 1; rotation time, 0.5 s; B31 standard of reconstruction kernel. All patients lay in supine position. Eighty-six cases (96%) were scanned from the pharynx oralis to the upper edge of the clavicle, and four cases (4%) were scanned to tracheal bifurcation.
From each nodule, one to three images were selected. Moreover, the related regions of interest were delineated by two senior radiologists. The ROIs were confirmed by both radiologists. One ROI was extracted if the nodule diameter is smaller than 3 mm, and two or three ROIs were extracted while the nodule diameter is over 3 mm. Subsequently, 122 benign and 115 malignant ROIs are determined, respectively. The number of thyroid nodules and CT images in our database is shown in Table 1.

Full table
After the surgical treatments, an experienced pathologist examined the histologic section of lesions and defined the benign or malignancy, which is regarded as the gold standard for this study. In our database, the benign lesions include goiter, thyroiditis, and thyroid adenoma. Malignant nodules include papillary and follicular thyroid cancer.
Proposed method
After setting up the database, we applied the following image-processing algorithm to evaluate the thyroid lesions. As shown in Figure 1, the algorithm mainly consists of the following steps: image preprocessing, feature extraction in 2D images, model training, and evaluation. We describe the details of these steps as below.

Preprocessing
The quality of CT images may be slightly degraded by the quantum noise, which is associated with the number of photons contributed to the reconstructed image (20). The noise can cause heterogeneity in CT images, which may cover the underlying biological heterogeneity. To reduce the quantum noise, a median filter with a matrix of 3×3 size was used. Then, an experienced radiologist manually delineated the contour of the thyroid. The thyroid gland has two lobes that lie on each side of the trachea. In our study, we focused on the thyroid lobe with nodules, which were identified in pathological examinations. Figure 2 shows the delineated thyroid CT images.

Feature extraction
Previous studies found that multiple punctate calcifications and solitary calcified nodules may represent an increased risk for thyroid malignancy (21). For thyroid nodules, spatial heterogeneity is a well-recognized feature that reflects the area of necrosis, hemorrhage, and calcification (22). To quantify the heterogeneity, we chose seventeen texture features, including first order and second order statistics based on the performance of features in our previous research (19).
First order statistics are computed from the image histogram, which measures the probability of a certain pixel occurring in an image. In our study, we used average intensity, standard deviation, uniformity, and entropy to measure the heterogeneity. The average intensity is the mean intensity of all the pixels in ROI, which correlates mean attenuation value in the thyroid. Standard deviation describes the off variation from the average intensity. Uniformity measures the distribution of intensity level, which is defined as,
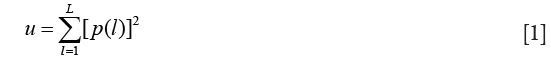
where p(l) is the probability of the occurrence of the gray level l, and L is the maximum intensity in the image.
Entropy describes the randomness and irregularity of the pixel intensities. Image entropy is defined as,
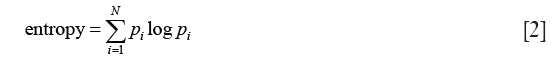
Where pi is the probability that the pixel intensity is equal to i, and N is the maximum intensity in the image. In our case, if multiple punctate calcifications appear in the thyroid, average intensity, standard deviation, and entropy will increase, and uniformity will decrease.
First-order statistics measure the gray level distribution in the image. However, they do not provide information about the neighborhood relationship among pixels. GLCM is a widely used method in second-order statistics (23). Given an image I(x, y), the co-occurrence matrix Pθ, d(i, j)describes how frequently two pixels with gray-level i and j will appear in the window separated by a certain distance d in a certain angle θ.
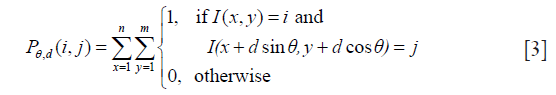
where m, n are the numbers of columns and rows in the image I, and θ is the angle between the referenced pixel and the adjacent pixel.
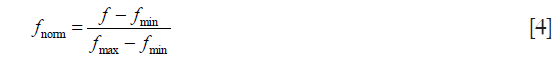
There are 13 texture features extracted from the GLCM matrix Pθ, d(i, j), including angle second moment, correlation, entropy, contrast, inverse difference moment, sum average, sum entropy, sum variance, sum square, difference variance, difference entropy, information measure of correlation 1, and information measure of correlation 2 (23). We calculated the GLCMs with four different orientations which represent horizontal, diagonal, vertical and anti-diagonal by 0o, 45o, 90o and 135o respectively. To achieve rotation invariant textures, the thirteen GLCM features in four directions were averaged. All seventeen features, including first order and second order statistics, were normalized and ranged in [0,1] using min-max scaling method via the following equation:
Classification
The images in our thyroid database belong to two different groups: benign and malignant thyroid nodules. The goal of the classification task is to classify new test samples with the prediction model generated based on the training samples. Regarding the complexity of different supervised methods, we used LDA, SVM, bagging, and random forest to identify the malignancy of thyroid nodules. The computational requirements of LDA are not too high, but it may have numerical problems in high-dimensional classification (24). SVM is effective in nonlinear and high dimensional spaces (25), but it could be inefficient to train in large-scale problems (26). Bagging and random forest can handle high dimensional spaces as well as large numbers of training samples. However, they use a group of “weak learners” to form a “strong learner”, so the performance could rely on the selected classifiers and parameters (27).
LDA is a well-established classification method (28,29). It is based on the concept of searching for a linear combination of the feature variables that best separates two classes. The discriminant function is defined as,
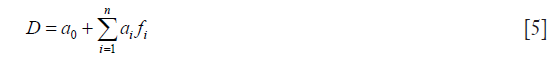
where fi is the value of the ith feature, ai is the coefficient estimated from the training data, and n is the number of the features. LDA computes the optimal combination by minimizing the distance between the same classes and maximizing the distance between different classes simultaneously. The threshold of the discriminant function is placed at the midpoint between the mean values of two classes.
SVM is a classical supervised learning method that performs classification tasks by constructing hyper-plane in multidimensional space (29,30). SVM constructs the optimal separation hyper-plane to data that is linearly inseparable, by mapping the data into a high-dimensional feature space in which they can be separated linearly. Given a set of training data {(xi, yi)}Ni=1, SVM seeks a separating hyperplane with the maximum margin. Using a soft-margin, we obtain the primal problem for SVM:
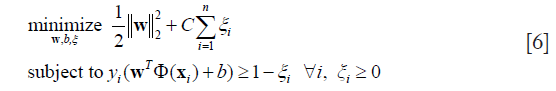
Where ξi is the slack variable, Φ is the mapping function, w is a normal vector, and C is the parameter which determines the tradeoff between a large margin and less constrained violation. In this study, we used the radial basis function (RBF) kernel as the mapping function and grid search to estimate the parameters.
Bootstrap aggregating is a meta-algorithm that pools decisions from multiple classifiers (31,32). Bagging method takes subsamples with replacement from the initial training set Tn to generate multiple input sets Tb, (b=1,2,…,B). Each input set is used to train a different component of the base classifier Cb, (b=1,2,…,B). To predict an unseen test sample x, we run the input through these individual classifiers, and the final decision is obtained via majority vote.
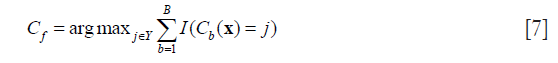
where Y is the label set, and I(·) is the indicator function which outputs 1 if the inner expression is true, otherwise which outputs 0.
Random forest (RF) is an ensemble learning method based on decision tree (33). RF constructs a multitude of decision trees with training data and combines their outputs for the final prediction. Each decision tree in a random forest is learned on a random bootstrap sample. At each node, a subset of features is randomly selected out of the original feature set. For each of the feature set, different thresholds are evaluated to split the training samples according to a given criterion. The best split, including feature and optimal threshold, is recorded in the node. For a testing sample, it goes through each tree in the forest, obtaining labels from each tree, and the final prediction is determined by the most represented label.
Evaluation
To evaluate the performance of our CAD system, we calculated several parameters, including the sensitivity (SEN), specificity (SPC), positive predictive value (PPV), negative predictive value (NPV), and accuracy. The calculations of these values are defined as follows:
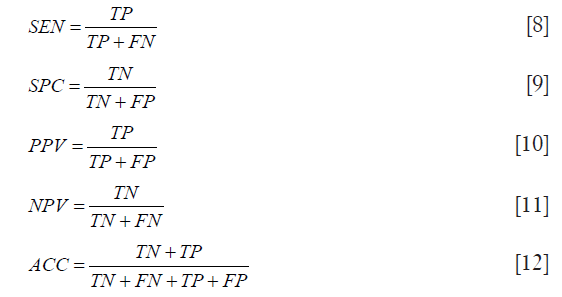
Where TP, TN, FP, FN are the numbers for true positive, true negative, false positive, and false negative respectively. Also, we used the area under the receiver operating characteristic curve to estimate the probability that the classifier could rank a randomly chosen positive sample higher than a randomly chosen negative sample.
Results
The classification of thyroid nodule images
As a preliminary study, we developed the computer-aided thyroid diagnosis system based on a small dataset (90 patients, 237 images). Leave-one-out cross-validation (LOOCV) was used as the size of the training set can be maximized. The model is trained based on the training dataset which incorporates all the data except one, and a prediction is made for that data which was left out. Each data was left out once. The classification results are shown in Table 2. All these classifiers show high accuracy in thyroid cancer identification. SVM, bagging, and RF can achieve classification accuracy over 0.8200 and AUC over 0.8500. In contrast, LDA is less accurate, achieving an accuracy of 0.7722 and AUC of 0.8446. The reason is that LDA fails to capture the nonlinear relationship with linear mapping.

Full table
Feature assessment
In the previous study, we used the whole seventeen features to achieve an accurate recognition of thyroid cancer based on CT images. To evaluate the performance of the first order and second order statistics separately, we built the classification models with different statistics and classifiers.
Comparing the methods with 1st order features and with GLCM features, the ACC and AUC of the former outperformed the latter in Table 3. Using only entropy, uniformity, average intensity, and standard deviation, the classification accuracy could reach over 0.8200 in both SVM and random forest. The classification using GLCM texture features achieves accuracy 0.7004 and AUC 0.7723 at best. From the experimental results, we can see that the gray-scale distribution of thyroid image, first order statistics, made a greater contribution to the identification of thyroid cancer than GLCM. Compared to the results in Table 2, the highest ACC (0.8481, method = SVM) and AUC (0.9057, method = RF) in classification using both the first-order and second-order statistics also outperforms those (ACC =0.8270, method = 1st + SVM; AUC =0.9049, method = 1st + RF) of using the first-order features only. Although the prediction accuracy using GLCM, which captures spatial correlation among adjacent pixels, is relatively low, the combination of first-order statistics and GLCM features performed well.

Full table
To reduce the redundancy in the original feature set, we implemented the relief algorithm (34). The database was randomly divided into 3 groups: 60% as training images, 20% as validation images, and 20% as test images. There are 142 (69 benign, 73 malignant), 48 (24 benign, 24 malignant) and 47 (22 benign, 25 malignant) images in training, validation and test dataset respectively. We used the relief algorithm on the training dataset and obtained rank for all the features. Based on the feature rank, different feature subsets, from the top-ranked one to the bottom one, were included and evaluated on the validation dataset. The optimal feature subset was considered to have the best classification performance. Finally, we tested the optimal feature subset on the test dataset to evaluate its generalization ability.
From Table 4, the classification performance is better after feature selection than before. The relief algorithm not only reduced the redundancy but also improved the prediction accuracy. To evaluate the risk of overfitting in the feature selection, we used the test set as the unseen samples. In Table 5, the classification results in the test data set are comparable with that in the validation set. The selected feature set performed better than the original seventeen features, and the generalization capability can be confirmed.

Full table

Full table
The selected feature set can be considered as the ‘imaging biomarker’ to identify the thyroid cancer in CT images. Since different classifiers have slightly different classification performances, the selected feature subsets use different features with different classifiers. Redundant features will be removed. As shown in Figure 3, we can see the correlation and some variance in GLCM were removed in all the classifiers. The difference entropy in GLCM and uniformity were selected in all the classifiers. The features selected by three classifiers include angle second moment, entropy, inverse difference moment, sum entropy, and difference variance in GLCM. These frequently selected features could be important in the CAD system for thyroid nodule evaluation.

Thyroid identification based on CT images
The goal of our CAD system is to assist doctors in the interpretation of CT images and improve thyroid cancer diagnosis. To provide ‘a second opinion’ for the radiologist, we evaluated our method in each thyroid. In our database, there are 237 CT images from 98 thyroid glands. We used the proposed method to identify the CT images from each thyroid gland. Leave-one-out cross-validation was used in the study in which CT images from ‘one’ thyroid gland were considered as one test sample. Also, a four-year experienced radiologist reviewed the CT images and provided the diagnosis recommendations. Then the reports were reassured by a senior radiologist. Please note that the radiologist categorized the thyroids into three groups: benign, malignant and indeterminate nodules. The third group may be caused by the image quality, the ambiguity of the lesion appearance, etc. We regarded the indeterminate group as an incorrect diagnosis in this study.
In Table 6, the presented CAD systems have higher accuracy than the visual inspection. The SVM method has the best performance in the thyroid nodule identification, achieving 0.8673 for accuracy and 0.9105 for AUC. As shown in Figure 4, we plotted the diagnosis results with different methods, including the pathological examination as the gold standard, radiologist visual inspection, LDA, SVM, bagging, and random forest classification results. We can find that 29 thyroid nodules were categorized into indeterminate nodules in the visual inspection as shown in Figure 5. It could be caused by the limited reading experience in thyroid CT images for our radiologist. In the future, the performance of senior radiologists and our CAD system could be evaluated. In this study, our CAD system can identify indeterminate cases, especially the malignant thyroid nodules. SVM, bagging and random forest showed comparable performance in thyroid nodule evaluation which could potentially improve the diagnostic accuracy.

Full table


Discussion
Nowadays, some studies have been conducted to assess the feasibility of CT images in thyroid nodule evaluation. Iodine concentration, Hounsfield unit curve slope, and effective atomic number can show a significant difference between benign and malignant groups (P<0.001) (35). Yoon reviewed CT scans of 734 patients and found that CT features, such as calcification, anterior-posterior and diameter ratios larger than 1, and mean attenuation valued larger than 130 HU, suggest malignancy of ITN (36). These previous investigations demonstrated that CT imaging characteristics have promising potential in the evaluation of thyroid nodules. Although the US imaging is still the preferred imaging modality for thyroid nodules, the CT imaging can provide valuable information for further operative intervention, especially for retrosternal goiters (22), malignant cases with extra-capsular extension suspicion (37), and cervical metastatic disease in papillary thyroid carcinoma (38).
In this preliminary study, we proposed the CAD systems to evaluate the thyroid nodules based on CT image analysis, selected the CT image features to improve the performance, and evaluated the CAD systems in thyroid identification. Comparing with the mentioned literature, our method achieved high and applicable performance with accuracy over 0.8500 and AUC over 0.9000.
The CT image analysis of thyroid nodules could provide cancer diagnosis information as ‘the second opinion’. Shetty’s study showed that there were no distinguishing CT features which can be used in visual inspection to identify a thyroid lesion as malignant (39). In our study, the recognition of thyroid cancer based on visual inspection has low accuracy, sensitivity and PPV (Table 6), which is consistent with Shetty’s work. In the visual inspection, the nodules were assessed with multiple imaging features, including size, location, density, the presence or absence of calcification, margins, and homogeneous versus heterogeneous consistency (39). These imaging features are quantified manually, which could be highly variable and rely on the experience, practice type and training of the radiologists (18). It is also difficult for visual inspection to capture the spatial relationship in images, like GLCM features, so the total numbers of variables are relatively smaller than that in our CAD system. Besides the data analysis method in previous studies, including Fisher's exact test, Student’s t-test, and one-way ANOVA (18,39,40), are used to determine the correlation between each CT feature and thyroid pathology. Our method served different purposes. It built a nonlinear model to interpret the high-dimensional features and estimated the generalization performance via cross-validation. Our results (Figure 3) suggest that the combination of different features is better in identifying the thyroid cancer than every single feature.
Incidental thyroid nodules were common findings in neck and chest CT scans (9), and our CAD system can provide the evaluation of the incidental thyroid nodules. The USG imaging could be introduced as a further step if the nodule showed malignant possibility in CT images. Compared to the USG imaging, the CT scan was used in the evaluation of mass effect, recurrence, and cancer extension into distant organs, such as the lungs (41). Nowadays, USG remains the major diagnostic modality for the evaluation of thyroid nodules (8). The previous ultrasound CAD systems, including ThyroScan (13), ThyroScreen (42), and Chang’s method (43), have reached high accuracy at 98.9%, 100%, and 98.3% respectively. However, these CAD systems were only assessed on small samples, 20, 20 and 59 patients respectively. A larger data set should be evaluated for a clinical trial. Our study reached an accuracy of 86.73% on the database of 90 patients.
Recently, deep convolutional neural network (DCNN) has proven effective in US image classification. Compared with the traditional CAD system, DCNN uses the input images and the convolutional layers to automatically extract information in the images, instead of building hand-crafted features. DCNN could improve prediction accuracy with large datasets (44). Ko used three CNNs diagnosing thyroid malignancy, and the AUCs were 0.845, 0.835, and 0.850 retrospectively based on 589 thyroid nodules (45). Song developed a multi-task cascade convolution neural network framework (MC-CNN) to exploit the context information of thyroid nodules and achieved up to 98.2% accuracy (46). Li devised a faster R-CNN, which is more suitable for thyroid papillary carcinoma detection in ultrasound images (47). Chi achieved the experimental results show the proposed fine-tuned Google-Net model achieves excellent classification performance, attaining 98.29% classification accuracy, 99.10% sensitivity and 93.90% specificity (48). Most of the thyroid studies using deep learning are based on the US images since US has been a major technique in thyroid diagnosis for around five decades (49). However, the value of CAD system using CT images for thyroid nodules was not reported. As a preliminary study, small numbers of CT thyroid cases were collected, and the CAD system based on CT images was proposed and evaluated. DCNN method was not considered in this work to avoid the overfitting on the small dataset (50). In the future study, a large number of CT images will be collected, and DCNN method will be introduced to improve the performance of CAD system further.
There are two limitations in our current study. First, radiologists have to delineate the ROIs manually on the CT slices. The delineation is tedious and suffers inter-observer variation. Our future work may include automatic segmentation of thyroid ROI to improve efficiency. Second, only the CT images were included in the diagnosis system. In the future study, more clinical information (blood tests, medical histories, and physical examination) and multimodality images (US and MRI) can be included and analyzed to improve the accuracy of the CAD system accuracy further.
Conclusions
We have developed a CAD system using texture features and support vector machine to evaluate the malignancy risk of thyroid nodule in CT images. In this study, we used 98 retrospective cases to build a thyroid database, including 237 thyroid CT images, pathological and radiological findings. Seventeen features, including first-order and second-order statistics, were extracted from CT images. Different classifiers (LDA, SVM, bagging, and random forest) were used to evaluate the performance of the CAD system. We also evaluated the performance of the feature subsets and selected the feature combination with relief algorithm. The accuracy of our CAD system reached 0.8673 in thyroid cancer identification. We do not expect that the presented method will replace the USG examinations. However, our system potentially could improve the accuracy of thyroid nodule diagnosis, reduce the burden of the radiologist and promote the interpretation of thyroid CT images.
Acknowledgements
Funding: We would like to thank Zhejiang Medicine, Health Science and Technology Program (No. 2015115991) and Zhejiang Educational Department Program (No. Y201636958) for their funding. And this work also was partially funded by the National Major Scientific Instruments Development Project (2013YQ170463).
Footnote
Conflicts of Interest: The authors have no conflicts of interest to declare.
Ethical Statement: This study was approved by the Ethics Committee of Hangzhou Medical College, Zhejiang Province, China.
References
- Keleş A, Keleş A. ESTDD: Expert system for thyroid diseases diagnosis. Expert Syst Appl 2008;34:242-6. [Crossref]
- Gopinath B, Shanthi N. Computer-aided diagnosis system for classifying benign and malignant thyroid nodules in multi-stained FNAB cytological images. Australas Phys Eng Sci Med 2013;36:219-30. [Crossref] [PubMed]
- Tsantis S, Dimitropoulos N, Cavouras D, Nikiforidis G. Morphological and wavelet features towards sonographic thyroid nodules evaluation. Comput Med Imaging Graph 2009;33:91-9. [Crossref] [PubMed]
- Gharib H, Goellner JR. Fine-needle aspiration biopsy of the thyroid: an appraisal. Ann Intern Med 1993;118:282-9. [Crossref] [PubMed]
- Suliburk J, Delbridge L. Surgical management of well-differentiated thyroid cancer: state of the art. Surg Clin North Am 2009;89:1171-91. [Crossref] [PubMed]
- Eszlinger M, Paschke R. Molecular fine-needle aspiration biopsy diagnosis of thyroid nodules by tumor specific mutations and gene expression patterns. Mol Cell Endocrinol 2010;322:29-37. [Crossref] [PubMed]
- Haugen BR, Alexander EK, Bible KC, Doherty GM, Mandel SJ, Nikiforov YE, Pacini F, Randolph GW, Sawka AM, Schlumberger M, Schuff KG. 2015 American Thyroid Association management guidelines for adult patients with thyroid nodules and differentiated thyroid cancer: the American Thyroid Association guidelines task force on thyroid nodules and differentiated thyroid cancer. Thyroid 2016;26:1-133. [Crossref] [PubMed]
- Chaudhary V, Bano S. Imaging of the thyroid: Recent advances. Indian J Endocrinol Metab 2012;16:371-6. [Crossref] [PubMed]
- Hoang JK, Branstetter BF IV, Gafton AR, Lee WK, Glastonbury CM. Imaging of thyroid carcinoma with CT and MRI: approaches to common scenarios. Cancer Imaging 2013;13:128-39. [Crossref] [PubMed]
- Shie P, Cardarelli R, Sprawls K, Fulda KG, Taur A. Systematic review: prevalence of malignant incidental thyroid nodules identified on fluorine-18 fluorodeoxyglucose positron emission tomography. Nucl Med Commun 2009;30:742-8. [Crossref] [PubMed]
- Brito JP, Gionfriddo MR, Al Nofal A, Boehmer KR, Leppin AL, Reading C, Callstrom M, Elraiyah TA, Prokop LJ, Stan MN, Murad MH. The accuracy of thyroid nodule ultrasound to predict thyroid cancer: systematic review and meta-analysis. J Clin Endocrinol Metab 2014;99:1253-63. [Crossref] [PubMed]
- Kwak JY, Han KH, Yoon JH, Moon HJ, Son EJ, Park SH, Jung HK, Choi JS, Kim BM, Kim EK. Thyroid imaging reporting and data system for US features of nodules: a step in establishing better stratification of cancer risk. Radiology 2011;260:892-9. [Crossref] [PubMed]
- Acharya UR, Sree SV, Krishnan MMR, Molinari F, Garberoglio R, Suri JS. Non-invasive automated 3D thyroid lesion classification in ultrasound: a class of ThyroScanTM systems. Ultrasonics 2012;52:508-20. [Crossref] [PubMed]
- Keramidas EG, Maroulis D, Iakovidis DK. TND: a thyroid nodule detection system for analysis of ultrasound images and videos. J Med Syst 2012;36:1271-81. [Crossref] [PubMed]
- Acharya UR, Sree SV, Krishnan MM, Molinari F. ZieleŸnik W, Bardales RH, Witkowska A, Suri JS. Computer-Aided Diagnostic System for Detection of Hashimoto Thyroiditis on Ultrasound Images From a Polish Population. J Ultrasound Med 2014;33:245-53. [Crossref] [PubMed]
- Shi HF, Feng Q, Qiang JW, Li RK, Wang L, Yu JP. Utility of diffusion-weighted imaging in differentiating malignant from benign thyroid nodules with magnetic resonance imaging and pathologic correlation. J Comput Assist Tomogr 2013;37:505-10. [Crossref] [PubMed]
- Treglia G, Muoio B, Giovanella L, Salvatori M. The role of positron emission tomography and positron emission tomography/computed tomography in thyroid tumours: an overview. Eur Arch Otorhinolaryngol 2013;270:1783-7. [Crossref] [PubMed]
- Hoang JK, Riofrio A, Bashir MR, Kranz PG, Eastwood JD. High variability in radiologists’ reporting practices for incidental thyroid nodules detected on CT and MRI. Am J Neuroradiol 2014;35:1190-4. [Crossref] [PubMed]
- Peng W, Liu C, Xia S, Shao D, Chen Y, Liu R, Zhang Z. Thyroid nodule recognition in computed tomography using first order statistics. Biomed Eng Online 2017;16:67. [Crossref] [PubMed]
- Hsieh J. Adaptive streak artifact reduction in computed tomography resulting from excessive x-ray photon noise. Med Phys 1998;25:2139-47. [Crossref] [PubMed]
- Wu CW, Dionigi G, Lee KW, Hsiao PJ, Shin MCP, Tsai KB, et al. Calcifications in thyroid nodules identified on preoperative computed tomography: patterns and clinical significance. Surgery 2012;151:464-70. [Crossref] [PubMed]
- Alic L, Niessen WJ, Veenland JF. Quantification of heterogeneity as a biomarker in tumor imaging: a systematic review. PLoS One 2014;9:e110300. [Crossref] [PubMed]
- Haralick RM. Statistical and structural approaches to texture. Proc IEEE 1979;67:786-804. [Crossref]
- Yu H, Yang J. A direct LDA algorithm for high-dimensional data with application to face recognition. Pattern Recognit 2001;34:2067-70. [Crossref]
- Chorowski J, Wang J, Zurada JM. Review and performance comparison of SVM-and ELM-based classifiers. Neurocomputing 2014;128:507-16. [Crossref]
- Shao YH, Chen WJ, Wang Z, Li CN, Deng NY. Weighted linear loss twin support vector machine for large-scale classification. Knowledge-Based Syst 2015;73:276-88. [Crossref]
- Kuncheva LI, Whitaker CJ. Measures of Diversity in Classifier Ensembles and Their Relationship with the Ensemble Accuracy. Mach Learn 2003;51:181-207. [Crossref]
- Mika S, Ratsch G, Weston J, Scholkopf B, Mullers KR. Fisher discriminant analysis with kernels. Neural networks for signal processing IX. Neural Networks for Signal Processing 1999;9:41-8.
- Luo S, Kim EH, Dighe M, Kim Y. Thyroid nodule classification using ultrasound elastography via linear discriminant analysis. Ultrasonics 2011;51:425-31. [Crossref] [PubMed]
- Hidrovo I, Dey J, Chesal ME, Shumilov D, Bhusal N, Mathis JM. Experimental method and statistical analysis to fit tumor growth model using SPECT/CT imaging: a preclinical study. Quant Imaging Med Surg 2017;7:299-309. [Crossref] [PubMed]
- Breiman L. Bagging predictors. Mach Learn 1996;24:123-40. [Crossref]
- Alfaro E, Gamez M, Garcia N. Adabag: An R package for classification with boosting and bagging. J Stat Softw 2013;54:1-35. [Crossref]
- Breiman L. Random forests. Mach Learn 2001;45:5-32. [Crossref]
- Kononenko I, Šimec E, Robnik-Šikonja M. Overcoming the myopia of inductive learning algorithms with RELIEFF. Appl Intell 1997;7:39-55. [Crossref]
- Li M, Zheng X, Li J, Yang Y, Lu C, Xu H, Yu B, Xiao L, Zhang G, Hua Y. Dual-energy computed tomography imaging of thyroid nodule specimens: comparison with pathologic findings. Invest Radiol 2012;47:58-64. [Crossref] [PubMed]
- Yoon DY, Chang SK, Choi CS, Yun EJ, Seo YL, Nam ES, Cho SJ, Rho YS, Ahn HY. The prevalence and significance of incidental thyroid nodules identified on computed tomography. J Comput Assist Tomogr 2008;32:810-5. [Crossref] [PubMed]
- Ishigaki S, Shimamoto K, Satake H, Sawaki A, Itoh S, Ikeda M, Ishigaki T, Imai T. Multi-slice CT of thyroid nodules: comparison with ultrasonography. Radiat Med 2004;22:346-53. [PubMed]
- Soler ZM, Hamilton BE, Schuff KG, Samuels MH, Cohen JI. Utility of computed tomography in the detection of subclinical nodal disease in papillary thyroid carcinoma. Arch Otolaryngol Head Neck Surg 2008;134:973-8. [Crossref] [PubMed]
- Shetty SK, Maher MM, Hahn PF, Halpern EF, Aquino SL. Significance of incidental thyroid lesions detected on CT: correlation among CT, sonography, and pathology. AJR Am J Roentgenol 2006;187:1349-56. [Crossref] [PubMed]
- Lee C, Chalmers B, Treister D, Adhya S, Godwin B, Ji L, Groshen S, Grant E. Thyroid lesions visualized on CT: sonographic and pathologic correlation. Acad Radiol 2015;22:203-9. [Crossref] [PubMed]
- Saeedan M. Bin, Aljohani IM, Khushaim AO, Bukhari SQ, Elnaas ST. Thyroid computed tomography imaging: pictorial review of variable pathologies. Insights Imaging 2016;7:601-17. [Crossref]
- Acharya UR, Faust O, Sree SV, Molinari F, Suri JS. ThyroScreen system: high resolution ultrasound thyroid image characterization into benign and malignant classes using novel combination of texture and discrete wavelet transform. Comput Methods Programs Biomed 2012;107:233-41. [Crossref] [PubMed]
- Chang Y, Paul AK, Kim N, Baek JH, Choi YJ, Ha EJ, Lee KD, Lee HS, Shin D, Kim N. Computer-aided diagnosis for classifying benign versus malignant thyroid nodules based on ultrasound images: A comparison with radiologist-based assessments. Med Phys 2016;43:554-67. [Crossref] [PubMed]
- Wang S, Wang R, Zhang S, Li R, Fu Y, Sun X, Li Y, Sun X, Jiang X, Guo X, Zhou X. 3D convolutional neural network for differentiating pre-invasive lesions from invasive adenocarcinomas appearing as ground-glass nodules with diameters ≤ 3 cm using HRCT. Quant Imaging Med Surg 2018;8:491-9. [Crossref] [PubMed]
- Ko SY, Lee JH, Yoon JH, Na H, Hong E, Han K, Jung I, Kim EK, Moon HJ, Park VY, Lee E. A deep convolutional neural network for the diagnosis of thyroid nodules on ultrasound. Head Neck 2019;41:885-91. [Crossref] [PubMed]
- Song W, Li S, Liu J, Qin H, Zhang B, Shuyang Z, Hao A. Multi-task Cascade Convolution Neural Networks for Automatic Thyroid Nodule Detection and Recognition. IEEE J Biomed Health Inform 2018. Epub ahead of print. [Crossref] [PubMed]
- Li H, Weng J, Shi Y, Gu W, Mao Y, Wang Y, Liu W, Zhang J. An improved deep learning approach for detection of thyroid papillary cancer in ultrasound images. Sci Rep 2018;8:6600. [Crossref] [PubMed]
- Chi J, Walia E, Babyn P, Wang J, Groot G, Eramian M. Thyroid Nodule Classification in Ultrasound Images by Fine-Tuning Deep Convolutional Neural Network. J Digit Imaging 2017;30:477-86. [Crossref] [PubMed]
- Han Z, Lei Z, Li M, et al. Differential diagnosis value of the ultrasound gray scale ratio for papillary thyroid microcarcinomas and micronodular goiters. Quant Imaging Med Surg 2018;8:507-513. [Crossref] [PubMed]
- Wang S, Zhang R, Deng Y, Chen K, Xiao D, Peng P, Jiang T. Discrimination of smoking status by MRI based on deep learning method. Quant Imaging Med Surg 2018;8:1113-20. [Crossref] [PubMed]

