
Cardiac balanced steady-state free precession MRI at 0.35 T: a comparison study with 1.5 T
Introduction
Despite the widespread use of high static field strength MRI scanners, clinical cardiac magnetic resonance (CMR) is most frequently carried out at a field strength of 1.5 T and less frequently at 3 T or higher (1). While higher field strengths provide increased signal-to-noise ratio (SNR) due to higher spin polarization, the specific absorption rate (SAR) increases as the square of the field strength, which could cause certain pulse sequences to be difficult to utilize. This SAR limitation is most relevant for sequences requiring high flip angles and short repetition time (TR) such as balanced steady-state free precession (bSSFP), which is considered the “workhorse” of cardiac MRI due to its superior SNR and blood-myocardium contrast-to-noise ratio (CNR) (1,2). For example, SAR limits the maximum allowable flip angle in bSSFP cardiac cine imaging to approximately 50° or less at 3 T and 80° or less at 1.5 T (for a conventional bSSFP cine sequence with a TR of 3 ms). Consequently, it may not be possible to take advantage of the maximum blood-myocardium contrast that can be obtained in bSSFP with higher flip angles (without sacrificing temporal resolution) (3). Furthermore, banding artifacts become more prominent due to increased B0 inhomogeneity at 3 T and higher field strengths, which degrade image quality and lead to compromised diagnostic outcomes (4,5).
At the other end of the field strength spectrum, low static-field MRI (B0 <1.0 T) has shown promise for diagnostic imaging (6,7). Rutt et al. demonstrated that the image quality at 0.5 T is diagnostically equivalent to that at 1.5 T in several body regions including myocardium (6). While low-field MRI is disadvantaged by a nominal SNR decrease proportional to field strength, it has a number of important and potentially useful features. The key advantage of low-field MRI is significantly reduced SAR (8). Because SAR scales quadratically with the magnetic field strength, at a field-strength of 0.35 T, SAR would be reduced by a factor of 73 compared to 3 T and a factor of 18 compared to 1.5 T. Reduction in SAR could make low-field MRI highly promising for applications such as interventional MR guided procedures and MRI of patients with implanted devices, as the reduced SAR should correlate to improved device safety and reduced heating effects. Furthermore, low-field MRI systems with modern magnet designs could lead to better B0 and B1 field homogeneity (9), which would be advantageous for cardiac MRI scanning and for other MRI applications in general. Finally, biological tissue R1 relaxivity is typically longer at lower field (T1 is shorter) (10), which could partially compensate for the SNR loss due to lower polarization at low field. The aforementioned issues warrant further studies on low field MRI in comparison with higher field scanning.
Our institution recently installed a real-time MRI-guided radiation therapy system (MRIdian, ViewRay Inc., Oakwood Village, OH, USA). The MRI component of this system is a 0.35 T superconducting MRI scanner. In this study, we sought to demonstrate the feasibility of cardiac MRI using bSSFP at 0.35 T by comparing our results with cardiac MRI at 1.5 T.
Methods
Estimation of blood and myocardium T1
Due to lack of access to an in vivo T1 mapping sequence for the 0.35 T system, we estimated the T1 for healthy myocardium and blood at 0.35 T using the method proposed by Bottomley et al. (10) where T1 is estimated as a function of field strength using the following equation:

where ν is the angular frequency (ν = γB0), and A and B are constants specific to different tissues. The constants A and B for blood and myocardium were calculated with Eq. [1] using recently published T1 values of blood and myocardium at 1.5 T (1,613 and 1,170 ms, respectively) and 3.0 T (1,900 and 1,486 ms, respectively) (11,12). The A and B parameters were subsequently used to extrapolate the expected blood and myocardial T1 at 0.35 T using Eq. [1].
Bloch simulations
The bSSFP steady state signal for blood and myocardium at 1.5 and 0.35 T was studied using Bloch simulations (13) in Matlab (The Mathworks, Natick, MA, USA). The bSSFP steady state signal is given by the following equation:
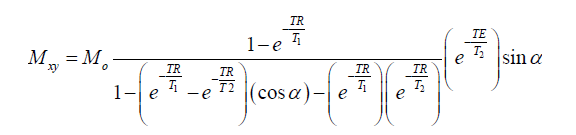
where Mo is the equilibrium magnetization, α is the flip angle (with alternating 180° phase), TR is the TR and TE is the echo time. The steady state signal was simulated for a range of flip angles from 0°–180°, to determine the flip angle that produces the highest blood-myocardium contrast, and for a range of resonant frequencies, ±400 Hz. The T1 for blood and myocardium at 1.5 T were those listed above and the T1 values at 0.35 T was obtained using the aforementioned extrapolation using Eq. [1]. The T2 for blood and myocardium were assumed to be 300 and 40 ms, respectively, for 1.5 T (14) and 350 and 45 ms, respectively, for 0.35 T. A TR of 4 ms was used for the Bloch simulations.
Low-field scanner
MRI at 0.35 T was carried out on the ViewRay MRIdian system. This is a real-time MRI-guided radiation therapy system, which includes an actively shielded, split-bore 0.35 T superconducting MRI system and a Cobalt-60 radiation therapy system. The system utilizes a Siemens software platform for MRI operation. The scanner was equipped with 18 mT/m gradient coils. Phantom and volunteer imaging was carried out using 6-channel chest and 6-channel spine surface coils.
In vivo study
Approval for this study was obtained from the appropriate local institutional review board. Written informed consent was obtained from all volunteers prior to MRI.
Cardiac MRI was carried out in seven healthy volunteers at 0.35 T. Cardiac cine images, breath-held and retrospectively ECG-triggered, were acquired using a bSSFP cine sequence with the following parameters: TR/TE: 4/2 ms, FOV: 320 mm, voxel size: 1.25×1.25×7 mm3, readout bandwidth: 772 Hz/pixel, parallel imaging with GRAPPA (R=2) (15). In six of the volunteers, multiple cardiac cine images were obtained using flip angles ranging from 50° to 150°, in short-axis as well as four-chamber long-axis views. Cardiac cine images were also acquired in the same six volunteers at 1.5 T on a Siemens Avanto scanner (Siemens Medical Systems, Erlangen, Germany) using a bSSFP sequence. The maximum gradient amplitude in this sequence was reduced to 18 mT/m so that TR, TE and readout bandwidth values could match those on the 0.35 T system. All other sequence parameters were matched to those on the 0.35 T system. Images in all volunteers were acquired at approximately the same slice locations and orientations as in the 0.35 T system for multiple flip angles between 50° and 90°. Flip angles higher than 90° were not possible at 1.5 T due to SAR limitations. The seventh volunteer only underwent the bSSFP cine MRI at 0.35 T that acquired a stack of short-axis images covering the entire left ventricle.
The SNR of the blood-pool and the left-ventricular myocardium was calculated from the ratio of the average tissue signal intensity to the standard deviation of a background region outside the body. The CNR between the blood-pool and left ventricular myocardium was calculated from the blood-pool and myocardium SNR difference. SNR and CNR values were calculated for all bSSFP images from the same end-diastolic phase image in all volunteers. SNR and CNR values at 0.35 T were corrected using the correction factor described above. SNR and CNR values are presented as mean ± standard deviation.
To compare the simulation results with the in vivo results, the ratio between the high-field value and the low-field value were calculated for the blood-pool SNR, the myocardium SNR and the blood-myocardium CNR at multiple flip angles, based on the simulation and in vivo results, respectively. The simulation ratios were multiplied by the factor 1.5/0.35=4.29 to account for the signal difference due to different degrees of polarization expected, so that these values can be directly compared with the in vivo ratios.
Image quality comparison
The short-axis in vivo cine images were scored to compare the subjective image quality between the 0.35 T and the 1.5 T images at multiple flip angles. The images were scored using a 1–4 point scale where 1= excellent, 2= good, 3= fair and 4= poor image quality. The criteria for scoring included overall image appearance, image contrast, noise and the appearance of small structures such as papillary muscles and valves. The image quality scores were reported as mean ± standard deviation. A paired t-test was used statistical comparison, and a P value less than 0.05 was considered significant. The image scoring was carried out by an evaluator who was blinded to the flip angles, scanner field strengths and volunteer-identifying information of the cine images.
Results
Estimation of blood and myocardium T1
Using Eq. [1] and the T1 values of blood and myocardium at 1.5 and 3 T, the constants A and B were calculated for both blood and myocardium. These values are:
Blood: A =23.1004×10⁻³, B =23.6253×10⁻².
Myocardium: A =23.7658×10⁻⁴, B =34.4926×10⁻².
This enabled us to calculate the expected T1 values of blood and myocardium at 0.35 T:
Expected T1 of blood at 0.35 T: 1,144 ms.
Expected T1 of myocardium at 0.35 T: 708 ms.
These values were used to carry out the Bloch simulations of blood and myocardium at 0.35 T.
Bloch simulations
Bloch simulation results are shown in Figure 1. The bSSFP steady state magnetization signals were normalized to M0. Figure 1A,B show the steady-state blood signal, myocardium signal and blood-myocardium contrast (calculated as the blood-myocardium signal difference) as a function of excitation flip angle at 1.5 and 0.35 T. This simulation shows that the maximum blood-myocardium contrast occurs at a flip angle of 56° for 1.5 T and at 70° for 0.35 T. Figure 1C,D show the steady-state blood signal, myocardium signal and blood-myocardium contrast as a function of resonance frequency at 1.5 and 0.35 T. These signals were simulated at flip angles of 56° for 1.5 T and 70° for 0.35 T. The difference in results between the two simulations is due to the estimated T1 and T2 differences at the two field strengths.

The Bloch simulation results in Figure 1A,B show that the normalized steady state signal for blood, myocardium and blood-myocardium contrast is higher at 0.35 T than 1.5 T by factors of 1.275 (blood), 1.401 (myocardium) and 1.228 (blood-myocardium contrast). After accounting for signal differences due to field strength polarization, this indicates that the SNR at 0.35 T are smaller than 1.5 T by factors of 3.36 (blood), 3.06 (myocardium) and 3.49 (blood-myocardium contrast) instead of 1.5/0.35=4.29. It is noted that these simulation results do not account for the blood inflow effect, and the measured SNR and CNR values should be higher than those suggested by the simulations.
In vivo study
Cardiac bSSFP cine images were acquired successfully at 0.35 T in all volunteers. While the images were noisier due to the low field-strength, the myocardium as well as the papillary muscles and mitral valves could be clearly delineated. Mitral valves were also visible in the long axis images.
Figure 2 top row shows a single phase from bSSFP cine images acquired with multiple flip angles at 0.35 T in a volunteer. Images were acquired for flip angles as high as 150° without encountering any SAR restrictions, as SAR is significantly reduced at 0.35 T compared to higher field strengths. Qualitatively, the blood-myocardium contrast appears to improve with flip angles higher than 90°. For comparison, the 1.5 T images from the same volunteer are shown in Figure 2 bottom row. In general, cine images at 1.5 T could not be acquired for flip angles higher than 90° due to SAR limitations.

Figure 3 shows multiple cardiac phases from bSSFP cine images at 0.35 and 1.5 T. Figure 3A top row shows short-axis cardiac cine images at 0.35 T acquired at a flip angle of 110°, while the bottom row shows short-axis images from the same volunteer acquired at 1.5 T at a flip angle of 70° (a video animation for Figure 3A is provided as Figure 4). The 0.35 T images show clear depiction of papillary muscles and right ventricular myocardium. The degree of contractility appears similar in both 0.35 and 1.5 T images. Figure 3B top row shows 4-chamber long-axis images from the same volunteer acquired at 0.35 T at a flip angle of 110°, while the bottom row shows 4-chamber long-axis images at 1.5 T acquired at a flip angle of 70° (a video animation for Figure 3B is provided as Figure 5). Mitral valve closure is visible in the 0.35 T long axis image in column 2.


Figure 6A,B,C shows the average blood-pool SNR (Figure 6A), left ventricular myocardium SNR (Figure 6B) and blood-left-ventricular-myocardium CNR (Figure 6C) at multiple flip angles at both 0.35 and 1.5 T in all volunteers. At 1.5 T, the blood SNR increases with flip angle, the myocardium SNR decreases with flip angle, and the blood-myocardium CNR increases with flip angle, as expected from the literature (3). At 0.35 T, the blood SNR is maximum at 130° (SNR =40.5), while the myocardium SNR is maximum at 70° (SNR =11.0). The blood-myocardium CNR is maximum at 130° (CNR =31.7) at 0.35 T, which can be considered as the optimal flip angle for 0.35 T.

The comparison of the high-field SNR to low-field between the simulation results and the in vivo results are shown in Figure 6D,E,F. For the in vivo results, the ratios were calculated for each volunteer and then averaged. For the simulation results, the data were collected from the Bloch simulations presented in Figure 1A,B (the values used to calculate the ratios are indicated by the crosses). Overall, there is good agreement between the in vivo ratios and the simulation ratios. Both the in vivo and the simulation ratios follow the same pattern with respect to flip angles for all three parameters, i.e., the ratios decrease with increasing flip angle. It should be noted that for the myocardium SNR, the ratios at the 50° flip angle have the closest agreement, while the agreement decreases with increasing flip angle. This may be due to magnetization transfer (MT) effects.
Image quality comparison
Results of the image quality comparison between the 0.35 and 1.5 T images are shown in Figure 7. All 1.5 T images had excellent image quality, with an overall image score of 1.1±0.4. The overall image quality score of the 0.35 T images was 2.0±0.9, with a lot of variation across flip angles. As seen in Figure 7, the images with lower flip angles had poorer image quality scores whereas the images with higher flip angles had improved image scores among the 0.35 T images. Statistical comparison showed that the 0.35 T images of flip angle 70° has poorer quality compared to 1.5 T images of flip angle 70°, and the 0.35 T images of flip angle 90° has poorer quality compared to 1.5 T images of flip angle 90°, with P<0.05 for both cases. However, the 0.35 T images at flip angle 130° had a score of 1.6±0.9, which was not significantly different from the score of the 1.5 T images at flip angle 90° (1.2±0.4), with P>0.05. In addition, the 0.35 T images at flip angle 110° also had a score of 1.6±0.9, which was also not significantly different from the score of the 1.5 T images at flip angle 90° (P>0.05). This suggests that at higher flip angles, the 0.35 T images may have image quality comparable to that of images at 1.5 T.

Discussion
In this study, we demonstrate the feasibility of performing diagnostic cardiac MRI at 0.35 T using a bSSFP sequence. The field of MRI has experienced tremendous advances in the past 3 decades with regard to not only field strength and hardware performance, but also pulse sequences and image reconstruction methods. One consequence of such fast parallel advances along both lines is that there was no opportunity to apply some of the latest MRI pulse sequences to lower field strengths. For example, although the bSSFP technique was first described in 1958 (18), it was not technically feasible due to MRI system performance limitations until the late 1990’s and early 2000’s, by which time 1.5 T MRI had already become mainstream. From then on, the field of cardiac MRI quickly took off in part due to our ability to run bSSFP sequences. However, bSSFP, as an excellent acquisition strategy for cardiac MRI, was never thoroughly evaluated at lower field strengths, despite several desirable features of lower field strengths. Low-field MRI has been receiving increasing attention since a study by Rutt et al. (6) demonstrated that, for certain imaging applications, low-field MR images are diagnostically equivalent to images acquired at 1.5 T. In recent years, low-field MRI has seen application in open MRI systems (19,20), intraoperative MRI (21,22) and is under active research in portable MRI platforms (23,24). In anticipation of increasing applications of low-field MR, recently a study was published by Wu et al. (7) exploring the feasibility of low-field MR at various field strengths for compressed sensing applications. The commercial availability of low field systems with modern magnet design and hardware performance, such as the ViewRay system used in this study, may enable the community to study the scientific merit of low field systems for various applications.
Compared to higher field strengths, low field has potential advantages: (I) significantly reduced specific absorption rate (SAR). As SAR scales quadratically with field strength, the SAR at 0.35 T is expected to be approximately 5% of the SAR at 1.5 T, therefore essentially eliminating any SAR-related concerns for virtually any pulse sequence; (II) significantly reduced risks for MRI scanning in the presence of implanted metallic devices. MRI scanning of patients with implanted devices, both cardiac and non-cardiac devices, is an increasing need that presents scientific and safety challenges. A major concern is device heating in the MRI environment due to radiofrequency pulsing. It is generally accepted that device heating would be significantly reduced at low field due to the lower Larmor frequency and the longer radiofrequency wavelength, which would make devices and long conducting structures, such as a pacing lead or guidewire, less likely to support a standing wave in the MRI environment. For example, certain deep brain stimulators are currently labeled for SAR limits of only 0.1 W/kg (25,26), which would be restrictive for many regularly-used sequences at 1.5 T or higher. With low-field MRI, the more lenient SAR restrictions could make imaging patients with deep brain stimulators more feasible. These advantages in reduced heating may prove beneficial in the future for applications such as interventional MRI (27-29) by enabling safe use of a number of interventional devices in the MRI environment; (III) increased R1 relaxivity of biological tissues and contrast agents. It is well known in the MRI literature that tissue R1 has a strong dependence on field strength (10). As described above, this increase in R1 (shorter T1) may partially compensate for the SNR loss due to lower polarization at low field. In addition, the R1 of MRI contrast agents is generally higher at lower field strengths.
In the comparison shown in Figure 6, the in vivo results and the simulation results have a very good agreement. We have described above that one of the advantages of low-field MRI is shorter tissue T1 at 0.35 T compared to 1.5 T, as this T1 shortening may compensate for the SNR at 0.35 T due to lower polarization. The simulation results show that due to T1 shortening, the signals at 0.35 T are higher than what would be expected due to polarization change alone. The good agreement between our in vivo measurements and our Bloch simulations supports this claim. It should be noted that the blood-pool signal simulations did not account for the in-flow effect, and this may account for the slight difference between the in vivo and simulated blood-pool signals. It should also be noted that our simulations for the myocardium signal did not account for MT effects, which have been shown to attenuate tissue signal in bSSFP images (30,31). MT effects may account for the pattern in Figure 6E: at lower flip angles, the MT effect is smaller, leading to a better agreement between in vivo and simulated results. At higher flip angles, the MT effect is greater, which may be causing the myocardium SNR to decrease. Furthermore, the MT ratio is thought to be proportional to field strength (14), which may cause the MT effect to be higher at 1.5 T compared to 0.35 T. This may explain why the agreement between in vivo and simulated results decreases at higher flip angles.
The image quality scoring comparison shown in Figure 7 demonstrates that the 0.35 T images with the higher flip angles may have image quality comparable to that of the 1.5 T images. While the mean image quality scores of the 0.35 T images with flip angles 110° and 130° is higher than the score of the 1.5 T images with flip angle 90° (due to increased noise at the lower field strength), this difference is not statistically significant. This may indicate that using higher flip angles, the images acquired at 0.35 T may have image quality that is feasible for diagnostic purposes.
One major disadvantage of low-field MRI is that it may be unsuitable for certain applications that are already SNR limited, such as high-resolution neuroimaging, and in vivo MR spectroscopy. In addition, cardiac MRI using an RF-spoiled gradient echo or fast-low-angle shot (FLASH) sequence may also be limited. Our preliminary results using a FLASH cine sequence suggest that the SNR may be too low for cardiac cine imaging using a FLASH sequence, but contrast-enhanced FLASH imaging is beyond the scope of this study.
Conclusions
In conclusion, this study demonstrates that cardiac bSSFP MRI is highly feasible at the low-field strength of 0.35 T. Despite lower SNR and CNR at 0.35 T, blood and myocardium are clearly visible, showing very good contrast in both left and right ventricles. Because of reduced SAR at 0.35 T, the maximum achievable flip angle in bSSFP at 0.35 T is far greater than that at 1.5 T. Image quality scoring demonstrates that low-field strength images at high flip angles may have image quality comparable to those at 1.5 T.
Acknowledgements
Funding: The authors wish to acknowledge financial support from: American Heart Association, 15POST22700041.
Footnote
Conflicts of Interest: The authors have no conflicts of interest to declare.
References
- Finn JP, Nael K, Deshpande V, Ratib O, Laub G. Cardiac MR imaging: state of the technology. Radiology 2006;241:338-54. [Crossref] [PubMed]
- Barkhausen J, Ruehm SG, Goyen M, Buck T, Laub G, Debatin JF. MR evaluation of ventricular function: true fast imaging with steady-state precession versus fast low-angle shot cine MR imaging: feasibility study. Radiology 2001;219:264-9. [Crossref] [PubMed]
- Srinivasan S, Ennis DB. Optimal flip angle for high contrast balanced SSFP cardiac cine imaging. Magn Reson Med 2015;73:1095-103. [Crossref] [PubMed]
- Bangerter NK, Hargreaves BA, Vasanawala SS, Pauly JM, Gold GE, Nishimura DG. Analysis of multiple-acquisition SSFP. Magn Reson Med 2004;51:1038-47. [Crossref] [PubMed]
- Benkert T, Ehses P, Blaimer M, Jakob PM, Breuer FA. Dynamically phase-cycled radial balanced SSFP imaging for efficient banding removal. Magn Reson Med 2015;73:182-94. [Crossref] [PubMed]
- Rutt BK, Lee DH. The impact of field strength on image quality in MRI. J Magn Reson Imaging 1996;6:57-62. [Crossref] [PubMed]
- Wu Z, Chen W, Nayak KS. Minimum Field Strength Simulator for Proton Density Weighted MRI. PLoS One 2016;11. [Crossref] [PubMed]
- Bernstein MA, King KF, Zhou ZJ. Handbook of MRI pulse sequences. Amsterdam; Boston: Academic Press, 2004:xxi, 1017.
- Haacke EM. Magnetic resonance imaging: physical principles and sequence design. New York: Wiley, 1999:xxvii, 914.
- Bottomley PA, Foster TH, Argersinger RE, Pfeifer LM. A review of normal tissue hydrogen NMR relaxation times and relaxation mechanisms from 1-100 MHz: dependence on tissue type, NMR frequency, temperature, species, excision, and age. Med Phys 1984;11:425-48. [Crossref] [PubMed]
- Chow K, Flewitt JA, Green JD, Pagano JJ, Friedrich MG, Thompson RB. Saturation recovery single-shot acquisition (SASHA) for myocardial T(1) mapping. Magn Reson Med 2014;71:2082-95. [Crossref] [PubMed]
- von Knobelsdorff-Brenkenhoff F, Prothmann M, Dieringer MA, Wassmuth R, Greiser A, Schwenke C, Niendorf T, Schulz-Menger J. Myocardial T1 and T2 mapping at 3 T: reference values, influencing factors and implications. J Cardiovasc Magn Reson 2013;15:53. [Crossref] [PubMed]
- Hargreaves BA. Bloch Equation Simulator. Available online: http://mrsrl.stanford.edu/~brian/blochsim
- Stanisz GJ, Odrobina EE, Pun J, Escaravage M, Graham SJ, Bronskill MJ, Henkelman RM. T1, T2 relaxation and magnetization transfer in tissue at 3T. Magn Reson Med 2005;54:507-12. [Crossref] [PubMed]
- Griswold MA, Jakob PM, Heidemann RM, Nittka M, Jellus V, Wang J, Kiefer B, Haase A. Generalized autocalibrating partially parallel acquisitions (GRAPPA). Magn Reson Med 2002;47:1202-10. [Crossref] [PubMed]
- Rashid S, Han F, Gao Y, Sung K, Cao M, Yang Y, Hu P. Video animation corresponding to Figure 3A, showing bSSFP cine images acquired at 0.35 T with a flip angle of 110° (top video) and at 1.5 T with a flip angle of 70° (bottom video), acquired in short axis view. Papillary muscles are clearly visible in the 0.35 T vide. Asvide 2018;5:715. Available online: http://www.asvide.com/article/view/26743
- Rashid S, Han F, Gao Y, Sung K, Cao M, Yang Y, Hu P. Video animation corresponding to Figure 3B, showing bSSFP cine images acquired at 0.35 T with a flip angle of 110° (top video) and at 1.5 T with a flip angle of 70° (bottom video), acquired in 4-chamber long axis view. Mitral valve leaflets are visible in the 0.35 T video. Asvide 2018;5:716. Available online: http://www.asvide.com/article/view/26744
- Carr HY. Steady-State Free Precession in Nuclear Magnetic Resonance. Phys Rev 1958;112:1693-701. [Crossref]
- Klein HM, Meyners W, Neeb B, Labenz J, Truummler KH. Cardiac magnetic resonance imaging using an open 0.35 T system. J Comput Assist Tomogr 2007;31:430-4. [Crossref] [PubMed]
- Muto M, Giurazza F, Guarnieri G, Senese R, Schena E, Zeccolini F, Diano A. Dynamic MR in patients affected by neurogenical claudication: technique and results from a single-center experience. Neuroradiology 2016;58:765-70. [Crossref] [PubMed]
- Gerlach R, du Mesnil de Rochemont R, Gasser T, Marquardt G, Reusch J, Imoehl L, Seifert V. Feasibility of Polestar N20, an ultra-low-field intraoperative magnetic resonance imaging system in resection control of pituitary macroadenomas: lessons learned from the first 40 cases. Neurosurgery 2008;63:272-84; discussion 284-5. [Crossref] [PubMed]
- Schulder M, Catrambone J, Carmel PW. Intraoperative magnetic resonance imaging at 0.12 T: is it enough? Neurosurg Clin N Am 2005;16:143-54. [Crossref] [PubMed]
- Cooley CZ, Stockmann JP, Armstrong BD, Sarracanie M, Lev MH, Rosen MS, Wald LL. Two-dimensional imaging in a lightweight portable MRI scanner without gradient coils. Magn Reson Med 2015;73:872-83. [Crossref] [PubMed]
- Espy MA, Magnelind PE, Matlashov AN, Newman SG, Sandin HJ, Schultz LJ, Sedillo R, Urbaitis AV, Volegov PL. Progress Toward a Deployable SQUID-Based Ultra-Low Field MRI System for Anatomical Imaging. IEEE Transactions on Applied Superconductivity 2015;25:1-5. [Crossref]
- Larson PS, Richardson RM, Starr PA, Martin AJ. Magnetic resonance imaging of implanted deep brain stimulators: experience in a large series. Stereotact Funct Neurosurg 2008;86:92-100. [Crossref] [PubMed]
- Tremmel J. Urgent Device Correction - Change of Safe Limits for MRI Procedures Used with Medtronic Activa Deep Brain Stimulation Systems. 2005.
- Campbell-Washburn AE, Faranesh AZ, Lederman RJ, Hansen MS. Magnetic Resonance Sequences and Rapid Acquisition for MR-Guided Interventions. Magn Reson Imaging Clin N Am 2015;23:669-79. [Crossref] [PubMed]
- Campbell-Washburn AE, Rogers T, Basar B, Sonmez M, Kocaturk O, Lederman RJ, Hansen MS, Faranesh AZ. Positive contrast spiral imaging for visualization of commercial nitinol guidewires with reduced heating. J Cardiovasc Magn Reson 2015;17:114. [Crossref] [PubMed]
- Ratnayaka K, Faranesh AZ, Hansen MS, Stine AM, Halabi M, Barbash IM, Schenke WH, Wright VJ, Grant LP, Kellman P, Kocaturk O, Lederman RJ. Real-time MRI-guided right heart catheterization in adults using passive catheters. Eur Heart J 2013;34:380-9. [Crossref] [PubMed]
- Bieri O, Scheffler K. On the origin of apparent low tissue signals in balanced SSFP. Magn Reson Med 2006;56:1067-74. [Crossref] [PubMed]
- Robson MD, Piechnik SK, Tunnicliffe EM, Neubauer S. T1 measurements in the human myocardium: the effects of magnetization transfer on the SASHA and MOLLI sequences. Magn Reson Med 2013;70:664-70. [Crossref] [PubMed]

