
Site specific measurements of bone formation using [18F] sodium fluoride PET/CT
Introduction
Over the past 25 years, measurements of biochemical markers of bone turnover and bone mineral density (BMD) have assumed an important role in trials of new treatments for osteoporosis (1-12), and are often regarded as surrogate measures of the effectiveness of fracture prevention therapies (13). Bone turnover markers (BTM) such as serum procollagen type I N propeptide (PINP), bone alkaline phosphatase (bone ALP) and urinary cross-linked N-telopeptides of type I collagen (U-NTX) (14) have advantages that they are easily measured in blood or urine and can demonstrate the effect of anti-fracture treatment on bone formation or resorption within 1 week to 3 months of the start of treatment (13,15). However, measurements of BTM are not site specific and respond to the changes in bone turnover occurring throughout the entire skeleton. In contrast, measurements of BMD using dual-energy X-ray absorptiometry (DXA) have the advantage that they can be measured directly at important fracture sites such as the hip and spine, but the disadvantage that it can take 2 years or more to evaluate the full effect of treatment on bone mass (1-12).
It would be useful for the early phases of drug development to have a technique that can measure site specific changes in response to treatment on a shorter time scale than DXA scanning, say 3 months instead of 2 years. Since the primary aim of osteoporosis treatment is to prevent hip fractures, the ideal site to measure is the femoral neck or total hip region of interest (ROI) used in DXA. Such measurements could provide useful input to decisions to proceed from phase II to phase III trials and help avoid late stage attrition. Although the assessment of bone turnover using bone biopsy with double tetracycline labelling still has an important role in the evaluation of the safety and mechanism of action of new anti-fracture drugs (16-21), bone biopsy studies are limited by their restriction to the iliac crest, their relatively invasive nature, the need for a skilled and experienced practitioner, and the difficulty of obtaining both baseline and follow-up studies in the same subjects.
In the past, radioisotopes have provided an alternative method of studying bone turnover, and there is a large historical literature based on the use of bone seeking radionuclides such as 32P, 45Ca, 47Ca and 85Sr in non-imaging tracer studies (22-25). Today, quantitative studies of bone using radionuclides are based around medical imaging using either hybrid positron emission tomography and computed tomography (PET/CT) dual-modality systems (26) or the gamma camera (27). The use of short half-life tracers such as fluorine-18 sodium fluoride ([18F]NaF, T1/2 =110 min) for PET, or technetium-99m methylene diphosphonate ([99mTc]TcMDP, T1/2 =6 hours) for gamma camera imaging, ensures that the radiation dose to subjects is kept as low as possible. These techniques are attractive because they provide quantitative measurements of bone formation rate at specific sites in the skeleton (26,27), subject only to the limitations set by spatial resolution.
Historical studies using autoradiography showed that bone seeking tracers such as [18F]NaF and [99mTc]TcMDP are laid down on the surface of newly forming hydroxyapatite crystals at sites of bone formation (28-30). Hence measurements of the uptake of tracer into bone reflect the amount of actively mineralizing bone present, and the aspect of bone turnover being studied relates to osteoblastic activity. Several recent studies have shown significant correlations between the regional plasma clearance of [18F]NaF and bone formation rate (31) and mineral apposition rate (32,33). A striking visual confirmation of how bone tracers are laid down exclusively at sites of newly forming bone was provided by X-ray fluorescence imaging of bone biopsy specimens obtained after treatment of osteoporotic women with stable strontium ranelate (34). However, it is important to note that, for all types of radionuclide studies, blood flow is a rate-limiting step controlling uptake (35). If the first pass extraction efficiency of a tracer attains its maximum possible value of 100%, then the measurements purely reflect blood flow. Hence it is important to bear in mind that in general the changes in bone tracer kinetics found in radionuclide studies can be due to changes in either bone blood flow, or osteoblastic activity, or a combination of both.
This article reviews techniques for quantitative radionuclide imaging of bone suitable for research studies and clinical trials in the field of osteoporosis, with emphasis on [18F]NaF PET/CT. We begin by discussing the advantages of [18F]NaF PET/CT compared with gamma camera studies using [99mTc]TcMDP. Then we review the Hawkins method of performing quantitative [18F]NaF studies based on a 60-minute dynamic PET scan (26), and discuss a simplified approach to image acquisition and analysis which, with little loss of accuracy or precision, enables the same information to be obtained from a single short (3- to 5-minute) static scan acquired 45 to 75 minutes after tracer injection (36,37). The advantage of the static scan approach is that, with a series of short acquisitions made at different bed positions, quantitative measurements of bone plasma clearance can be made at multiple sites in the skeleton with only a single injection of [18F]NaF.
Advantages of [18F]NaF PET imaging
The first quantitative use of a radionuclide imaging agent to investigate various types of metabolic bone disease, including osteoporosis, was the 24-hour [99mTc]TcMDP whole-body retention test developed by Fogelman et al. (38). The test originally required a whole-body counter but, because few of these remain in use today, it was adapted for the dual-headed gamma camera by Brenner et al. (39). It was further refined by Moore et al., who added blood sampling to measure [99mTc]TcMDP plasma clearance and made measurements in several sub-regions of the skeleton including the skull, arms, legs, spine and pelvis (Figure 1A) (27).

The bone imaging agent [18F]NaF was first described by Blau et al. (42). Although its 511 keV positron annihilation gamma rays are unsuitable for the gamma camera, its properties make it the ideal bone agent for PET imaging. Over the last decade [18F]NaF PET/CT has become widely recognized as the optimum radionuclide imaging technique for the investigation of metastatic and metabolic bone disease due to the superior properties of [18F]NaF as a bone-seeking tracer and the better spatial resolution of PET scanners compared with either planar or single photon emission computed tomography (SPECT) (Figure 1) (43-51). The advantages of [18F]NaF for quantitative imaging of the skeleton include its exceptionally high and rapid uptake into bone, its rapid clearance from soft tissue, and the absence of any protein binding in the circulation (40). But the technique has some important limitations. PET/CT is an expensive technology compared with DXA or BTM, and the radiation dose to the subject is high despite the short half-life of [18F]NaF. The cost limits the number of subjects that can be enrolled in a study, and radiation dose the activity of [18F]NaF administered and the number of follow-up scans that can be performed.
Quantitative [18F]NaF PET imaging—the Hawkins method
The 60-minute dynamic [18F]NaF PET scan method described by Hawkins et al. (26) was the first radionuclide imaging technique to measure bone plasma clearance, and has since been widely employed in other studies (41,52-60). Plasma clearance measurements differ from the standardised uptake values (SUV) (61) conventionally measured by PET in that the rate of uptake of tracer to an organ is normalized to its concentration in arterial plasma. For example, glomerular filtration rate (GFR) expresses kidney function in terms of the volume of plasma required to transport the mass of tracer (conventionally inulin) excreted by the kidneys in a 1-minute time interval and is measured in units of mL·min−1. For PET studies, plasma clearance is expressed as the clearance per mL of tissue, and the units are mL·min−1·mL−1.
The advantage of the Hawkins method is that it provides a complete quantitative description of regional bone tracer kinetics in the first 60 minutes following a bolus injection of tracer (62). The method is summarized in Table 1. PET/CT scanners have a limited axial field of view (~15 cm), so the dynamic scan is restricted to the lumbar spine (Figure 1B), or hip (Figure 1C), or any similar sized ROI. Following positioning of the subject, a low mA CT scan is acquired for attenuation correction of the PET images, and can also help with the definition of the bone ROIs during scan analysis. After this a 10 mL injection of [18F]NaF is administered, and acquisition of the 60-minute dynamic PET scan commenced. A scan protocol consisting of twenty-four 5-second frames, four 30-second and fourteen 240-second (total time 60 minutes) gives adequate information about the bone uptake curve (Figure 2A).


To calculate the plasma clearance of fluoride to bone it is also necessary to measure the arterial input function (AIF) (Figure 2A), and this can be done either by direct sampling using an arterial line (52,53,56,62), or by using an image derived input function from an ROI placed over the aorta or femoral artery (53,55,62-64), or by using a semi-population method using serial venous blood samples taken 30–90 minutes after injection (65). Of these three approaches, direct arterial sampling is the preferred method for the most reliable results, while the semi-population method is simple and convenient as it involves taking only 3 or 4 blood samples. Once the AIF is known it is combined with the bone time-activity curves (TACs) for the various ROIs defined on the dynamic PET scan to determine the plasma clearance in each ROI. Both the AIF and the bone TACs require correction for the radioactive decay of [18F]NaF back to the time of injection.
Once the AIF and TACs have been determined, they are analysed using the Hawkins compartmental model (Figure 2B) to find the effective plasma flow (K1) and the plasma clearance to the bone mineral compartment (Ki) in each ROI (26). In the Hawkins model the rate constant K1 describes the clearance of [18F]NaF from plasma to the unbound bone pool, and is measured in units of mL·min−1·mL−1 (58). Regional bone blood flow can be estimated from K1 knowing the packed cell volume and the first pass extraction of [18F]NaF, which is often assumed to be 100% (66,67). The rate constant k2 in Figure 2B describes the reverse flow of tracer from the unbound bone pool to plasma in terms of the fraction of tracer in the unbound bone pool transported per minute (typical value ~0.4 min−1). Similarly k3 (~0.2 min−1) describes the forward transport from the unbound bone pool to bone mineral, and k4 (~0.01 min−1) the reverse flow from bone mineral to the unbound bone pool. The parameter Ki represents the net plasma clearance of [18F]NaF to the bone mineral compartment and is calculated from the following equation (26):
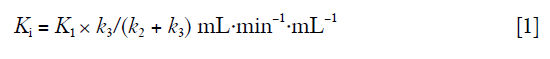
In Eq. [1], the ratio k3/(k2 + k3) represents the fraction of tracer initially cleared to the unbound bone pool that binds to bone mineral. As mentioned above, changes in Ki in response to treatment can reflect changes in either bone blood flow or bone formation rate. The form of Eq. [1] suggests that a change in bone formation rate will cause a change in the value of k3/(k2 + k3) by increasing the value of k3. A fifth free parameter, the fraction of the bone ROI occupied by blood, Fbv, can be added to improve the fit to the data in the first 30 seconds after injection of tracer.
Figure 2C shows the results of fitting the bone TAC and AIF in Figure 2A to the Hawkins model in terms of time plots of the amount of tracer in each compartment of the model. The fit to the model is obtained by varying the values of K1, k2, k3, k4 and Fbv until the predicted bone TAC gives the best fit to the measured curve. The value of Ki is then calculated using Eq. [1].
Figure 3A shows measurements of the precision error of each parameter in the Hawkins model expressed as the coefficient of variation derived from repeat PET scans of the lumbar spine over a 12-month period (68), and Figure 3B the percentage change in each parameter in response to 6-months treatment with teriparatide (68). By dividing treatment response by the precision error we obtain a measure of the statistical utility of each model parameter for measuring response to treatment (Figure 3C). In practice, of the various parameters measured by the Hawkins model Ki has the best precision, and experience shows that generally it is the most robust for measuring response to treatment. Following treatment with teriparatide the parameters k3/(k2 + k3) and k3 also showed statistically significant changes in response to treatment, but not K1, k2 or k4 (Figure 3B). Overall, the changes are consistent with teriparatide treatment increasing osteoblastic activity, but not bone blood flow.

Alternative methods to the Hawkins model for analyzing the AIF and bone TACs include deconvolution and spectral analysis (68). A fourth method, the Patlak plot, is described below.
Why measure bone plasma clearance?
The most common approach to quantifying PET images, for example in oncology, is to measure SUV (61). SUVs offer a simple method to express the uptake of PET tracers in tumours by taking the activity concentration in the ROI in kilo becquerels per millilitre (kBq/mL) and normalizing for injected activity and the subject’s body weight [SUV = kBq/mL body weight (kg)/injected activity (MBq)]. In oncology studies, uptake in tumours is frequently heterogeneous and the maximum SUV (SUVmax) is often reported. But in studies of metabolic bone diseases such as osteoporosis, where the uptake in bone is more uniform, it is preferable to smooth out the pixel-to-pixel noise in the image by expressing the SUV as the mean value in the bone ROI rather than the maximum.
For PET studies of bone, does it matter whether we choose to measure SUV or plasma clearance? The limitation of measuring SUVs is that only a finite amount of tracer is administered to the patient, and this has to be shared out between the various competing tissues. In the case of [18F]NaF, these include the kidneys and other regions of the skeleton. If a patient is treated with a potent bone anabolic agent such as teriparatide (69), or has extensive metastatic bone disease (70), or a large area of active Paget’s disease (71), the [18F]NaF plasma concentration will be reduced by the increased competition for tracer, resulting in a reduced measurement of SUV. As an example, in a [18F]NaF PET study of osteoporotic women taking teriparatide, after 6-months treatment the 1-hour [18F] plasma concentration was 21% lower than at baseline (69). Although measurements of Ki were 24% higher than baseline values, a highly statistically significant change (P=0.0003), values of SUV were only 3% higher and were not significantly different from baseline (P=0.84). Experience with other bone tracers confirms this phenomenon. In a trial of [89Sr] strontium chloride therapy for bone metastases from prostate cancer, at 1-hour after injection the [89Sr] plasma concentration in a subject with a ‘superscan’ was only 30% of values found in subjects with only a few small areas of metastatic bone disease (70). Plasma concentration of [99mTc]TcMDP was similarly reduced in a patient having a gamma camera bone scan for extensive Paget’s disease (71).
It follows that measurements of a change in SUV at a particular site partly reflect the changes in bone formation occurring at other sites in the skeleton. In contrast, plasma clearance measurements are free of this limitation because the uptake is expressed relative to the arterial concentration of tracer actually delivered to tissue rather than the amount of tracer injected. In studies of osteoporosis treatments that have a potent effect on whole skeleton bone formation, or subjects with extensive Paget’s or metastatic bone disease, plasma clearance can be a more reliable indicator of site-specific bone function than SUV (69).
Determination of bone plasma clearance using the Patlak plot
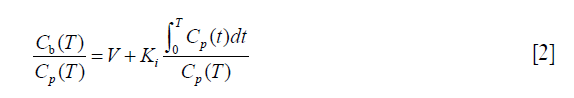
Provided that the Hawkins model rate constant k4 is negligibly small, Patlak analysis provides a simple alternative graphical method of measuring Ki (Figure 4A) (36). At time T after injection of tracer the concentration in the bone ROI, Cb(T), is expressed by the following equation:

 against normalized time
  (see Eq. [2]). Bone plasma clearance (Ki) is found from the slope of the straight-line fit to the 10–60 minutes data points. The intercept on the vertical axis gives the volume of distribution V. Reproduced with permission from (40). (B) Evaluation of kloss by the modified Patlak analysis of Holden et al. (72). Triangles, schematic plot of the standard analysis (kloss =0) applied to 10–60 minutes dynamic scan data. Circles, modified analysis (Eqs. [3] and [4]) with the value of kloss optimized to give the best straight-line fit to the 10–60 minutes data points. Squares, modified Patlak analysis over corrected for kloss. Reproduced with permission from (37). (C) Derivation of the semi-population input function. The population residual function is scaled for injected activity and the time of peak counts adjusted to agree with a region of interest drawn over the aorta for dynamic PET scan data or to the time of injection for static scans. This curve is added to the terminal exponential fitted to the 30-, 40-, 50- and 60-minute venous plasma data. The terminal exponential is rolled off using a ramp function at the time of peak counts so as not to affect the early rise of the bolus. Reproduced with permission from (65). (D) Derivation of bone plasma clearance using the simplified static-scan method (36,37). The right upper point is based on a measurement of bone uptake from a single 5-minute static scan acquired around 45–75 minutes after injection of tracer. The left lower point is the intercept of the graph and represents the population average volume of distribution V. The value of Ki is obtained from the slope of the straight line through the two points. Reproduced with permission from (40). [18F]NaF, fluorine-18 labelled sodium fluoride; PET, positron emission tomography.
where Cp is the concentration of tracer in plasma and the intercept of the straight line, V, is the volume of distribution in the unbound bone pool. To allow for equilibration between tracer in plasma and the unbound bone pool in the first 10 minutes after injection, the values of Ki and V are determined by fitting a straight line to the 10–60 minutes data. A limitation of the Patlak method is that it provides measurements of for Ki, but not K1 or the other parameters of the Hawkins model.
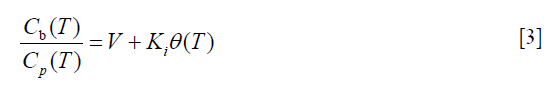
In practice the assumption that k4 is negligibly small is not strictly valid. As a consequence the points of the Patlak plot deviate slightly from a straight line (Figure 4A) and the resulting Ki measurements underestimate the Hawkins model values by around 25% on average. This problem can be avoided by using a modified Patlak analysis that introduces a rate constant kloss to represent the backflow of tracer out of the bone mineral compartment and into plasma (37). Following the method described by Holden et al. (72), Eq. [2] is rewritten as:
where:
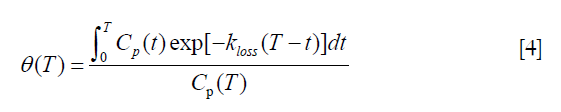
In this modified analysis the rate constant kloss is varied until the plot of normalized activity against normalized time θ(T) from 10–60 minutes after injection gives the best fit to a straight line (Figure 4B). Siddique applied the Holden method to 60-minute dynamic PET scans of the spine and hip and reported values of kloss ~0.006 min−1 at both sites along with values for the volume of distribution V (Table 2) (37).

Full table
A simplified method for [18F]NaF PET image acquisition and analysis
A full 60-minute dynamic PET scan is demanding for the patient, expensive in terms of scanner time and, because of the limited axial field of view of the PET scanner, only one bed position at a single skeletal site can be studied for each injection of [18F]NaF. To make studies simpler it would be helpful to have an alternative method that is easier for the patient, less expensive, and which enables Ki to be measured at multiple sites in the skeleton with a single injection of [18F]NaF. A method proposed by Siddique et al. (Table 3) meets these requirements with little loss of accuracy or precision compared with the standard Hawkins method (36,37).

Full table
In this alternative method, the AIF is found by measuring the terminal exponential by taking 3 or 4 venous blood samples starting 30 minutes after injection of tracer and adding a population derived residual curve to represent the early bolus peak and fast exponentials (Figure 4C) (65). For each individual PET scan, the residual curve is added to the terminal exponential after first scaling for injected activity and adjusting the origin to the time of injection. By 30 minutes the concentrations of tracer in arterial and venous blood have equalized, and by taking venous samples at 30, 40, 50 and 60 minutes the terminal exponential [which accounts for 75% of the area under the plasma curve in the first 60 minutes after injection (65)] can be reliably measured. However, this semi-population method of finding the AIF is not suitable for measuring K1, which requires an individual measurement of the AIF in each subject in the first few minutes after injection.
In Siddique’s method, the measurement of Ki is made by combining the information about the AIF derived from the semi-population method with a measurement of regional bone uptake from a single 3- to 5-minute static PET scan acquired around 60 minutes after injection (Table 3) (36). The value of Ki is found from a simplified Patlak plot consisting of just two data points (Figure 4D), representing the measured tracer concentration in the bone ROI at the time of the single static scan and the population value of the intercept V (Table 2). Rearranging Eq. [3] we have:
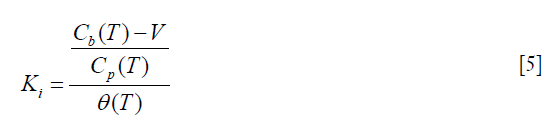
The normalized time θ(T) is calculated from the semi-population AIF assuming a value of kloss =0.006 min−1 (Table 3) (37). A limitation of the static scan method is that it is not possible to measure K1. However, performing a short (~5 to 10 minutes) dynamic scan at the time of injection would enable K1 to be measured at a single site. The chief advantage of the static scan method is that with a series of short scans acquired at different bed positions it is possible to measure Ki at several different skeletal sites with just a single injection of [18F]NaF (36,37).
Conclusions
Quantitative [18F]NaF PET imaging provides a novel way to study regional bone formation rate that complements conventional measurements with BTM as a tool to investigate new treatments for osteoporosis, and has potential as an early biomarker of treatment efficacy for use in clinical trials. Unlike BTM, which measure the response to treatment across the entire skeleton, [18F]NaF PET can distinguish the changes occurring at sites of particular interest for fracture prevention such as the hip and spine, or the difference in response between trabecular and cortical bone. Dynamic [18F]NaF PET scans measure effective bone plasma flow and bone plasma clearance of fluoride, but with a single injection of tracer the information is restricted to a single bed position by the narrow axial field of view of the PET scanner. In contrast, a series of short static PET scans at different bed positions combined with venous blood sampling can be used to estimate plasma clearance at multiple sites in the skeleton with a single injection. Studies to date have examined the accuracy and reproducibility of [18F]NaF PET measurements in osteoporosis, confirmed that the changes seen during treatment are biologically plausible, and suggested ways to shorten and simplify image acquisition and analysis. The next steps required are studies to link the changes in KI with clinical endpoints such as the change in fracture risk and the identification of responders and non-responders. These could be undertaken as multi-centre sub-studies in Phase III clinical trials and will require further work relating to quality control and the standardization of image acquisition and analysis.
Acknowledgements
GM Blake, ML Frost and I Fogelman have received research grants from Novartis, Eli Lilly and Warner Chilcott.
Footnote
Conflicts of Interest: The authors have no conflicts of interest to declare.
Dedication: This article is dedicated to the late Professor Ignac Fogelman, an outstanding mentor and friend, who died 5 July 2016.
References
- Black DM, Cummings SR, Karpf DB, Cauley JA, Thompson DE, Nevitt MC, Bauer DC, Genant HK, Haskell WL, Marcus R, Ott SM, Torner JC, Quandt SA, Reiss TF, Ensrud KE. Randomised trial of the effect of alendronate on risk of fracture in women with existing vertebral fractures. Lancet 1996;348:1535-41. [Crossref] [PubMed]
- Cummings SR, Black DM, Thompson DE, Applegate WB, Barrett-Connor E, Musliner TA, Palermo L, Prineas R, Rubin SM, Scott JC, Vogt T, Wallace R, Yates AJ, LaCroix AZ. Effect of alendronate on risk of fracture in women with low bone density but without vertebral fractures: results from the Fracture Intervention Trial. JAMA 1998;280:2077-82. [Crossref] [PubMed]
- Ettinger B, Black DM, Mitlak BH, Knickerbocker RK, Nickelsen T, Genant HK, Christiansen C, Delmas PD, Zanchetta JR, Stakkestad J, Glüer CC, Krueger K, Cohen FJ, Eckert S, Ensrud KE, Avioli LV, Lips P, Cummings SR. Reduction of vertebral fracture risk in postmenopausal women with osteoporosis treated with raloxifene: results from a 3-year randomised clinical trial. JAMA 1999;282:637-45. [Crossref] [PubMed]
- Harris ST, Watts NB, Genant HK, McKeever CD, Hangartner T, Keller M, Chesnut CH 3rd, Brown J, Eriksen EF, Hoseyni MS, Axelrod DW, Miller PD. Effects of risedronate treatment on vertebral and nonvertebral fractures in women with postmenopausal osteoporosis: a randomized controlled trial. Vertebral Efficacy With Risedronate Therapy (VERT) Study Group. JAMA 1999;282:1344-52. [Crossref] [PubMed]
- Neer RM, Arnaud CD, Zanchetta JR, Prince R, Gaich GA, Reginster JY, Hodsman AB, Eriksen EF, Ish-Shalom S, Genant HK, Wang O, Mitlak BH. Effect of recombinant human parathyroid hormone (1-34) fragment on spine and non-spine fractures and bone mineral density in postmenopausal osteoporosis. N Engl J Med 2001;344:1434-41. [Crossref] [PubMed]
- Chesnut CH, Skag A, Christiansen C, Recker R, Stakkestad JA, Hoiseth A, Felsenberg D, Huss H, Gilbride J, Schimmer RC, Delmas PD. Effects of oral ibandronate administered daily or intermittently on fracture risk in postmenopausal osteoporosis. J Bone Miner Res 2004;19:1241-9. [Crossref] [PubMed]
- Meunier PJ, Roux C, Seeman E, Ortolani S, Badurski JE, Spector TD, Cannata J, Balogh A, Lemmel EM, Pors-Nielsen S, Rizzoli R, Genant HK, Reginster JY. The effects of strontium ranelate on the risk of vertebral fracture in women with postmenopausal osteoporosis. N Engl J Med 2004;350:459-68. [Crossref] [PubMed]
- Black DM, Schwartz AV, Ensrud KE, Cauley JA, Levis S, Quandt SA, Satterfield S, Wallace RB, Bauer DC, Palermo L, Wehren LE, Lombardi A, Santora AC, Cummings SR. Effects of continuing or stopping alendronate after 5 years of treatment: the Fracture Intervention Trial Long-term Extension (FLEX): a randomized trial. JAMA 2006;296:2927-38. [Crossref] [PubMed]
- Black DM, Delmas PD, Eastell R, Reid IR, Boonen S, Cauley JA, Cosman F, Lakatos P, Leung PC, Man Z, Mautalen C, Mesenbrink P, Hu H, Caminis J, Tong K, Rosario-Jansen T, Krasnow J, Hue TF, Sellmeyer D, Eriksen EF, Cummings SR. Once-yearly zolendronic acid for treatment of postmenopausal osteoporosis. N Engl J Med 2007;356:1809-22. [Crossref] [PubMed]
- Cummings SR, San Martin J, McClung MR, Siris ES, Eastell R, Reid IR, Delmas P, Zoog HB, Austin M, Wang A, Kutilek S, Adami S, Zanchetta J, Libanati C, Siddhanti S, Christiansen C. Denosumab for prevention of fractures in postmenopausal women with osteoporosis. N Engl J Med 2009;361:756-65. [Crossref] [PubMed]
- Eastell R, Nagase S, Small M, Boonen S, Spector T, Ohyama M, Kuwayama T, Deacon S. Effect of ONO-5334 on Bone Mineral Density and Biochemical Markers of Bone Turnover in Postmenopausal Osteoporosis: 2-Year Results From the OCEAN Study. J Bone Miner Res 2014;29:458-66. [Crossref] [PubMed]
- Cosman F, Crittenden DB, Adachi JD, Binkley N, Czerwinski E, Ferrari S, Hofbauer LC, Lau E, Lewiecki EM, Miyauchi A, Zerbini CA, Milmont CE, Chen L, Maddox J, Meisner PD, Libanati C, Grauer A. Romosozumab Treatment in Postmenopausal Women with Osteoporosis. N Engl J Med 2016;375:1532-43. [Crossref] [PubMed]
- Glover SJ, Eastell R, McCloskey EV, Rogers A, Garnero P, Lowery J, Belleli R, Wright TM, John MR. Rapid and robust response of biochemical markers of bone formation to teriparatide therapy. Bone 2009;45:1053-8. [Crossref] [PubMed]
- Glover SJ, Gall M, Schoenborn-Kellenberger O, Wagener M, Garnero P, Boonen S, Cauley JA, Black DM, Delmas PD, Eastell R. Establishing a reference interval for bone turnover markers in 637 healthy, young, premenopausal women from the United Kingdom, France, Belgium, and the United States. J Bone Miner Res 2009;24:389-97. [Crossref] [PubMed]
- Garnero P, Shih WJ, Gineyts E, Karpf DB, Delmas PD. Comparison of new biochemical markers of bone turnover in late postmenopausal osteoporotic women in response to alendronate treatment. J Clin Endocrinol Metab 1994;79:1693-700. [PubMed]
- McClung MR, San Martin J, Miller PD, Civitelli R, Bandeira F, Omizo M, Donley DW, Dalsky GP, Eriksen EF. Opposite bone remodeling effects of teriparatide and alendronate in increasing bone mass. Arch Intern Med 2005;165:1762-8. [Crossref] [PubMed]
- Dempster DW, Cosman F, Kurland ES, Zhou H, Nieves J, Woelfert L, Shane E, Plavetić K, Müller R, Bilezikian J, Lindsay R. Effects of daily treatment with parathyroid hormone on bone microarchitecture and turnover in patients with osteoporosis: a paired biopsy study. J Bone Miner Res 2001;16:1846-53. [Crossref] [PubMed]
- Jiang Y, Zhao JJ, Mitlak BH, Wang O, Genant HK, Eriksen EF. Recombinant human parathyroid hormone (1-34) (teriparatide) improves both cortical and cancellous bone structure. J Bone Miner Res 2003;18:1932-41. [Crossref] [PubMed]
- Arlot M, Meunier PJ, Boivin G, Haddock L, Tamayo J, Correa-Rotter R, Jasqui S, Donley DW, Dalsky GP, Martin JS, Eriksen EF. Differential effects of teriparatide and alendronate on bone remodeling in postmenopausal women assessed by histomorphometric parameters. J Bone Miner Res 2005;20:1244-53. [Crossref] [PubMed]
- Lindsay R, Zhou H, Cosman F, Nieves J, Dempster DW, Hodsman AB. Effects of a one-month treatment with PTH(1-34) on bone formation on cancellous, endocortical, and periosteal surfaces of the human ilium. J Bone Miner Res 2007;22:495-502. [Crossref] [PubMed]
- Chavassieux P, Meunier PJ, Roux JP, Portero-Muzy N, Pierre M, Chapurlat R. Bone histomorphometry of transiliac paired bone biopsies after 6 or 12 months of treatment with oral strontium ranelate in 387 osteoporotic women. Randomized comparison to alendronate. J Bone Miner Res 2014;29:618-28. [Crossref] [PubMed]
- Reeve J, Wootton R, Hesp B. A new tracer method for the calculation of rates of bone formation and breakdown in osteoporosis and other generalised skeletal disorders. Calcif Tissue Res 1976;22:191-206. [Crossref] [PubMed]
- Reeve J, Arlot ME, Chavassieux PM, Edouard C, Green JR, Hesp R, Tellez M, Meunier PJ. The assessment of bone formation and bone resorption in osteoporosis: a comparison between tetracycline-based iliac histomorphometry and whole body 85Sr kinetics. J Bone Miner Res 1987;2:479-89. [Crossref] [PubMed]
- Reeve J, Arlot M, Wootton R, Edouard C, Tellez M, Hesp R, Green JR, Meunier PJ. Skeletal blood flow, iliac histomorphometry, and strontium kinetics in osteoporosis: a relationship between blood flow and corrected apposition rate. J Clin Endocrinol Metab 1988;66:1124-31. [Crossref] [PubMed]
- Eastell R, Colwell A, Hampton L, Reeve J. Biochemical markers of bone resorption compared with estimates of bone resorption from radiotracer kinetic studies in osteoporosis. J Bone Miner Res 1997;12:59-65. [Crossref] [PubMed]
- Hawkins RA, Choi Y, Huang SC, Hoh CK, Dahlbom M, Schiepers C, Satyamurthy N, Barrio JR, Phelps ME. Evaluation of the skeletal kinetics of fluorine-18-fluoride ion with PET. J Nucl Med 1992;33:633-42. [PubMed]
- Moore AE, Blake GM, Taylor KA, Rana AE, Wong M, Chen P, Fogelman I. Assessment of regional changes in skeletal metabolism following 3 and 18 months of teriparatide treatment. J Bone Miner Res 2010;25:960-7. [PubMed]
- Guillemart A, Besnard JC, Le Pape A, Galy G, Fetissoff F. Skeletal uptake of pyrophosphate labeled with technetium-95m and technetium-96, as evaluated by autoradiography. J Nucl Med 1978;19:895-9. [PubMed]
- Schümichen C, Rempfle H, Wagner M, Hoffmann G. The short-term fixation of radiopharmaceuticals in bone. Eur J Nucl Med 1979;4:423-8. [Crossref] [PubMed]
- Einhorn TA, Vigorita VJ, Aaron A. Localization of technetium-99m methylene diphosphonate in bone using microautoradiography. J Orthop Res 1986;4:180-7. [Crossref] [PubMed]
- Messa C, Goodman WG, Hoh CK, Choi Y, Nissenson AR, Salusky IB, Phelps ME, Hawkins RA. Bone metabolic activity measured with positron emission tomography and 18F-fluoride ion in renal osteodystrophy: correlation with bone histomorphometry. J Clin Endocrinol Metab 1993;77:949-55. [PubMed]
- Piert M, Zittel TT, Becker GA, Jahn M, Stahlschmidt A, Maier G, Machulla HJ, Bares R. Assessment of porcine bone metabolism by dynamic 18F-fluoride PET: correlation with bone histomorphometry. J Nucl Med 2001;42:1091-100. [PubMed]
- Frost ML, Compston JE, Goldsmith D, Moore AE, Blake GM, Siddique M, Skingle L, Fogelman I. 18F-fluoride positron emission tomography measurements of regional bone formation in hemodialysis patients with suspected adynamic bone disease. Calcif Tissue Int 2013;93:436-47. [Crossref] [PubMed]
- Boivin G, Farlay D, Khebbab MT, Jaurand X, Delmas PD, Meunier PJ. In osteoporotic women treated with strontium ranelate, strontium is located in bone formed during treatment with a maintained degree of mineralization. Osteoporos Int 2010;21:667-77. [Crossref] [PubMed]
- Czernin J, Satyamurthy N, Schiepers C. Molecular mechanisms of bone 18F-NaF deposition. J Nucl Med 2010;51:1826-9. [Crossref] [PubMed]
- Siddique M, Blake GM, Frost ML, Moore AE, Puri T, Marsden PK, Fogelman I. Estimation of regional bone metabolism from whole-body 18F-fluoride PET static images. Eur J Nucl Med Mol Imaging 2012;39:337-43. [Crossref] [PubMed]
- Siddique M, Frost ML, Moore AE, Fogelman I, Blake GM. Correcting 18F-fluoride PET static scan measurements of skeletal plasma clearance for tracer efflux from bone. Nucl Med Commun 2014;35:303-10. [Crossref] [PubMed]
- Fogelman I, Bessent RG, Turner JG, Citrin DL, Boyle IT, Greig WR. The use of whole-body retention of Tc-99m diphosphonate in the diagnosis of metabolic bone disease. J Nucl Med 1978;19:270-5. [PubMed]
- Brenner W, Bohuslavizki KH, Sieweke N, Tinnemeyer S, Clausen M, Henze E. Quantification of diphosphonate uptake based on conventional bone scanning. Eur J Nucl Med 1997;24:1284-90. [Crossref] [PubMed]
- Blake GM, Siddique M, Frost ML, Moore AE, Fogelman I. Quantitative PET imaging using 18F sodium fluoride in the assessment of metabolic bone diseases and the monitoring of their response to therapy. PET Clin 2012;7:275-91. [Crossref] [PubMed]
- Frost ML, Moore AE, Siddique M, Blake GM, Laurent D, Borah B, Schramm U, Valentin MA, Pellas TC, Marsden PK, Schleyer PJ, Fogelman I. 18F-fluoride PET as a noninvasive imaging biomarker for determining treatment efficacy of bone active agents at the hip: a prospective, randomized, controlled clinical study. J Bone Miner Res 2013;28:1337-47. [Crossref] [PubMed]
- Blau M, Nagler W, Bender MA. Fluorine-18: a new isotope for bone scanning. J Nucl Med 1962;3:332-4. [PubMed]
- Grant FD, Fahey FH, Packard AB, Davis RT, Alavi A, Treves ST. Skeletal PET with 18F-Fluoride: applying new technology to an old tracer. J Nucl Med 2008;49:68-78. [Crossref] [PubMed]
- Li Y, Schiepers C, Lake R, Dadparvar S, Berenji GR. Clinical utility of 18F-fluoride PET/CT in benign and malignant bone diseases. Bone 2012;50:128-39. [Crossref] [PubMed]
- Bastawrous S, Bhargava P, Behnia F, Djang DS, Haseley DR. Newer PET application with an old tracer: role of 18F-NaF skeletal PET/CT in oncologic practice. Radiographics 2014;34:1295-316. [Crossref] [PubMed]
- Hillner BE, Siegel BA, Hanna L, Duan F, Shields AF, Quinn B, Coleman RE. Impact of 18F-Fluoride PET on Intended Management of Patients with Cancers Other Than Prostate Cancer: Results from the National Oncologic PET Registry. J Nucl Med 2014;55:1054-61. [Crossref] [PubMed]
- Hillner BE, Siegel BA, Hanna L, Duan F, Shields AF, Coleman RE. Impact of 18F-fluoride PET in patients with known prostate cancer: initial results from the National Oncologic PET Registry. J Nucl Med 2014;55:574-81. [Crossref] [PubMed]
- Hillner BE, Siegel BA, Hanna L, Duan F, Quinn B, Shields AF. 18F-fluoride PET used for treatment monitoring of systemic cancer therapy: results from the National Oncologic PET Registry. J Nucl Med 2015;56:222-8. [Crossref] [PubMed]
- Raynor W, Houshmand S, Gholami S, Emamzadehfard S, Rajapakse CS, Blomberg BA, Werner TJ, Høilund-Carlsen PF, Baker JF, Alavi A. Evolving Role of Molecular Imaging with 18F-Sodium Fluoride PET as a Biomarker for Calcium Metabolism. Curr Osteoporos Rep 2016;14:115-25. [Crossref] [PubMed]
- Kulshrestha RK, Vinjamuri S, England A, Nightingale J, Hogg P. The Role of 18F-Sodium Fluoride PET/CT Bone Scans in the Diagnosis of Metastatic Bone Disease from Breast and Prostate Cancer. J Nucl Med Technol 2016;44:217-22. [Crossref] [PubMed]
- Brito AE, Santos A, Sasse AD, Cabello C, Oliveira P, Mosci C, Souza T, Amorim B, Lima M, Ramos CD, Etchebehere E. 18F-Fluoride PET/CT tumor burden quantification predicts survival in breast cancer. Oncotarget 2017;8:36001-11. [Crossref] [PubMed]
- Schiepers C, Nuyts J, Bormans G, Dequeker J, Bouillon R, Mortelmans L, Verbruggen A, De Roo M. Fluoride kinetics of the axial skeleton measured in vivo with fluorine-18-fluoride PET. J Nucl Med 1997;38:1970-6. [PubMed]
- Cook GJ, Lodge MA, Marsden PK, Dynes A, Fogelman I. Non-invasive assessment of skeletal kinetics using fluorine-18 fluoride positron emission tomography: evaluation of image and population-derived arterial input functions. Eur J Nucl Med 1999;26:1424-9. [Crossref] [PubMed]
- Piert M, Machulla HJ, Jahn M, Stahlschmidt A, Becker GA, Zittel TT. Coupling of porcine bone blood flow and metabolism in high-turnover bone disease measured by [15O]H2O and [18F]fluoride ion positron emission tomography. Eur J Nucl Med Mol Imaging 2002;29:907-14. [Crossref] [PubMed]
- Frost ML, Cook GJ, Blake GM, Marsden PK, Benatar NA, Fogelman I. A prospective study of risedronate on regional bone metabolism and blood flow at the lumbar spine measured by 18F-fluoride positron emission tomography. J Bone Miner Res 2003;18:2215-22. [Crossref] [PubMed]
- Installé J, Nzeusseu A, Bol A, Depresseux G, Devogelaer JP, Lonneux M. 18F-fluoride PET for monitoring therapeutic response in Paget's disease of bone. J Nucl Med 2005;46:1650-8. [PubMed]
- Frost ML, Blake GM, Cook GJ, Marsden PK, Fogelman I. Differences in regional bone perfusion and turnover between lumbar spine and distal humerus: 18F-fluoride PET study of treatment-naïve and treated postmenopausal women. Bone 2009;45:942-8. [Crossref] [PubMed]
- Doot RK, Muzi M, Peterson LM, Schubert EK, Gralow JR, Specht JM, Mankoff DA. Kinetic analysis of 18F-fluoride PET images of breast cancer bone metastases. J Nucl Med 2010;51:521-7. [Crossref] [PubMed]
- Frost ML, Siddique M, Blake GM, Moore AE, Schleyer PJ, Dunn JT, Somer EJ, Marsden PK, Eastell R, Fogelman I. Differential effects of teriparatide on regional bone formation using 18F-fluoride positron emission tomography. J Bone Miner Res 2011;26:1002-11. [Crossref] [PubMed]
- Frost ML, Siddique M, Blake GM, Moore AE, Marsden PK, Schleyer PJ, Eastell R, Fogelman I. Regional bone metabolism at the lumbar spine and hip following discontinuation of alendronate and risedronate treatment in postmenopausal women. Osteoporos Int 2012;23:2107-16. [Crossref] [PubMed]
- Keyes JW. SUV: standard uptake or silly useless value? J Nucl Med 1995;36:1836-9. [PubMed]
- Muzi M, O'Sullivan F, Mankoff DA, Doot RK, Pierce LA, Kurland BF, Linden HM, Kinahan PE. Quantitative assessment of dynamic PET imaging data on cancer imaging. Magn Reson Imaging 2012;30:1203-15. [Crossref] [PubMed]
- Puri T, Blake GM, Siddique M, Frost ML, Cook GJ, Marsden PK, Fogelman I, Curran KM. Validation of new image-derived arterial input functions at the aorta using 18F-fluoride positron emission tomography. Nucl Med Commun 2011;32:486-95. [Crossref] [PubMed]
- Puri T, Blake GM, Frost ML, Moore AE, Siddique M, Cook GJ, Marsden PK, Fogelman I, Curran KM. Validation of image-derived arterial input functions at the femoral artery using 18F-fluoride positron emission tomography. Nucl Med Commun 2011;32:808-17. [Crossref] [PubMed]
- Blake GM, Siddique M, Puri T, Frost ML, Moore AE, Cook GJ, Fogelman I. A semipopulation input function for quantifying static and dynamic 18F-fluoride PET scans. Nucl Med Commun 2012;33:881-8. [Crossref] [PubMed]
- Wootton R, Doré C. The single-passage extraction of 18F in rabbit bone. Clin Phys Physiol Meas 1986;7:333-43. [Crossref] [PubMed]
- Piert M, Zittel TT, Machulla HJ, Becker GA, Jahn M, Maier G, Bares R, Becker HD. Blood flow measurements with 15OH2O and 18F-fluoride ion PET in porcine vertebrae. J Bone Miner Res 1998;13:1328-36. [Crossref] [PubMed]
- Siddique M, Frost ML, Blake GM, Moore AE, Al-Beyatti Y, Marsden PK, Schleyer PJ, Fogelman I. The precision and sensitivity of 18F-fluoride PET for measuring regional bone metabolism: a comparison of quantification methods. J Nucl Med 2011;52:1748-55. [Crossref] [PubMed]
- Blake GM, Siddique M, Frost ML, Moore AE, Fogelman I. Radionuclide studies of bone metabolism: Do bone uptake and bone plasma clearance provide equivalent measurements of bone turnover? Bone 2011;49:537-42. [Crossref] [PubMed]
- Blake GM, Zivanovic MA, McEwan AJ, Ackery DM. 89Sr therapy: strontium kinetics in disseminated carcinoma of the prostate. Eur J Nucl Med 1986;12:447-54. [Crossref] [PubMed]
- Gnanasegaran G, Moore AE, Blake GM, Vijayanathan S, Clarke SE, Fogelman I. Atypical Paget’s disease with quantitative assessment of tracer kinetics. Clin Nucl Med 2007;32:765-9. [Crossref] [PubMed]
- Holden JE, Doudet D, Endres CJ, Chan GL, Morrison KS, Vingerhoets FJ, Snow BJ, Pate BD, Sossi V, Buckley KR, Ruth TJ. Graphical analysis of 6-fluoro-L-dopa trapping: effect of inhibition of catechol-O-methyltransferase. J Nucl Med 1997;38:1568-74. [PubMed]

