
The measurement of liver fat from single-energy quantitative computed tomography scans
Introduction
Computed tomography (CT) scanners measure tissue density in Hounsfield units (HU) on a scale that sets water (H2O) at zero and air at –1,000, independent of the spectral distribution of X-rays (1). For body tissues HU measurements vary not only with density and composition (fat, lean, mineral content) but also the peak kilovoltage (kVp), X-ray filtration, and how the spectrum is modified by differences in body thickness (beam hardening) (2). In quantitative CT (QCT) the HU measurements are converted into tissue densities by scanning the subject together with a phantom containing standards representing known densities of bone and soft tissue (3). In these standards bone mineral is often represented by dipotassium hydrogen phosphate (K2HPO4) and proprietary software for analysing QCT scans is primarily designed to measure bone mineral density (BMD).
Dual-energy X-ray absorptiometry (DXA) is a widely used alternative method of measuring BMD (4) that has also been developed to measure body composition (5,6). In contrast with DXA, many studies using CT scans to measure body fat have been semi-quantitative and based on measurements of HU that were not calibrated with a QCT phantom (7-11). A limitation of such measurements is that the results may vary with the make and model of CT scanner as well as on kVp, filtration and beam hardening.
The aim of the present study was to establish the H2O and K2HPO4 basis set equivalent densities of fat and fat-free liver tissue (12). Combining this information with scan calibration data derived using commercial BMD software (QCT Pro, Mindways, Austin, TX, USA), we used HU measurements made with single-energy QCT (SEQCT) scans to measure fat content in the human liver and developed a method designed to give accurate and consistent results from any CT scanner. The method was applied to abdominal CT scans in 541 Chinese subjects enrolled in the Prospective Urban Rural Epidemiology (PURE) Study (13) to measure the distribution of values of liver fat content in a large healthy human population.
Methods
Measurement of fat content from a SEQCT scan
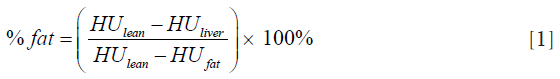
Fat content in the liver was derived from single-energy HU measurements made from 120 kVp QCT scans of the liver (HUliver) by using scan calibration data from a QCT phantom (Mindways, Austin, TX, USA) to estimate HU values for 100% fat (HUfat) and lean liver tissue with 0% fat (HUlean). The SEQCT derived % fat content of the liver was calculated from the following equation:
The values of HUfat and HUlean were found by representing fat and lean tissue in terms of their basis set equivalent densities of H2O and K2HPO4 and adjusting for changes in kVp and beam hardening using scan calibration data obtained from the QCT Pro software. We write the equivalent densities of fat and lean liver tissue as [Afat(H2O), Bfat(K2HPO4)] and (Alean(H2O), Blean(K2HPO4)] respectively, where Afat(H2O) and Alean(H2O) are the densities of the H2O component for fat and lean, and Bfat(K2HPO4) and Blean(K2HPO4) the densities of the K2HPO4 component, both in units of mg/cm3. The HU values for fat and lean tissue are related to their respective equivalent densities by the following linear equations:
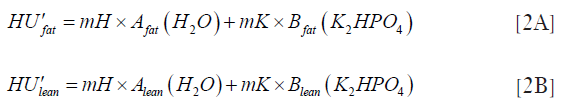
where HU’ = HU + 1000 and mH and mK are scaling factors (units HU mg−1 cm3) for the H2O and K2HPO4 basis set densities. Given that the density of water is close to 1,000 mg/cm3 and the fundamental definition of HU in terms of X-ray attenuation by air and water, then the value of mH is close to 1.0 independent of changes in kVp or beam hardening and for present purposes we assume it is exactly unity. However, the value of mK varies with changes in the X-ray spectrum and can be determined from the BMD calibration slope derived from the BMD steps in the QCT phantom:

where 0.2174 HU·mg-1·cm3 reflects the amount of water displaced when adding K2HPO4 to a given volume of water in such a manner that the original sample volume is maintained. It follows from Eq. [2A,2B] that values of HUfat and HUlean in individual patients can be calculated provided the BMD calibration slope is measured and we know the equivalent densities of fat and lean liver tissue in terms of H2O and K2HPO4. We now examine the issue of establishing the correct equivalent densities.
Basis set densities for fat
In a review of standards for DXA measurements of body composition, Nord and Payne (14) recommended a choice of fat standard based on the chemical composition of animal fat published by Noller (Table 1) (15). Establishing the equivalent densities of H2O and K2HPO4 requires knowledge of the elemental composition of fat in terms of the percentage of carbon, hydrogen and oxygen by weight. Our calculation is set out in Table 1 and, based on these data and the densities of the constituent fatty acids listed in Table 1, one of the authors (JKB) used typical spectral data for CT scanners and Mindways proprietary software to derive the basis set densities for fat.

Full table
Basis set densities for lean liver tissue
To investigate the basis set densities for lean liver tissue a dual-energy QCT (DEQCT) study was performed in 14 healthy subjects (5 females, 9 males) (mean age 65 years; range, 39–79 years) at the General Hospital of the China National Petroleum Corporation, Jilin City, Jilin Province, China. The study was approved by the ethics committee and all the subjects gave written informed consent. DEQCT scans of the liver were performed at 80 and 120 kVp using a GE Healthcare BrightSpeed CT scanner with a Mindways calibration phantom. Tube current was 250 mA and slice thickness 1 mm. QCT quantification of liver tissue was performed using QCT Pro 3D spine module software version 4.2. The slice where the right branch of the portal vein enters the liver was chosen for the measurement. Three circular regions of interest (ROI) with cross-sectional areas of approximately 200 mm2 were placed in the left lobe and the anterior and posterior segments of the right lobe respectively (Figure 1). The ROIs were placed in the subcapsular region of the liver avoiding the bile duct and blood vessels. If the left lobe of liver was too small to be visible in this slice, the slice in which the left lobe had the largest area was used for its measurement.

The HU values obtained at 80 and 120 kVp are related to the basis set densities of the liver tissue by the matrix equation:
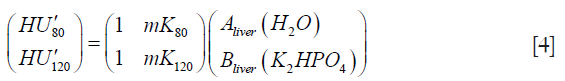
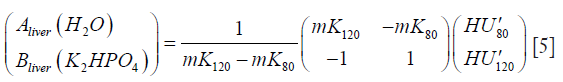
where HU’ = HU + 1,000, mK80 and mK120 are the scan calibration factors at 80 and 120 kVp respectively {Eq. [3]}, Aliver(H2O) and Bliver(K2HPO4) are the equivalent densities of H2O and K2HPO4 in units of HU·mg–1·cm3 for the sample of liver tissue being measured, and as previously we set the scaling factor mH for the H2O equivalent density to exactly 1.0. Inverting the 2×2 matrix in Eq. [4] enables the HU values measured at 80 and 120 kVp to be used to calculate the basis set densities of liver tissue in the three ROIs measured in each of the 14 subjects:
The major and minor axes of the scatter plots of the DEQCT study data in its two alternative representations (as HU or equivalent densities) were found by solving the 2×2 matrix  and
and  its inverse for their eigenvectors and eigenvalues (16) after substituting values of mK at 80 and 120 kVp found from the mean BMD calibration slopes in the 14 subjects enrolled in the study. A scatter plot was drawn of the equivalent densities measured in the DEQCT study subjects from which the basis set densities of fat-free liver tissue were inferred. The basis set densities for fat and fat-free liver tissue were added to the scatter plot to establish a straight line defining the 0 to 100% fat axis. Individual values of liver fat in the DEQCT study population were then calculated by projecting their data points onto the fat axis along the major-axis eigenvector for the 2×2 matrix in Eq. [5].
SEQCT measurements in Prospective Urban Rural Epidemiology (PURE) study subjects
The basis set densities of fat and fat-free liver tissue found from the Noller data and the Jilin City study were used to derive liver fat content in 541 healthy subjects (mean, 62 years; range, 31–95 years) who had abdominal SEQCT scans at the Shenyang No. 4 People’s Hospital, Shenyang City, Liaoning Province, China. The subjects were enrolled and scanned as part of the PURE Study, an international study of 140,000 participants from 25 countries, of whom more than 40,000 were recruited in China (13,17). The study was approved by the ethics committee and all the subjects gave written informed consent. SEQCT scans of the liver were performed at 120 kVp using a GE Healthcare LightSpeed 16-slice CT scanner with a Mindways calibration phantom. Tube current was 250 mA and slice thickness 1 mm. Details of the scan analysis and size and placement of the three liver ROIs were the same as those described above for the Jilin City study (Figure 1). The fat content in each ROI was found using Eq. [1] with values of HUfat and HUlean calculated using Eqs. [2,3] and the basis set densities of fat and lean liver tissue. The % fat values from the three ROIs in each subject were averaged and the results plotted as a histogram and described by their median, interquartile range and range. Six months after the above analysis a random sample of 20 scans were subject to a blind reanalysis and Bland-Altman plots (18) drawn to establish the intra-rater reliability of the % fat measurements.
Single-energy analysis of DEQCT study subjects
SEQCT estimates of liver fat content at 80 and 120 kVp for the 14 subjects in the Jilin City study were calculated using Equation 1 and Bland-Altman plots drawn to compare the results with the values obtained in the DEQCT analysis. The differences were expressed in terms of the mean and 95% limits of agreement.
Results
Our calculation of the elemental chemical composition of fat is set out in Table 1 and resulted in an estimate that 100 g of fat contains 76.0 g of carbon, 12.3 g of hydrogen and 11.7 g of oxygen. Based on the physical densities of the constituent fatty acids listed in Table 1 we calculated a density for fat of 0.89 g/cm3. Using these data we derived basis set densities for fat of 941.75 mg/cm3 H2O and –43.72 mg/cm3 K2HPO4 (Table 2).

Full table
Figure 2 plots the equivalent densities for each ROI for each subject in the Jilin City DEQCT study calculated using Eq. [5]. Each subject is shown in a different color and the results for the ROIs in the right-superior, right-inferior and left lobes are joined by a straight line found from linear regression analysis. On the assumption that liver fat in each subject is the same in all three ROIs (19), the regression lines plotted in Figure 2 indicate the orientation of the lines of constant % fat in the equivalent density plot. The direction vector determined by the mean orientation for all 14 subjects is (0.864, –0.504), corresponding to an angle of –30.3° to the horizontal axis.


Full table
Table 3 gives the solutions for the eigenvectors and eigenvalues of the 2×2 matrices in Eqs. [4,5]. In the equivalent densities plot shown in Figure 2 the first of the two eigenvectors (eigenvector 1) listed in Table 3 (0.859, –0.513) is represented by a straight line at an angle of –30.8° to the horizontal. In this representation of the DEQCT study data eigenvector 1 has the larger eigenvalue (Table 3) and is the major-axis eigenvector. Eigenvector 1 lies in the direction of maximum variance of the data points in Figure 2 and is parallel to the lines of constant % fat in the scatter plot. Also plotted in Figure 2 are the lines of constant HU at 80 and 120 kVp calculated using Eq. [5]. The lines of constant HU have direction vectors (0.891, –0.454) (–27.0°) at 80 kVp and (0.833, –0.554) (–33.6°) at 120 kVp and define the lines of constant % fat measurement for SEQCT scans at their respective kVp.
Figure 3A plots the data from Figure 2 after taking the average of the equivalent densities for the three ROIs measured in each subject. The cross at (1,034.27, 17.46) is the centroid of the distribution marking the overall mean for the 14 subjects, while the red line shows the major-axis eigenvector drawn through the centroid. Figure 3B shows the same data plotted in the alternative Hounsfield units representation. In this representation the major axis is defined by eigenvector 2 at an angle of 40.5° (Table 3) and is a line along which the % fat content varies from a minimum value at the top right in Figure 3B to a maximum value at the lower left.

Figure 4A shows the same averaged data for the 14 subjects plotted in Figure 3A with a green cross marking the equivalent densities for 100% fat listed in Table 2. The line joining the green cross representing 100% fat and the red cross marking the centroid of the basis set values in the 14 subjects defines an axis on which liver fat can be measured by projecting each subject’s point on to the % fat axis in a direction parallel to eigenvector 1.

It remains to define the point in the equivalent densities plot representing fat-free liver tissue. This was found by projecting the % fat axis beyond the red cross on to a point marked by a black cross that shows the intersection with a line drawn parallel to eigenvector 1 through the subject with the least liver fat content. On the assumption that this subject has 0% liver fat the black line marks the line of 0% fat values. The black cross at the point (1,040.13, 21.34) was adopted as the basis set standard for fat-free liver tissue (Table 2).
Figure 4B shows the same data as Figure 4A plotted in the alternative Hounsfield units representation. The 0% and 100% fat points in Figure 4A have been transformed using Eq. 4 and plotted in Figure 4B and the line of eigenvector 2 has been extended to show its orientation with respect to the % fat axis.
Figure 5A shows the measurements of liver fat in the 14 subjects in the Jilin City DEQCT study after projecting their data points in Figure 4A onto the 0 to 100% fat axis along lines parallel to eigenvector 1. Individual values of liver fat content varied from 0 to 17.9% with a median of 4.5% and interquartile range 3.0 to 7.9%. Figure 5B shows the SEQCT estimates of liver fat for the 541 PURE study subjects at the Shenyang No. 4 People’s Hospital. Values of liver fat content varied from –0.3–29.9% with a median of 4.9% and an interquartile range 3.4–6.9%.

Figure 6A shows the Bland-Altman plot comparing the original and repeat estimates of liver fat in the 20 subjects from Shenyang City in the intra-rater reliability study. The mean difference was negligibly different from zero and the 95% limits of agreement were ±1.8%. Figure 6B,C compare the SEQCT estimates of liver fat for the 14 Jilin City subjects at 80 and 120 kVp with the DEQCT values plotted in Figure 5A. The mean differences were negligibly different from zero and the 95% limits of agreement were ±2.3% at 80 kVp and ±1.6% at 120 kVp.

Discussion
Following the convention in body composition studies, 100% fat refers to pure fat and not adipose tissue, which contains water and cells and is variable in composition (20). Following the discussion by Nord & Payne of standards for body composition studies in DXA (14), we based our standard for 100% fat on Noller’s tabulation of the composition of animal fat (Table 1) (15). The resulting elemental composition summarised in Table 1 is in good agreement with the composition of lipids set out in ICRU Report 46 (77.3% C, 11.8% H, 10.9% O) (21). Based on the principle of basis set decomposition, any tissue can be resolved into a mixture of two basis materials that reproduces the linear attenuation coefficient over a wide range of X-ray energies (12). For QCT studies it is convenient to choose H2O and K2HPO4 as the basis materials, and for the composition of fat set out in Table 1 we obtained equivalent densities of 941.75 mg/cm3 H2O and –43.72 mg/cm3 K2HPO4. When transformed into HU values at 80 and 120 kVp, the 100% fat point falls close to the line defining eigenvector 2 in Figure 4B, which could be regarded as an alternative empirical definition of the fat axis in this figure.
For healthy adult liver tissue we first considered adopting the composition listed in ICRU Report 46 (21) as our choice of standard for fat-free tissue, for which we derived equivalent densities of 1,047.9 mg/cm3 H2O and 4.84 mg/cm3 K2HPO4. However, when used in Eq. [1] this choice led to a large percentage of subjects having negative % fat values, and for this reason the DEQCT study was undertaken to gain a better understanding of the equivalent densities of lean liver tissue in healthy human subjects. When plotted in Figure 4A, the ICRU healthy adult liver composition gave a fat content of 9.6% and laid at the edge of the range of equivalent densities found for the Jilin City subjects.
The observation in Figure 2 that the data points from the DEQCT study are spread along an axis from upper left to lower right at an angle of approximately –30° to the horizontal axis is due to the precision errors in the HU measurements after their transformation into equivalent densities using Eq. [5]. In Figure 2 the lines of constant HU at 80 and 120 kVp make angles to the horizontal of –27.0° and –33.6° respectively. Because of the small angle between these lines, when DEQCT HU measurements are transformed into equivalent densities there is relatively poor discrimination for determining the precise location of data points in the direction parallel to the –30° axis compared with the direction at right angles to it. In a study using mDixon magnetic resonance (MR) imaging to measure fat content in five liver segments in 80 healthy volunteers, Ulbrich et al. reported that there were no statistically significant differences in fat content between different segments (19). On the assumption that the three ROIs measured in each subject in the present study have the same fat content the linear regression lines joining each set of three points in Figure 2 are (within measurement errors) orientated along lines of constant % fat.
We considered three alternative choices for defining lines of constant % fat in the equivalent densities plot: (I) an empirical definition based on taking the mean angle of the linear regression lines for the 14 subjects plotted in Figure 2 (–30.3°); (II) the mean angle of the lines of constant HU at 80 and 120 kVp in Figure 2 (also –30.3°); (3) the major-axis eigenvector for the 2×2 matrix in Eq. [5] (–30.8°; Table 3). This latter lies in the direction of maximum variance of the data points in Figure 2 and, on the assumption that the precision errors follow a bivariate Gaussian model, can be shown to define the orientation of the lines of constant % fat. When used to project the individual subject data points in Figure 4A on to the 0 to 100% fat axis there is little practical difference between these three choices and we choose the eigenvector as our preferred method.
When we compared SEQCT values of liver fat content for the 14 Jilin City subjects with their DEQCT results we found 95% limits of agreement of ±2.3% for the 80 kVp HU measurements and ±1.6% for the 120 kVp data. The SEQCT and DEQCT results differ because in Figure 4A the former correspond to the results obtained by projecting the data points onto the fat axis along the lines of constant HU shown in Figure 2 instead of along eigenvector 1. For subjects whose DEQCT results happen to fall on the fat axis in Figure 4A there is no difference between the SEQCT and DEQCT % fats. For points away from the fat axis the SEQCT results will be biased relative to projection along eigenvector 1 with the direction of bias dependent on whether the point is above or below the axis and which line of constant HU is used.
We note that because Hounsfield units are a measure of the linear X-ray attenuation coefficient rather than the mass coefficient, % fat results calculated using Eq. [1] are averaged by tissue volume rather than by mass as measured by techniques such as DXA (5,6) and MR imaging (22). The biggest difference between the two density measures is for a fat content of 50%. Assuming a fat density of 0.89 g/cm3 and a lean tissue density of 1.06 g/cm3 (21), 50% fat by volume corresponds to 45.6% by mass. At the extremes of 0% and 100% fat the difference tapers off to zero and for % fat contents by volume of 5%, 10% and 20% typical of the results in Figure 5 the corresponding % fat contents by mass are 4.2%, 8.5% and 17.3% respectively. The results in Figure 5 have not been adjusted for this difference, but given the densities of fat and lean tissue the correction is easily made.
Reliable non-invasive methods of measuring fat content in the liver are important for the diagnosis and management of non-alcoholic fatty liver disease (NAFLD), a disorder characterised by the accumulation of extra fat in the liver and associated with risk factors such as obesity, diabetes and dyslipidemia (23,24). NAFLD is the most prevalent type of chronic liver disease in the developed world with a worldwide prevalence ranging from 13% to 28% (25,26). While it is normal for the liver in healthy subjects to contain some fat (19,27,28), a fat content more than 5% of liver mass is classified as steatosis (28,29). Methods of investigation and diagnosis include liver biopsy (30,31), ultrasonography (22,32), CT imaging (22,32) and MR imaging, including proton magnetic resonance spectroscopy (1H-MRS) (27,28) and the modified Dixon (mDixon) technique (29). Of these, the MR methods are widely accepted as the most sensitive non-invasive method to assess hepatic steatosis (33,34). However, the CT methods with which they have been compared have been semi-quantitative methods based on Hounsfield units, or the difference in attenuation between the liver and spleen (7-11), and as such not subject to rigorous calibration and quality control and dependent on factors such as kVp, X-ray filtration, patient size, and the make and model of CT scanner. The measurement of liver fat using QCT with a properly calibrated clinical CT scanner has not previously been described. Although MR is the preferred method of measuring liver fat because of the absence of ionizing radiation, the QCT method described here may have a role in providing additional value to diagnostic CT scans by making a liver fat measurement possible in patients having scans performed for other reasons, similar to the way a CT scan for other purposes can provide additional information about BMD and abdominal adipose tissue.
This study has a number of limitations. Only 14 subjects were enrolled in the DEQCT study and this limited the accuracy with which the centroid of the data points in the equivalent densities scatter plot (Figure 3A) could be determined, and hence the determination of the 0 to 100% fat axis in Figure 4A. More important, the zero point of the % fat scale was defined on the assumption that the DEQCT study subject with the lowest liver fat content had a fat value of 0% (Figure 5A) and, given the small number of subjects in the DEQCT study, the true zero point must be uncertain. However, in a similar small study of 10 healthy subjects using the 1H-MRS method Irwan et al. reported individual % fat values between 0.9% and 21.3% (27), in a study of 80 healthy subjects using the mDixon MR method, Ulbrich et al. found values between 1.8% and 10.1% (19), and in a study of 73 living related liver donors using the 1H-MRS method Rastogi et al. found values between 0 and 31.5% (28). Hence any error in the zero point of the % fat scale in the present study is unlikely to be more than 1% or 2%. The reliability of the zero point of our fat scale was further explored by examining the distribution of liver fat values in a large group (n=541) of healthy subjects who had 120 kVp QCT scans. In these subjects the median fat content was 4.9% with an interquartile range from 3.4% to 6.9%, results consistent with previous MR studies in healthy subjects (19,27,28).
In conclusion, we have reported basis set equivalent densities for fat and fat-free liver tissue which, when combined with calibration information from a QCT phantom, enable accurate measurements of liver fat from a single-energy scan performed on any CT scanner. In a large healthy elderly population the method gave fat results consistent with findings from liver biopsy and MR measurements in other studies. Although radiation dose considerations preclude the routine use of QCT to measure liver fat, the method described here facilitates its measurement in patients having CT scans performed for other purposes. Further studies comparing SEQCT measurements of liver fat content with MR measurements are required to validate the present findings.
Acknowledgements
X Cheng acknowledges financial support from the Beijing Bureau of Health 215 program (grant number: 2009-2-03) and from the Capital Characteristic Clinic Project (grant number: 2014-2-1122).
Footnote
Conflicts of Interest: JK Brown is a stockholder and employee of Mindways Software, Inc. The other authors have no conflicts of interest to declare.
Ethical Statement: The study was approved by the Research Ethics Committee of Beijing Jishuitan Hospital (201512-02) and written informed consent was obtained from all subjects.
References
- Hounsfield GN. Computed medical imaging. Science 1980;210:22-8. [Crossref] [PubMed]
- Weissberger MA, Zamenhof RG, Aronow S, Neer RM. Computed tomography scanning for the measurement of bone mineral in the human spine. J Comput Assist Tomogr 1978;2:253-62. [Crossref] [PubMed]
- Cann CE, Genant HK. Precise measurement of vertebral mineral content using computed tomography. J Comput Assist Tomogr 1980;4:493-500. [Crossref] [PubMed]
- Wahner HW, Dunn WL, Brown ML, Morin RL, Riggs BL. Comparison of dual-energy x-ray absorptiometry and dual photon absorptiometry for bone mineral measurements of the lumbar spine. Mayo Clin Proc 1988;63:1075-84. [Crossref] [PubMed]
- Mazess RB, Barden HS, Bisek JP, Hanson J. Dual-energy x-ray absorptiometry for total-body and regional bone-mineral and soft-tissue composition. Am J Clin Nutr 1990;51:1106-12. [PubMed]
- Nord RH, Payne RK. Body composition by dual-energy X-ray absorptiometry-a review of the technology. Asia Pac J Clin Nutr 1995;4:167-71. [PubMed]
- Piekarski J, Goldberg HI, Royal SA, Axel L, Moss AA. Difference between liver and spleen CT numbers in the normal adult: its usefulness in predicting the presence of diffuse liver disease. Radiology 1980;137:727-9. [Crossref] [PubMed]
- Davidson LE, Kuk JL, Church TS, Ross R. Protocol for measurement of liver fat by computed tomography. J Appl Physiol 2006;100:864-8. [Crossref] [PubMed]
- Shores NJ, Link K, Fernandez A, Geisinger KR, Davis M, Nguyen T, Sawyer J, Rudel L. Non-contrasted computed tomography for the accurate measurement of liver steatosis in obese patients. Dig Dis Sci 2011;56:2145-51. [Crossref] [PubMed]
- Zeb I, Li D, Nasir K, Katz R, Larijani VN, Budoff MJ. Computed tomography scans in the evaluation of fatty liver disease in a population based study: the multi-ethnic study of atherosclerosis. Acad Radiol 2012;19:811-8. [Crossref] [PubMed]
- Hahn L, Reeder SB, Muñoz del Rio A, Pickhardt PJ. Longitudinal Changes in Liver Fat Content in Asymptomatic Adults: Hepatic Attenuation on Unenhanced CT as an Imaging Biomarker for Steatosis. AJR Am J Roentgenol 2015;205:1167-72. [Crossref] [PubMed]
- Lehmann LA, Alvarez RE, Macovski A, Brody WR, Pelc NJ, Riederer SJ, Hall AL. Generalized image combinations in dual KVP digital radiography. Med Phys 1981;8:659-67. [Crossref] [PubMed]
- PURE (Prospective Urban and Rural Epidemiological Study). Population Health Research Institute, McMaster University, Hamilton, Ontario, Canada, 2017. Available online: http://www.phri.ca/pure/. Accessed May 25, 2017.
- Nord RH, Payne RK. Standards for body composition calibration in DEXA. In: Ring EF. editor. Current Research in Osteoporosis and Bone Mineral Measurement. London, UK: British Institute of Radiology; 1990, pp27-8.
- Noller CR. Chemistry of Organic Compounds, 2nd Edition. Philadelphia, PA: W B Saunders, 1957: 181.
- Cullen CG. Matrices and Linear Transformations, 2nd edition. Reading, MA: Addison-Wesley, 1972: 144.
- Peng Y, Li W, Wang Y, Bo J, Chen H. The Cut-Off Point and Boundary Values of Waist-to-Height Ratio as an Indicator for Cardiovascular Risk Factors in Chinese Adults from the PURE Study. PLoS One 2015;10:e0144539. [Crossref] [PubMed]
- Bland JM, Altman DG. Statistical methods for assessing agreement between two methods of clinical measurement. Lancet 1986;1:307-10. [Crossref] [PubMed]
- Ulbrich EJ, Fischer MA, Manoliu A, Marcon M, Luechinger R, Nanz D, Reiner CS. Age- and Gender Dependent Liver Fat Content in a Healthy Normal BMI Population as Quantified by Fat-Water Separating DIXON MR Imaging. PLoS One 2015;10:e0141691. [Crossref] [PubMed]
- Tothill P, Weir N, Loveland J. Errors in dual-energy X-ray scanning of the hip because of nonuniform fat distribution. J Clin Densitom 2014;17:91-6. [Crossref] [PubMed]
- ICRU Report 46. Photon, Electron, Proton and Neutron Interaction Data for Body Tissues. Bethesda: International Commission on Radiation Units and Measurements, 1992: Appendix A, pp 11-3.
- Lee SS, Park SH. Radiologic evaluation of nonalcoholic fatty liver disease. World J Gastroenterol 2014;20:7392-402. [Crossref] [PubMed]
- Milić S, Lulić D, Štimac D. Non-alcoholic fatty liver disease and obesity: biochemical, metabolic and clinical presentations. World J Gastroenterol 2014;20:9330-7. [PubMed]
- Katsiki N, Mikhailidis DP, Mantzoros CS. Non-alcoholic fatty liver disease and dyslipidemia: an update. Metabolism. 2016;65:1109-23. [Crossref] [PubMed]
- Zhu JZ, Dai YN, Wang YM, Zhou QY, Yu CH, Li YM. Prevalence of Nonalcoholic Fatty Liver Disease and Economy. Dig Dis Sci 2015;60:3194-202. [Crossref] [PubMed]
- Zhu JZ, Zhou QY, Wang YM, Dai YN, Zhu J, Yu CH, Li YM. Prevalence of fatty liver disease and the economy in China: a systematic review. World J Gastroenterol 2015;21:5695-706. [Crossref] [PubMed]
- Irwan R, Edens MA, Sijens PE. Assessment of the variations in fat content in normal liver using a fast MR imaging method in comparison with results obtained by spectroscopic imaging. Eur Radiol 2008;18:806-13. [Crossref] [PubMed]
- Rastogi R, Gupta S, Garg B, Vohra S, Wadhawan M, Rastogi H. Comparative accuracy of CT, dual-echo MRI and MR spectroscopy for preoperative liver fat quantification in living related liver donors. Indian J Radiol Imaging 2016;26:5-14. [Crossref] [PubMed]
- Kukuk GM, Hittatiya K, Sprinkart AM, Eggers H, Gieseke J, Block W, Moeller P, Willinek WA, Spengler U, Trebicka J, Fischer HP, Schild HH, Träber F. Comparison between modified Dixon MRI techniques, MR spectroscopic relaxometry, and different histologic quantification methods in the assessment of hepatic steatosis. Eur Radiol 2015;25:2869-79. [Crossref] [PubMed]
- Chalasani N, Younossi Z, Lavine JE, Diehl AM, Brunt EM, Cusi K, Charlton M, Sanyal AJ. The diagnosis and management of non-alcoholic fatty liver disease: practice Guideline by the American Association for the Study of Liver Diseases, American College of Gastroenterology, and the American Gastroenterological Association. Hepatology 2012;55:2005-23. [Crossref] [PubMed]
- St Pierre TG, House MJ, Bangma SJ, Pang W, Bathgate A, Gan EK, Ayonrinde OT, Bhathal PS, Clouston A, Olynyk JK, Adams LA. Stereological Analysis of Liver Biopsy Histology Sections as a Reference Standard for Validating Non-Invasive Liver Fat Fraction Measurements by MRI. PLoS One 2016;11:e0160789. [Crossref] [PubMed]
- Stern C, Castera L. Non-invasive diagnosis of hepatic steatosis. Hepatol Int 2017;11:70-8. [Crossref] [PubMed]
- Bohte AE, van Werven JR, Bipat S, Stoker J. The diagnostic accuracy of US, CT, MRI and 1H-MRS for the evaluation of hepatic steatosis compared with liver biopsy: a meta-analysis. Eur Radiol 2011;21:87-97. [Crossref] [PubMed]
- Kramer H, Pickhardt PJ, Kliewer MA, Hernando D, Chen GH, Zagzebski JA, Reeder SB. Accuracy of Liver Fat Quantification With Advanced CT, MRI, and Ultrasound Techniques: Prospective Comparison With MR Spectroscopy. AJR Am J Roentgenol 2017;208:92-100. [Crossref] [PubMed]

