
A quantitative framework for the analysis of multimodal optical microscopy images
Introduction
Multimodal optical microscopy is a collective set of imaging techniques well suited for high resolution, depth resolved, deep tissue imaging. In biological imaging, structural, functional, and molecular information regarding the specimen of interest can be obtained in a wide variety of settings including study of in vitro cell cultures (1), ex vivo tissue samples (2,3), or even in vivo (intravital) imaging (4-6). While multimodal optical microscopy continues to grow in popularity for characterizing complex biological systems and organisms, interpretation of the generated dense high-dimensional data can be difficult and highly subjective. In many cases, imaging modalities in a multimodal system are considered to provide complementary information, allowing multiple properties of the sample to be probed simultaneously. However, a quantitative understanding of the relationship carried between various modalities remains to be understood generally or utilized to better understand the subtle properties of biological specimens.
Multimodal optical microscopy encompasses many imaging modalities often combined into an integrated system capable of simultaneously acquiring data from multiple contrast sources that are inherently co-registered both spatially and temporally. Imaging techniques employed often vary, but can include techniques such as optical coherence microscopy (OCM) to probe the structural form of the specimen obtained from scattered light measurements (7), two-photon excitation fluorescence (TPEF) microscopy to identify endogenous or exogenous fluorophores in the specimen (8), fluorescence lifetime imaging microscopy (FLIM) to provide metabolic and functional contrast when imaging certain endogenous molecules such as nicotinamide adenine dinucleotide (NADH) (9), and second harmonic generation (SHG) microscopy to visualize connective structures of the specimen such as collagen and elastin fibers (10). In addition to these, many other optical imaging modalities have been established including Raman scattering-based techniques (11,12) and higher order nonlinear fluorescence (13,14) and harmonic generation techniques (15). Multimodal imaging systems incorporating many of these techniques have been developed for a wide variety of applications including investigation of wound healing (6), adverse effects of topical pharmaceuticals (5), identification of cancer and tumor markers (16), and the identification of cell death modes (3). However, the analysis of data generated from these systems has been primarily qualitative and analysis is often performed on each individual modality, not directly taking into account the complex relationships and correlations between imaging modalities and the valuable information that can be provided.
Quantitative imaging techniques are typically utilized as methods that take raw image data and, through prior knowledge of the underlying physical processes, extract quantitative features that represent important physical information (17). Biological examples of these techniques can be found in characterizing chromatin distributions in cell nuclei (18) or in measuring the shapes and sizes of cell nuclei for cancer diagnostics (19). Today, as these techniques have developed and become more broadly used, quantitative microscopy techniques are utilized for advanced, high throughput screening for studies such as location proteomics (20).
As an example, the field of digital histopathology has been combined with highly accurate automated classification techniques to allow diagnostic and potentially prognostic information to be obtained with high accuracy in order to assist the practicing pathologist (21). One particularly exciting example of work in this area was performed for breast cancer diagnostics, in which structural information obtained from quantitative histopathologic image biomarkers were combined with traditional genomic data analysis to train a highly accurate predictor of breast cancer survival (22). However, these techniques often require the use of stains or dyes and must be performed on thin tissue sections, restricting translation to in vivo imaging. Advances in spectroscopic infrared imaging have also paved the way for obtaining diagnostic and prognostic information directly from spectroscopic measurements of unstained histology samples (23). Spectroscopic imaging thus is not biased by staining levels that tend to vary depending on the laboratory performing the staining (24). However, digital histopathology and absorption-based spectroscopic methods are typically limited to very thin tissue sections on the order of microns and tend to require very long acquisition times, limiting translation to noninvasive in vivo imaging scenarios. Identifying robust image biomarkers using deep tissue optical microscopy methods may prove to be an advantageous method for clinically relevant identification and characterization of biological state of the natural cell and tissue microenvironment.
In this study, a set of methods for quantifying the intermodality contrast in multimodal optical microscopy datasets in a variety of settings is presented. This framework is then applied to the problems of automated identification of cell death modes and anatomical or disease state identification in unstained tissue slices. In both cases, results show highly accurate identification of biological processes obtained from analysis of these dense datasets acquired from multiple contrast sources that are co-registered both spatially and temporally.
Methods
Multimodal optical microscope
A custom-built multimodal optical microscope capable of OCM, TPEF, SHG, and FLIM imaging described previously (25) was used in this study. This combination of modalities provides both structural and functional information regarding the tissue microenvironment with subcellular level resolution. Excitation light was provided by a titanium:sapphire laser (MaiTai HP, Spectra Physics) centered at a wavelength of 730 nm, which was focused onto the sample of interest using a 0.95 numerical aperture (NA) water-immersion objective lens (XLUMP20X, Olympus). The optical power at the focus was less than 7 mW. The focused beam was raster scanned across the sample using a pair of computer-controlled galvanometer mirrors (Micromax 671, Cambridge Technology) to construct an image. Detection of fluorescence and SHG light was performed using a 16 channel photomultiplier tube (PMT) spectrometer (PML-16-C, Becker-Hickl) centered at 450 nm and operating in photon counting mode. This spectral detection scheme allows isolation of the fluorescence and SHG light as well as observation of spectral changes in the fluorescence light due to fluorophore or environmental perturbations. The OCM signal was detected using a custom-built spectrometer with a CCD line-scan camera (Dalsa P2-22-02K40). In order to obtain fluorescence lifetime curves, time-correlated single photon counting (TCSPC) was performed using a commercial TCSPC data acquisition board (SPC-150, Becker-Hickl) based on the data collected from the 16-channel PMT spectrometer.
Classification of cell death modes
Data obtained from a previous study of cell death modes in living engineered skin samples (3) were analyzed to develop an automated classification system based on the joint image contrast from multiple modalities. Experimental details of the data acquisition were previously published (3). Briefly, three tissue samples were longitudinally imaged with the multimodal microscope described above over a period of up to 18 hours. Three conditions were compared by introducing a specific chemical compound into the culture medium of the tissue model. To induce apoptosis in cells, a mixture of 20 µM camptothecin and 50 µM etoposide was used (both from BioVision, Mountain View, CA, USA). To induce necrosis, 5% peroxide bleach was used. Finally, the induced cell death modes were compared to a control tissue sample which was left untreated. For experiments described here, data were compared at approximately 3 hours post-treatment.
Data from the PMT spectrometer was binned over the spectrum of NADH in order to increase the signal-to-noise ratio (SNR) allowing a more accurate measure of the fluorescence lifetime at each pixel. The fluorescence lifetime was determined at each pixel through the use of SPCImage (Becker & Hickl). The TPEF intensity image was determined by performing a summation over the entire decay curve of each pixel in the image to find the total number of fluorescent photons received from each spatial location. Structural data provided by OCM were processed online using standard methods to provide scattering maps of samples (26).
Figure 1 shows the basic processing pipeline for the automatic cell death classification system. To begin, images obtained from the procedure described above were segmented using a custom-built CellProfiler (27) pipeline based on a built-in intensity based segmentation algorithm performed on the TPEF intensity images. This step was performed to extract the multimodal features only from cellular regions where information about cell fate was relevant. Next, the multimodal data were organized in such a way that each pixel was represented by a three-dimensional (3D) feature vector consisting of the OCM scattering intensity, the TPEF fluorescence intensity, and the mean fluorescence lifetime. Further analysis and classification was carried out on a pixel-by-pixel basis in MATLAB (MathWorks). From here, the data were partitioned into ten equal sized groups that were used for cross-validation to assess the accuracy of the classification procedure. Classification was performed through the use of support vector machines (SVM), which find the hyperplane that most optimally separated the data in this 3D space (28). Testing of the classification system was performed using 10-fold cross-validation.

Identification of tissue components and disease states
Large field-of-view multimodal datasets were acquired by collecting 100 individual images in a 10×10 mosaic pattern using the previously described multimodal microscope. Samples consisted of 10 µm thick ex vivo fixed tissue slices prepared on glass microscope slides. For these studies, OCM images were not acquired due to the strong reflection from the glass slide. Following imaging with the multimodal microscope, tissue sections were stained with hematoxylin and eosin (H & E) and imaged with a standard brightfield microscope (Zeiss Axiovert 200). Imaging was performed to capture the identical field of view as was imaged with the multimodal microscope on the same tissue slice, allowing a direct comparison with the gold standard typically used for anatomical and diagnostic information in clinical practice.
Unless otherwise noted, all further analysis of tissue slice images was performed in MATLAB. For each image, the four-dimensional (4D) data acquired from the PMT spectrometer was processed by first constructing a fluorescence spectrum at each pixel corresponding to each wavelength channel of the PMT spectrometer. Next, TPEF and SHG intensity images were constructed by performing a summation over the temporal dimension as well as the wavelength channels corresponding to each of these spectrally separated processes (channels 1–4 for SHG, channels 5–16 for TPEF). Finally, fluorescence lifetime was calculated on eight of the individual TPEF channel by fitting the temporal decay curves to a bi-exponential model as is commonly performed in processing fluorescence lifetime data from NADH (29). Each pixel in the 3D dataset can be considered to be a feature vector consisting of 24 features.
Following construction of all individual processed images, image stitching of the multimodal data was performed by using a multiband blending technique (30) along with overlapping image regions to remove mosaicking artifacts due to slight brightness changes across the field of view resulting in a banding structure that appears in the mosaic. Figure 2 shows images of these processed mosaics and the corresponding region in the H & E image of a rat mammary tumor sample.

In order to fully exploit the spatial correlations between the H & E and multimodal mosaics, these datasets were then spatially co-registered using a control point-based registration method as shown in Figure 3. In MATLAB, pairs of corresponding control points were manually selected in both images. These points correspond to physical landmarks present in both datasets that were easily identified. After the successful mapping of 15–30 points in each mosaic, an affine transformation matrix was found that best maps the spatial transformation of these points in a least-squares sense. The affine transformation accounts for any scaling, translation, and rotation that may occur during the staining process, which may slightly alter the tissue, as well as the effects of sample orientation and image magnification. Finally, this transformation was applied to the H & E image, spatially co-registering this known gold standard to the acquired wide field multimodal mosaicked images, allowing a direct comparison of these useful datasets. In the spatially transformed H & E image, regions of interest corresponding to biological features of interest such as disease regions or anatomical regions were manually labeled. This labeling was performed in order to provide a small amount of labeled training data, representing a ground truth. From these labeled points, the goal was to accurately label every pixel in the image and to recover the statistical properties of each anatomical or pathological group of interest. The multimodal signals consisting of the emission spectrum (including both SHG and TPEF signals) as well as the spectrally resolved mean lifetime of the fluorescence for a total of 24 features at each pixel were extracted from these regions and used as training data for a naïve Bayes classifier.

Following co-registration of these datasets, pixel-wise classification was performed on each image using an iterative semi-supervised classification procedure based on a naïve Bayes model. This semi-supervised approach has proven useful in many applications including text classification (31) and rRNA sequencing (32). In the naïve Bayes approach, a generative model is used to explain the observed data. Specifically, it is assumed that each spatial pixel in this high dimensional multimodal image, which will be referred to as a multimodal pixel vector, given its class label, is generated according to a probability distribution described through a parameter vector, θ. In the naïve Bayes model, which is used to greatly simplify the estimation of this generating probability function, it is assumed that all features are mutually independent given the class label. Thus the posterior can be simplified as
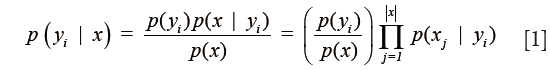
where yi is the class label of pixel i, x is the feature vector and j is an index that tracks each feature or modality. This greatly decreases the number of elements in the parameter vector. In this work, the data were modeled through a multivariate Gaussian distribution in order to simplify the analysis. Due to the naïve Bayes assumption, all non-diagonal terms of the covariance matrix of the multivariate Gaussian distribution function are identically zero. Thus, the model is determined completely through estimation of the mean and variance vectors of each class.
It has been shown that even though the naïve Bayes independence assumption is generally unfounded, leading to errors in probability estimates, generally good classification results can still be obtained in most cases (33). The semi-supervised classification procedure was performed using the expectation-maximization (EM) algorithm similar to the one described in (34). This procedure consisted of two major steps. In the first step, known as the M step, a maximum likelihood estimate of the parameters of a multivariate Gaussian model best explaining the training data was performed. The estimates for the mean and variance of each class are given respectively by
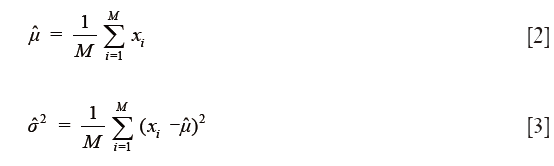
where M is the total number of pixels in the group and the xi are the multimodal pixel vectors. To begin, these estimates were obtained only for the user-selected labeled training data. In the second step, known as the E step, this estimated Gaussian model was used to calculate the posterior probabilities for class membership for both the labeled and unlabeled multimodal pixel vectors in the image. The posterior is given explicitly by
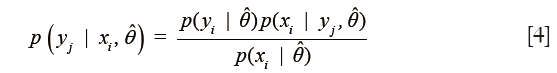
The first term in the numerator is the class prior probabilities and can be estimated using maximum likelihood as
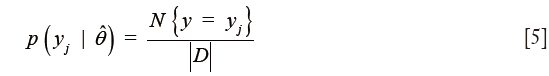
where the numerator denotes the number of elements in class j and the denominator is given by the total number of elements. The second term in the numerator of Eq. [4] is given by
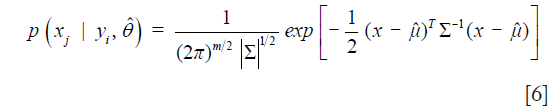
where m is the number of modalities (features) analyzed and ∑ is the covariance matrix with diagonal elements given by Eq. [3]. From these posteriors, each multimodal pixel vector was assigned the label corresponding to the class which maximizes the posterior. That is, the assigned label is given by

After this initial step, the above procedure was iterated with the M step being performed on all pixels instead of just the manually labeled training multimodal pixel vectors.
Results
Cell death identification
In previous studies, induction of cell death has been shown to be associated with changes in the signals acquired from many of the imaging modalities employed here. Although these changes have been shown to be significant, quantification of the accuracy in using this data jointly to automatically classify cell death modes was not performed. While healthy cells are associated with minimal change from baseline values measured before the addition of saline, significant changes to the image contrast were found to occur in both apoptosis and necrosis. In apoptotic cells, as was observed in cell culture studies (34,35), the mean fluorescence lifetime of NADH was found to increase dramatically while there were only minor, non-significant changes in OCM and NADH TPEF intensity contrast. In necrosis, only a decrease in the OCM signal, demonstrating reduced scattering from necrotic cells, was observed as a significant change. Many of these trends have also been demonstrated in mouse skin keratinocytes in vivo (36).
In order to assess the ability to distinguish these modes of cell death quantitatively using these co-registered multimodal data, classification of intracellular multimodal signals was performed as described above. Two-class (apoptosis vs. control; necrosis vs. control) identification was performed to determine the sensitivity, specificity, and accuracy of detection of cells treated to induce cell death when compared to normal or healthy cells by training classifiers using baseline images acquired before treatment, along with images acquired three hours after cell death induction.
Table 1 shows results for identification of apoptotic cells. Each column represents the results of training a classifier on a given individual modality. The final column represents training a classifier on the combined multimodal data. From observations of changes in previously reported data, it is expected that the mean fluorescence lifetime alone should be able to distinguish apoptosis quite well due to the large increase in mean lifetime associated with apoptosis induction. It can be seen from the classifiers trained on the remaining data that both OCM and TPEF intensity add little information in identifying apoptosis as both modalities give very low accuracy results. Ultimately, this leads to minimal improvement when using a combination of the modalities to identify apoptosis as compared to using FLIM measurements alone.

Full table
Table 2 gives results for identification of necrosis. Based on the same data, it is expected that mean fluorescence lifetime will not be nearly as sensitive to the necrotic process as compared to apoptotic cell death and that scattering measured with OCM should have more predictive value in identifying necrosis when compared to apoptosis. Classification results confirm that mean lifetime alone is much less accurate in identifying necrosis. In addition, accuracy of classification based on the OCM modality alone is slightly increased compared to the apoptosis case. Most interesting is the fact that the combination of all modalities quantitatively provides complementary information that is very useful when considered together. Due to this, significant improvement is seen when training classifiers based on all modalities to identify necrotic and apoptotic cells.

Full table
It is very likely that at any time a biological environment consists of a collection of cells, some of which may be functioning normally, while others are undergoing either apoptosis or necrosis. Thus, it is more useful to identify and distinguish between these three cases so that any general microenvironment can be characterized based on the number and process of these cell death events. Results from three-class identification are shown in Figure 4 and Table 3. Here it is seen that generally poor results are obtained when using only individual modalities to classify data. In contrast to this, the use of all modalities to train a classifier to identify distinct multimodal signatures of these cell death processes provides high accuracy improving the accuracy to 83.9%, which is much higher than using any of the individual modalities. Thus, the importance of a multimodal approach to the solution of the general problem of identifying cell death processes is clearly demonstrated. Without the complementary information provided by these three imaging modalities, highly accurate classification is not possible.


Full table
Tumor boundary classification
Another important biomedical imaging application that can be approached using this quantitative multimodal classification system can be found in identifying tumor boundaries from tissue slices. Characterization of various cancers has been the focus of many studies in optical imaging and in particular, the studies of cancer progression (37) and treatment response (38) have shown promising results in which many morphological and label-free imaging biomarkers can be extracted and used to gain both diagnostic and prognostic information. Using an integrated quantitative classification approach to identify and characterize malignant tumors based on potentially subtle alterations may provide further insight into therapeutics and treatment outcomes.
In this analysis, classification of tumor, muscle, and collagen was performed on a rat mammary tumor as described in the Methods above. Figure 5 shows the results of this analysis. Figure 5A shows the co-registered H & E data allowing clear identification of the tumor site, which can be seen as the dark purple area in the H & E image due to the increased presence of tumor cells. Muscle can be clearly seen as the bright pink striated regions. Finally, the collagen can be identified in the regions connecting the muscle and tumor. The final results of the analysis, classifying each pixel in the multimodal image set is shown in Figure 5B where the tumor class is labeled red, the collagen class is labeled blue, and the muscle class is labeled green. Figure 5C shows a visualization of the extracted multimodal imaging signatures of these groups presented as a radial plot showing the SHG, TPEF, and FLIM spectral features. The extracted statistics of this data can be presented by a simplified 3D visualization in which each class is represented by the mean (centroid of ellipsoid) as well as the variance (principal axis lengths of ellipsoid) of its major TPEF, SHG, and FLIM signals (Figure 5D). Most notably, the tumor can be characterized by the absence of SHG signal and the presence of weak fluorescence. In contrast to this, the surrounding connective tissue exhibits increased levels of both SHG from surrounding collagen as well as an increase in the fluorescence signals. Classified muscle tissue is most clearly distinguished by the increased fluorescence intensity compared to the other two classes. Some obvious classification errors can be observed in several regions, and these may be due to tissue processing artifacts such as folds and wrinkles in the tissue section as well as the presence of other tissue components not considered, such as red blood cells.

Liver tissue classification
In order to further demonstrate the use of this classification approach in identifying cellular and subcellular features, anatomic labeling of rat liver tissue was performed. The liver, responsible for filtering blood and removing toxins from the body, consists mainly of hepatic cells around which enlarged capillaries known as sinusoids provide sufficient blood flow. Several studies have been performed using multiphoton microscopy in the liver for examining changes under conditions of liver fibrosis (39) and ischemia (40). In these studies, information such as density of hepatocytes and nuclei size was seen to be two major predictors of pathological alteration. With the quantitative classification approach employed here, hepatocytes as well as red blood cells found in the liver can be automatically classified and further characterized, showing the potential for this tool in studying early stages of pathological alterations in the liver.
Classification of hepatocyte cytoplasm, hepatocyte nuclei, and red blood cells is performed using the same approach. Figure 6A shows the co-registered histology from the area under investigation while Figure 6B provides the spatial classification map for identifying the anatomical features of interest in the tissue. Red pixels indicate classified red blood cells, green pixels hepatocyte cell cytoplasm, and blue pixels hepatocyte nuclei. These multimodal imaging signatures can also be presented using radial and ellipsoid plots (Figure 6C,D).

From these results, accurate identification of these three classes is obtained and clear differences between hepatocyte cell cytoplasm, hepatocyte nuclei, and red blood cells can be observed. The hepatocyte cell cytoplasm is well differentiated by the low fluorescence intensity levels observed as well as a slightly elevated lifetime, compared to the other two classes. Nuclei and red blood cells are best distinguished by their larger TPEF signals with nuclei tending to be the brightest signals in these images. Some classification errors may be observed based on the similarity between the fluorescence lifetime of red blood cells and hepatocyte nuclei classes. Along with this, the small size of these features and the role of spatial averaging tend to make classification difficult on spatially localized objects. Specifically, red blood cells and hepatocyte nuclei tend to be observed in smaller isolated areas in the image. Spatial averaging of the class dependent probabilities can cause the surrounding pixels to be falsely classified according to their particular neighbors in this case. In this dataset, this leads to a fairly noticeable overestimation of red blood cells in the image.
Ovary tissue classification
In the final experiment, mouse ovarian tissue was examined. The ovaries are a critical component of the female reproductive system and disorders of the ovary have recently been studied using MPM in order to extract powerful biomarkers for ovarian tumors (16,41). In these studies, the importance of quantifying the amount and orientation of connective tissues such as collagen and elastin, as well as the metabolism of the cellular microenvironment, was demonstrated in the identification of ovarian tumors. These features can be extracted automatically using this quantitative classification approach, allowing the images to be further analyzed to detect and report any pathological alterations that may be present.
Figure 7A shows the co-registered histology of the tissue slice imaged with the multimodal microscope while Figure 7B provides the spatial classification map for identifying collagen, epithelial cells, and the surrounding stroma. In this image, red pixels indicate classified stroma, green pixels epithelial regions, and blue pixels regions of connective tissue. Figure 7C,D show these multimodal imaging signatures presented as previously through both radial and ellipsoid plots, respectively.

Although accurate identification of connective tissue is obtained, classification of stromal tissue and epithelial cells shows only moderately successful results. The extracted multimodal imaging signatures shown in Figure 7C,D show strong differences between connective tissue and the other two classes examined here. These can be seen in the presence of large amounts of SHG signal and increased levels of fluorescence emission in the connective tissue class. The classification errors present in some areas may be due mainly to the similarity of these two classes. While epithelial tissue regions are associated with decreased TPEF signals, this alone is not robust enough to distinguish between the two groups in all cases. With more modalities, morphological features, or enhanced statistical modeling of these data, better identification of these tissue components may be attained.
Discussion
This work presents a quantitative, probabilistic framework for analyzing the high dimensional datasets that were acquired from an integrated multimodal optical microscope. This described analysis provides a direct link between the biological information of interest and the contrast obtained from the various modalities considered. By incorporating several modalities including OCM, TPEF, SHG, and FLIM, biological information can be automatically extracted with some prior information. This information can come from manual labeling of a few pixels, as was seen for the example of classifying images from ex vivo tissue slices, or from some ground truth which is known a priori, as with the cell death datasets. In both cases, powerful classification and extraction of multimodal signatures based on the contributions of each modality may be obtained, allowing for a new representation of information present in multimodal images. In considering the data in this way, accurate classification was achieved for both functional states, such as in determining cell fate as well as structural and anatomical identification as in the case of anatomic labeling of tissue slices. By considering the joint contrast across many complementary imaging modalities, accurate determination of cell death and further delineation of the differences between apoptosis and necrosis was performed. Quantitative analysis of multimodal microscopy data from fixed ex vivo tissue slices also showed strong classification of pathological states as well as structural or anatomical features on the cellular and subcellular level.
With these techniques, many improvements can still be made. Most notably, other spatial and morphological features can be extracted and utilized to incorporate spatial context into the classification procedures. Deeper statistical modeling of the data as well as acquisition of larger and more thorough datasets can be performed in order to develop more robust classification systems. Finally, in order to truly validate the classifications presented here, a direct comparison of the classified pixels to a generated ground truth map must be made. This can be constructed by consulting an expert pathologist to identify the appropriate regions in each image, allowing a direct comparison to the ground truth in order to assess the approximate accuracy of classification. Also, the incorporation of new imaging modalities that can provide further supplementary information could greatly increase the discriminating power of such classifiers. The incorporation of many of these improvements could lead to the extraction of diagnostic and prognostic information from these dense multimodal microscopy datasets.
Acknowledgements
The authors thank Darold Spillman for assistance with logistical and information technology support.
Funding: This research was supported in part by grants from the National Institutes of Health (R01 CA166309 and R01 EB023232). AJ Bower was supported in part by a National Science Foundation Graduate Research Fellowship (DGE-1144245) and by a UIUC ECE Distinguished Research Fellowship, and J Li was supported by the NIH National Cancer Institute Alliance for Nanotechnology in Cancer program (Midwest Cancer Nanotechnology Training Center; R25 CA154015A), a Support for Under-Represented Groups in Engineering (SURGE) Fellowship (University of Illinois at Urbana-Champaign), and a Beckman Institute Graduate Research Fellowship (University of Illinois at Urbana-Champaign). Additional information can be found at http://biophotonics.illinois.edu.
Footnote
Conflicts of Interest: The authors have no conflicts of interest to declare.
References
- Lin J, Teh S, Zheng W, Wang Z, Huang Z. Multimodal nonlinear optical microscopic imaging provides new insights into acetowhitening mechanisms in live mammalian cells without labeling. Biomed Opt Express 2014;5:3116-22. [Crossref] [PubMed]
- Tu H, Liu Y, Turchinovich D, Marjanovic M, Lyngsø J, Lægsgaard J, Chaney EJ, Zhao Y, You S, Wilson WL, Xu B, Dantus M, Boppart SA. Stain-free histopathology by programmable supercontinuum pulses. Nat Photonics 2016;10:534-40. [Crossref] [PubMed]
- Zhao Y, Marjanovic M, Chaney EJ, Graf BW, Mahmassani Z, Boppart MD, Boppart SA. Longitudinal label-free tracking of cell death dynamics in living engineered human skin tissue with a multimodal microscope. Biomed Opt Express 2014;5:3699-716. [Crossref] [PubMed]
- Balu M, Zachary CB, Harris RM, Krasieva TB, König K, Tromberg BJ, Kelly KM. In vivo multiphoton microscopy of basal cell carcinoma. JAMA Dermatol 2015;151:1068-74. [Crossref] [PubMed]
- Bower AJ, Arp Z, Zhao Y, Li J, Chaney EJ, Marjanovic M, Hughes-Earle A, Boppart SA. Longitudinal in vivo tracking of adverse effects following topical steroid treatment. Exp Dermatol 2016;25:362-7. [Crossref] [PubMed]
- Graf BW, Chaney EJ, Marjanovic M, Adie SG, De Lisio M, Valero MC, Boppart MD, Boppart SA. Long-term time-lapse multimodal intravital imaging of regeneration and bone-marrow-derived cell dynamics in skin. Technology 2013;1:8-19. [Crossref] [PubMed]
- Izatt JA, Hee MR, Owen GM, Swanson EA, Fujimoto JG. Optical coherence microscopy in scattering media. Opt Lett 1994;19:590-2. [Crossref] [PubMed]
- Denk W, Strickler JH, Webb WW. Two-photon laser scanning fluorescence microscopy. Science 1990;248:73-6. [Crossref] [PubMed]
- Bird DK, Yan L, Vrotsos KM, Eliceiri KW, Vaughan EM, Keely PJ, White JG, Ramanujam N. Metabolic mapping of MCF10A human breast cells via multiphoton fluorescence lifetime imaging of the coenzyme NADH. Cancer Res 2005;65:8766-73. [Crossref] [PubMed]
- Freund I, Deutsch M, Sprecher A. Connective tissue polarity. Optical second-harmonic microscopy, crossed-beam summation, and small-angle scattering in rat-tail tendon. Biophys J 1986;50:693-712. [Crossref] [PubMed]
- Freudiger CW, Min W, Saar BG, Lu S, Holtom GR, He C, Tsai JC, Kang JX, Xie XS. Label-free biomedical imaging with high sensitivity by stimulated Raman scattering microscopy. Science 2008;322:1857-61. [Crossref] [PubMed]
- Zumbusch A, Holtom GR, Xie XS. Three-dimensional vibrational imaging by coherent anti-stokes Raman scattering. Phys Rev Lett 1999;82:4142. [Crossref]
- Cheng LC, Horton NG, Wang K, Chen SJ, Xu C. Measurements of multiphoton action cross sections for multiphoton microscopy. Biomed Opt Express 2014;5:3427-33. [Crossref] [PubMed]
- Hell SW, Bahlmann K, Schrader M, Soini A, Malak HM, Gryczynski I, Lakowicz JR. Three-photon excitation in fluorescence microscopy. J Biomed Opt 1996;1:71-4. [Crossref] [PubMed]
- Squier J, Muller M, Brakenhoff G, Wilson KR. Third harmonic generation microscopy. Opt Express 1998;3:315-24. [Crossref] [PubMed]
- Adur J, Pelegati VB, de Thomaz AA, Baratti MO, Almeida DB, Andrade LA, Bottcher-Luiz F, Carvalho HF, Cesar CL. Optical biomarkers of serous and mucinous human ovarian tumor assessed with nonlinear optics microscopies. PLoS One 2012;7:e47007. [Crossref] [PubMed]
- Prats-Montalbán JM, de Juan A, Ferrer A. Multivariate image analysis: A review with applications. Chemometr Intell Lab Syst 2011;107:1-23. [Crossref]
- Ledley RS. High-speed automatic analysis of biomedical pictures. Science 1964;146:216-23. [Crossref] [PubMed]
- Irshad H, Veillard A, Roux L, Racoceanu D. Methods for nuclei detection, segmentation, and classification in digital histopathology: a review-current status and future potential. IEEE Rev Biomed Eng 2014;7:97-114. [Crossref] [PubMed]
- Glory E, Murphy RF. Automated subcellular location determination and high-throughput microscopy. Dev Cell 2007;12:7-16. [Crossref] [PubMed]
- Gurcan MN, Boucheron LE, Can A, Madabhushi A, Rajpoot NM, Yener B. Histopathological image analysis: a review. IEEE Rev Biomed Eng 2009;2:147-71. [Crossref] [PubMed]
- Yuan Y, Failmezger H, Rueda OM, Ali HR, Gräf S, Chin SF, Schwarz RF, Curtis C, Dunning MJ, Bardwell H, Johnson N, Doyle S, Turashvili G, Provenzano E, Aparicio S, Caldas C, Markowetz F. Quantitative image analysis of cellular heterogeneity in breast tumors complements genomic profiling. Sci Transl Med 2012;4:157ra143. [Crossref] [PubMed]
- Levin IW, Bhargava R. Fourier transform infrared vibrational spectroscopic imaging: integrating microscopy and molecular recognition. Annu Rev Phys Chem 2005;56:429-74. [Crossref] [PubMed]
- Fernandez DC, Bhargava R, Hewitt SM, Levin IW. Infrared spectroscopic imaging for histopathologic recognition. Nat Biotechnol 2005;23:469-74. [Crossref] [PubMed]
- Zhao Y, Graf BW, Chaney EJ, Mahmassani Z, Antoniadou E, Devolder R, Kong H, Boppart MD, Boppart SA. Integrated multimodal optical microscopy for structural and functional imaging of engineered and natural skin. J Biophotonics 2012;5:437-48. [Crossref] [PubMed]
- Graf BW, Adie SG, Boppart SA. Correction of coherence gate curvature in high numerical aperture optical coherence imaging. Opt Lett 2010;35:3120-2. [Crossref] [PubMed]
- Carpenter AE, Jones TR, Lamprecht MR, Clarke C, Kang IH, Friman O, Guertin DA, Chang JH, Lindquist RA, Moffat J, Golland P, Sabatini DM. CellProfiler: image analysis software for identifying and quantifying cell phenotypes. Genome Biol 2006;7:R100. [Crossref] [PubMed]
- Chang CC, Lin CJ. LIBSVM -- a library for support vector machines. ACM Trans Intell Syst Technol 2011;2:1-39. [Crossref]
- Lakowicz JR, Szmacinski H, Nowaczyk K, Johnson ML. Fluorescence lifetime imaging of free and protein-bound NADH. Proc Natl Acad Sci U S A 1992;89:1271-5. [Crossref] [PubMed]
- Burt PJ, Adelson EH. A multiresolution spline with application to image mosaics. ACM Trans Graph 1983;2:217-36. [Crossref]
- Nigam K, Mccallum AK, Thrun S, Mitchell T. Text classification from labeled and unlabeled documents using EM. Mach Learn 2000;39:103-34. [Crossref]
- Wang Q, Garrity GM, Tiedje JM, Cole JR. Naive Bayesian classifier for rapid assignment of rRNA sequences into the new bacterial taxonomy. Appl Environ Microbiol 2007;73:5261-7. [Crossref] [PubMed]
- Domingos P, Pazzani M. On the optimality of the simple bayesian classifier under zero-one loss. Mach Learn 1997;29:103-30. [Crossref]
- Wang HW, Gukassyan V, Chen CT, Wei YH, Guo HW, Yu JS, Kao FJ. Differentiation of apoptosis from necrosis by dynamic changes of reduced nicotinamide adenine dinucleotide fluorescence lifetime in live cells. J Biomed Opt 2008;13:054011. [Crossref] [PubMed]
- Yu JS, Guo HW, Wang CH, Wei YH, Wang HW. Increase of reduced nicotinamide adenine dinucleotide fluorescence lifetime precedes mitochondrial dysfunction in staurosporine-induced apoptosis of HeLa cells. J Biomed Opt 2011;16:036008. [Crossref] [PubMed]
- Bower AJ, Marjanovic M, Zhao Y, Li J, Chaney EJ, Boppart SA. Label-free in vivo cellular-level detection and imaging of apoptosis. J Biophotonics 2017;10:143-50. [Crossref] [PubMed]
- Sidani M, Wyckoff J, Xue C, Segall JE, Condeelis J. Probing the microenvironment of mammary tumors using multiphoton microscopy. J Mammary Gland Biol Neoplasia 2006;11:151-63. [Crossref] [PubMed]
- Walsh AJ, Cook RS, Manning HC, Hicks DJ, Lafontant A, Arteaga CL, Skala MC. Optical metabolic imaging identifies glycolytic levels, subtypes, and early-treatment response in breast cancer. Cancer Res 2013;73:6164-74. [Crossref] [PubMed]
- Lee HS, Liu Y, Chen HC, Chiou LL, Huang GT, Lo W, Dong CY. Optical biopsy of liver fibrosis by use of multiphoton microscopy. Opt Lett 2004;29:2614-6. [Crossref] [PubMed]
- Thorling CA, Liu X, Burczynski FJ, Fletcher LM, Roberts MS, Sanchez WY. Intravital multiphoton microscopy can model uptake and excretion of fluorescein in hepatic ischemia-reperfusion injury. J Biomed Opt 2013;18:101306. [Crossref] [PubMed]
- Adur J, Pelegati VB, Costa LF, Pietro L, de Thomaz AA, Almeida DB, Bottcher-Luiz F, Andrade LA, Cesar CL. Recognition of serous ovarian tumors in human samples by multimodal nonlinear optical microscopy. J Biomed Opt 2011;16:096017. [Crossref] [PubMed]

