

Quantitative evaluation of dual-flip-angle T1 mapping on DCE-MRI kinetic parameter estimation in head and neck
Introduction
Dynamic contrast-enhanced (DCE) MRI is an imaging tool for evaluating the microvascular environment of cancers, and it shows promising potential for clinical applications including tumor identification, characterization and treatment response assessment (1-6). Pharmacokinetic models (7-10) for DCE-MRI based on the rapid evolution of contrast agent (CA) concentration in tissues have been widely used for quantitative analysis and evaluation of perfusion properties in the microenvironment of tissue. However, dynamic image intensity in DCE-MRI images cannot be used directly for kinetic model fitting because it does not proportionally reflect the contrast agent concentration in tissues. Therefore, pre-contrast T1 mapping is an essential step to convert dynamic image intensity into contrast agent concentration in plasma and tissues. Among many T1 measurement methods such as inversion recovery (11-13), Look-Locker (14,15) and multiple flip angles (MFA) (16-19), MFA technique has been applied widely for DCE-MRI T1 mapping with spoiled gradient echo sequences due to its superior signal-to-noise ratio (SNR) and time efficiency. In practice, the number of flip angles is often reduced to only two flip angles (dual-flip-angle, DFA) (20-26) to shorten the scan time, but potentially increasing the uncertainty and decreasing the accuracy of the T1 estimation, which may lead to errors in kinetic model analysis (27-28). To achieve optimal T1 mapping accuracy when using DFA, a careful selection of the two flip angles is important, but much dependent on many other factors like TE, TR, and the T1 range of the tissues of interest. Theoretical analysis on accuracy and uncertainty of T1 mapping using DFA, as well as the DFA T1 mapping results in the brain compared to other methods, have been reported in several studies (28-29). However, these studies were not performed specifically for DCE-MRI applications where relatively low SNR and high temporal resolution are common. As such, those suggested pairs of flip angels may not be readily applicable to DCE-MRI studies to ensure the sufficient accuracy of T1 mapping of other tissues, such as head and neck in this study. In addition, because of the natural anatomical heterogeneities as well as the pronounced susceptibilities in head and neck, the overall T1 mapping accuracy by DFA could be even more questionable. More importantly, the influence of T1 map using DFA in the estimation of DCE-MRI kinetic parameters has not been evaluated quantitatively with true clinical DCE-MRI datasets in previous studies.
In this study, we aimed to retrospectively and quantitatively evaluate whether DCE-MRI combining DFA T1 mapping could obtain accurate kinetic parameter estimation in head and neck when compared to a MFA T1 mapping procedure. For this purpose, T1 maps generated from the MFA technique and five different DFA pairs were compared. These T1 maps were used for extended Toft’s model fitting to calculate the kinetic parameter maps. By the comparison of pharmacokinetic parameter maps calculated from MFA and DFAs, kinetic parameter estimation deviations influenced by the DFA T1 mapping were quantitatively evaluated.
Methods
Patients
DCE-MRI datasets on twenty three patients (3 females, 20 males, mean age 57.5 years) with untreated head and neck squamous cell carcinoma (HNSCC) who had no previous history of head and neck cancer were included in this retrospective study. Diagnoses of primary tumors were confirmed by biopsy. Institutional ethical review board approved this study and informed consents were obtained from each patient before DCE-MRI examination.
DCE-MRI examination
All DCE-MRI scans were performed on a 3T MRI scanner (Achieva, Philips Medical Systems, Best, The Netherlands) using a T1-weighted 3D spoiled gradient echo sequence. A body coil was used for excitation and a receive-only 16-channel head and neck array coil was used for signal reception. Contrast agent Gd-DOTA (Dotarem, Guerbet, France) was injected six seconds after the commencement of dynamic image acquisitions at a rate of 2.5 mL/s using a power injector pump (Medrad, Pittsburgh, Pa) through a 21-gauge intravenous catheter in the right antecubital vein. Contrast agent was administered at a concentration of 0.1 mmol/kg of body weight. After contrast agent injection, a 20-mL saline flush at the same injection rate followed immediately. Imaging parameters for DCE-MRI were: TR/TE =3.9 ms/0.9 ms, flip angle =15º, FOV =230 mm × 230 mm, matrix = 128×128, slices =25, and slice thickness =4 mm. A sensitivity encoding acceleration factor of 3 was used. A total of 185 dynamic images were acquired for each slice at a temporal resolution of 2.59 seconds per dynamic and the total DCE-MRI scan time was around eight minutes. Prior to the dynamic image acquisitions, pre-contrast images were acquired with four flip angles of 2º, 7º, 12º and 15º for T1 mapping based on the suggested optimized values (24,30) with other imaging parameters identical to DCE acquisition.
DCE-MRI analysis
DCE-MRI dynamic images were processed off-line using an in-house developed program written using Matlab (version 7.9, The MathWorks, Inc, Natick, MA, USA).
Dynamic images were first rigidly registered automatically on-line to the first baseline image to compensate for possible patient motion by an integrated image processing tool provided by the MRI vendor. Pixel-wise T1 maps were calculated by the least-square fitting of the theoretical equation for spoiled gradient echo signal intensity (S):

where M0 denotes the equilibrium magnetization and α denotes the flip angle. T1 maps using MFA were generated by fitting the pixel-wise image intensities at the flip angles of 2º, 7º, 12º and 15º to Eq. [1] using a non-linear least-square fitting algorithm based on Levenberg-Marquardt algorithm. T1 maps using different DFA combinations were also calculated based on the acquisition combinations of [2º, 7º], [2º, 12º], [2º, 15º], [7º, 12º] and [7º, 15º]. T1 maps using the DFA of [12º, 15º] were not calculated because considerable mapping errors could be predicted due to the small flip angle difference.
The extended Tofts model shown in Eq. [2] (31-32) was used for kinetic model analysis and physiological parameter extraction in this study.

where Ctis(t) and Cp(t) stand for the dynamic CA concentration in the tissue of interest and in the plasma at time t, respectively. Three independent physiological parameters of volume transfer rate kep, volume transfer constant Ktrans, and plasma volume fraction vp were derived by the non-linear least-square fitting of the extended Tofts model of Eq. [2]. Another physiological parameter of interstitial volume fraction ve was not included in this study because it was not an independent parameter and could be calculated by Ktrans/kep.
To obtain the dynamic CA concentration of plasma Cp(t), an automated blood vessel voxel extraction algorithm was used (33-35). Blood vessel voxels were extracted from only the central nine slices within the imaging volume to alleviate the possible inter-slice B1 field inhomogeneities presented in outer slices. All voxels that had the average dynamic signal intensity below 40 (arbitrary unit) were labeled as background or noise. The average maximum dynamic intensities for all voxels (Samax) except for the background were calculated. Then, a voxel was determined as a vessel (artery or vein) voxel if its peak intensity was greater than Samax plus three times of its standard deviation (SD). Artery voxels were subsequently recognized from vein voxels according to the early arrival of the dynamic peak intensity (~7.5 s earlier than vein voxels as found in our datasets). Finally, dynamic signal intensities in arteries were then converted into the dynamic plasma concentration Cp(t) according to Eq. [3].
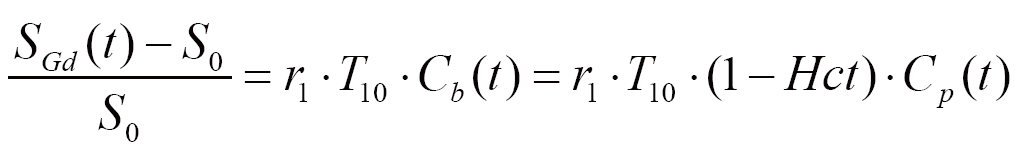
where r1 denotes the relaxivity of the contrast agent (4.5 s-1mM-1 as provided by the supplier). SGd(t) and S0 are post-contrast image intensity at time t and pre-contrast baseline image intensity, respectively. T10 is the intrinsic T1 relaxation time of arterial blood. Cb(t) and Cp(t) denote the dynamic contrast agent concentration in arterial blood and plasma respectively. Hct is hematocrit (assumed to be 0.42). Because T1 values for arterial blood could be significantly underestimated in DCE-MRI due to the fast blood velocity in arteries and the associated in-flow effect (36), a literature value of 1,550 ms for arterial blood at 3T (37) was adopted to ensure a consistent AIF to allow fair comparison to be made.
ROIs of primary tumors, salivary glands and muscles were drawn by a radiologist with over 14 years’ experience in head and neck MR imaging. kep, Ktrans, and vp values derived from MFA and DFAs were quantitatively compared within the ROI of primary tumors, salivary glands and muscles. A Kruskal-Wallis test was performed to determine if there was any statistically significant difference using a cut-off P-value level of <0.05.
Results
T1 maps (goodness of fit R2>0.8) generated by the MFA method and different DFA combinations are shown in Figure 1. The corresponding bar plots for all tissues in these T1 maps (bar heights denote the mean value and the error bars denote one standard deviation distance) generated from the MFA reference and different DFAs are illustrated in Figure 2. A Kruskal-Wallis test showed that all T1 maps by DFAs were significantly different from the reference by MFA (P<0.001). It was found that T1 values were remarkably underestimated by the DFA of [2º, 7º], while overestimated by the DFAs of [7º, 12º] and [7º, 15º] with larger standard deviations. On comparing, T1 maps by [2º, 12º] and [2º, 15º], small but statistically significant differences from MFA in terms of T1 distribution and standard deviation were found.


Physiological parameter maps (goodness of fit R2 >0.8, overlaid on the first dynamic MRI image) of kep, Ktrans, and vp based on the T1 maps by the MFA and different DFA combinations were compared in Figure 3. Ktrans, and vp results based on the T1 maps of [2º, 7º] were generally overestimated compared to the corresponding reference maps based on the T1 map obtained from the MFA method. In contrast, Ktrans, and vp results based on the T1 maps of [7º, 12º] and [7º, 15º] were considerably underestimated compared to the MFA references. On the other hand, the differences in kep maps between the reference and those based on DFAs were relatively small compared to the differences of Ktrans and kep values between MFA and DFAs.

kep, Ktrans, and vp values estimated based on the T1 maps generated by the MFA method and different DFA combinations were compared in the ROIs of primary tumors, salivary glands and muscles, and the results were shown by the bar plots in Figures 4,5,6 respectively. The fitting result differences in mean kep, Ktrans and vp by [2º, 7º] were 8.4%, 264.3% and 27.0% higher for primary tumors, 22.1%, 272.4% and 23.1% higher for salivary glands, and 0.5%, 71.4% and 333.3% higher for muscles, than the corresponding reference values obtained from the MFA method, respectively. Except for the kep values in muscles, all fitting results by [2º, 7º] were significantly different from the MFA reference with P values smaller than 0.01. In general, DFA pairs of [2º, 12º] and [2º, 15º] also overestimated the kinetic DCE parameters like [2º, 7º], but with much smaller difference from the MFA reference. In particular, kep, Ktrans and vp for primary tumors were overestimated by 0.9%, 53.6% and 18.9% by [2º, 12º], and -2.4% (minus indicates underestimation), 32.1% and 16.2% by [2º, 15º], respectively. kep, Ktrans and vp for salivary glands were overestimated by 7.4%, 58.6% and 15.4% by [2º, 12º], and 4.2%, 24.1% and 7.7% by [2º, 15º], respectively. For muscles, kep, Ktrans and vp overestimation by [2º, 12º] and [2º, 15º] were 0.2%, 28.6% and 33.3%, and 0.1%, 14.3%, and 16.7%, respectively. Similarly, only kep values obtained for three different tissues shows no significant differences (P>0.05) while Ktrans and vp exhibited significant overestimation from the references with P<0.01. As comparison to the above three DFA pairs, [7º, 12º] and [7º, 15º] remarkably underestimated the kinetic parameters of Ktrans and vp for all primary tumors, salivary glands and muscles with significant difference (P<0.01). For mean kep values in primary tumors and salivary glands, the fitting results by [7º, 12º] were both slightly overestimated by 3.6% and 0.2% compared to the MFA reference, without significant difference from the reference. While for muscles, the kep value was slightly underestimated by 1.9% without significant difference by [7º, 12º]. The flip angle pair [7º, 15º] underestimated the mean kep values in primary tumors, salivary glands and muscles by 0.1%, 8.4% and 1.9%, respectively, with all P values larger than 0.05. The statistics for the fitting results by MFA and different DFAs for primary tumors, salivary glands and muscles are summarized in detail in Table 1.


Full table
Discussion
It has been recognized that the accuracy of kinetic parameter fitting in DCE-MRI is related not only to T1 mapping, although indicated as the dominating source for kinetic parameter estimation errors (28), but also to many other sources like patient motion, AIF extraction, B1 field inhomogeneity, as well as insufficient temporal resolution. In this study, DCE-MRI protocols were designed to minimize these effects. Possible patient motion was compensated by registration prior to other further processing and analysis. AIF was extracted from individual patient rather than the patient population (32) to accurately reflect the inter-patient AIF variations. The temporal resolution was 2.59 seconds, sufficiently fast to alleviate the possible fitting errors due to the dynamic signal fluctuation. A body coil was used for excitation so the transmission B1 field was considered uniform and hence the B1 inhomogeneity should be small. By minimizing the effects of other factors on kinetic parameter estimation, the influence of T1 on kinetic estimation error is believed to be dominant in this retrospective study.
T1 measurement by DFA obtained slightly better time efficiency than MFA, but the choice of two flip angles for DFA had a profound influence on T1 mapping results. Theoretical analysis on T1 mapping uncertainty by DFA (38) has shown that the two optimal flip angles are dependent on factors such as the T1 range to be measured, TE and TR. In addition, theoretical T1 mapping variance is inversely proportional to the square of signal-to-noise ratio (SNR) (38). In practice, because of the natural heterogeneity of tissues in head and neck, the overall mapping accuracy for every T1 value in different tissues of interest is difficult to ensure by DFA. Moreover, this T1 mapping uncertainty may further deteriorates under the conditions of relatively low SNRs of DCE-MRI images as well as the pronounced susceptibilities in head and neck.
Inaccuracy and uncertainty of DFA T1 mapping could propagate through CA concentration into kinetic model fitting and hence lead to errors in kinetic parameter estimates. The relatively low sensitivity of kep to T1 mapping could be explained by the fact that kep is theoretically only dependent on the dynamic time-intensity curve pattern rather than the absolute intensity value. The underestimation of T1 values by [2º, 7º] resulted in the significant overestimation of Ktrans and vp. On the contrary, the overestimation of T1 values by [7º, 12º] and [7º, 15º] both resulted in the underestimation of Ktrans and vp.
Different tissues may show distinct dynamic time-intensity curves in DCE-MRI. For the selected tissues of interest in this study, primary tumors and salivary glands had similar fast wash-in and subsequent moderate wash-out time-intensity curve patterns due to the high tissue vascularity (high vp) and fast contrast agent perfusion (high kep and Ktrans) within these tissues. This partially explains the similar contributions to kinetic parameter estimation error in primary tumors and salivary glands by using DFAs. On the other hand, muscles show less tissue heterogeneity and lower vascularity. Their time-intensity curve patterns usually exhibit a slow wash-in phase in the entire time course, reflecting the slow perfusion of contrast agent in muscles. Excellent kep fitting accuracy was achieved for DFA pairs in muscles for this slow wash-in time-intensity curve pattern with relatively low kep values. However, significant different Ktrans and vp values could still result from using DFA.
According to the bar plots shown in Figures 4-6, it appeared that T1 mapping error induced by DFAs had the greatest influence on the estimation of Ktrans in primary tumors and salivary glands, and the estimation of vp in muscles. Even the smallest estimate deviation of Ktrans and vp for primary tumors by [2º, 15º] could be as high as 31.0% and 15.0%, respectively. It was also found that for kinetic parameter fitting in all three tissues of interest, [7º, 12º] and [7º, 15º] had larger standard deviations of fitting results than other DFA pairs. This may be attributed to the noisier T1 maps obtained by [7º, 12º] and [7º, 15º] as shown in Figure 1.
This retrospective study has some limitations. As this is a retrospective study on clinical data, the DCE-MRI protocol was designed more accordingly to the clinical requirements so that the technical performance may be compromised. In order to cover a large area in head and neck (25 slices) but maintain high temporal resolution (2.59 s), relatively short TR and high acceleration factor were applied which may compromise image SNR. The number and value of applied flip angles were optimized to keep balance between time efficiency and T1 mapping accuracy. Transmission B1 mapping and in-flow compensation were not included in DCE-MRI protocol but their effect on kinetic parameter estimation should be further investigated in future studies. It is also worth noting that the large kinetic model fitting deviations by DFA pairs in this study may be partially attributed to the natural heterogeneity in head and neck tissues. We hypothesize that kinetic fitting deviations using DFAs may be reduced for DCE-MRI analysis in relatively homogenous tissues like brain, but this has yet to be further validated. For DCE-MRI in breast where high temporal resolution may not be necessary, accuracy of DFA T1 mapping could be further improved by using longer TR and large number of averages and hence reduce kinetic estimation errors.
In conclusion, DFA, although provides slightly better time efficiency in T1 measurement, may lead to significant DCE-MRI kinetic parameter estimation errors in head and neck in clinical practice, according to the findings in this retrospective evaluation. MFA is able to provide more accurate and robustness T1 mapping and kinetic parameter estimation than DFA, in particular under the situations of relatively low SNR due to the compromise of spatial and temporal resolution, and therefore should be the preferable method of choice for head and neck DCE-MRI.
Acknowledgements
This work is supported by Hong Kong GRF grant CUHK4660088 and SEG_CUHK02.
Disclosure: The authors declare no conflict of interest.
References
- Yang S, Law M, Zagzag D, et al. Dynamic contrast-enhanced perfusion MR imaging measurements of endothelial permeability: differentiation between atypical and typical meningiomas. AJNR Am J Neuroradiol 2003;24:1554-9. [PubMed]
- Oberholzer K, Pohlmann A, Schreiber W, et al. Assessment of tumor microcirculation with dynamic contrast-enhanced MRI in patients with esophageal cancer: initial experience. J Magn Reson Imaging 2008;27:1296-301. [PubMed]
- Knopp MV, Giesel FL, Marcos H, et al. Dynamic contrast-enhanced magnetic resonance imaging in oncology. Top Magn Reson Imaging 2001;12:301-8. [PubMed]
- Cron GO, Kelcz F, Santyr GE. Improvement in breast lesion characterization with dynamic contrast-enhanced MRI using pharmacokinetic modeling and bookend T(1) measurements. Magn Reson Med 2004;51:1066-70. [PubMed]
- Loo CE, Teertstra HJ, Rodenhuis S, et al. Dynamic contrast-enhanced MRI for prediction of breast cancer response to neoadjuvant chemotherapy: initial results. AJR Am J Roentgenol 2008;191:1331-8. [PubMed]
- Zahra MA, Hollingsworth KG, Sala E, et al. Dynamic contrast-enhanced MRI as a predictor of tumour response to radiotherapy. Lancet Oncol 2007;8:63-74. [PubMed]
- Larsson HB, Stubgaard M, Frederiksen JL, et al. Quantitation of blood-brain barrier defect by magnetic resonance imaging and gadolinium-DTPA in patients with multiple sclerosis and brain tumors. Magn Reson Med 1990;16:117-31. [PubMed]
- Brix G, Semmler W, Port R, et al. Pharmacokinetic parameters in CNS Gd-DTPA enhanced MR imaging. J Comput Assist Tomogr 1991;15:621-8. [PubMed]
- Tofts PS, Kermode AG. Measurement of the blood-brain barrier permeability and leakage space using dynamic MR imaging. 1. Fundamental concepts. Magn Reson Med 1991;17:357-67. [PubMed]
- Tofts PS, Brix G, Buckley DL, et al. Estimating kinetic parameters from dynamic contrast-enhanced T(1)-weighted MRI of a diffusable tracer: standardized quantities and symbols. J Magn Reson Imaging 1999;10:223-32. [PubMed]
- Studler U, White LM, Andreisek G, et al. Impact of motion on T1 mapping acquired with inversion recovery fast spin echo and rapid spoiled gradient recalled-echo pulse sequences for delayed gadolinium-enhanced MRI of cartilage (dGEMRIC) in volunteers. J Magn Reson Imaging 2010;32:394-8. [PubMed]
- Zhu DC, Penn RD. Full-brain T1 mapping through inversion recovery fast spin echo imaging with time-efficient slice ordering. Magn Reson Med 2005;54:725-31. [PubMed]
- Ordidge RJ, Gibbs P, Chapman B, et al. High-speed multislice T1 mapping using inversion-recovery echo-planar imaging. Magn Reson Med 1990;16:238-45. [PubMed]
- Henderson E, McKinnon G, Lee TY, et al. A fast 3D look-locker method for volumetric T1 mapping. Magn Reson Imaging 1999;17:1163-71. [PubMed]
- Freeman AJ, Gowland PA, Mansfield P. Optimization of the ultrafast Look-Locker echo-planar imaging T1 mapping sequence. Magn Reson Imaging 1998;16:765-72. [PubMed]
- Andreisek G, White LM, Yang Y, et al. Delayed gadolinium-enhanced MR imaging of articular cartilage: three-dimensional T1 mapping with variable flip angles and B1 correction. Radiology 2009;252:865-73. [PubMed]
- Epstein FH, Mugler JP 3rd, Brookeman JR. Improved T1-weighted two-dimensional MP-GRE imaging of the liver with variable flip angles for shaping the signal evolution. J Magn Reson Imaging 1994;4:91-8. [PubMed]
- Fram EK, Herfkens RJ, Johnson GA, et al. Rapid calculation of T1 using variable flip angle gradient refocused imaging. Magn Reson Imaging 1987;5:201-8. [PubMed]
- Wang D, Shi L, Wang YX, et al. Concatenated and parallel optimization for the estimation of T1 map in FLASH MRI with multiple flip angles. Magn Reson Med 2010;63:1431-6. [PubMed]
- Wang HZ, Riederer SJ, Lee JN. Optimizing the precision in T1 relaxation estimation using limited flip angles. Magn Reson Med 1987;5:399-416. [PubMed]
- Brookes JA, Redpath TW, Gilbert FJ, et al. Measurement of spin-lattice relaxation times with FLASH for dynamic MRI of the breast. Br J Radiol 1996;69:206-14. [PubMed]
- Brookes JA, Redpath TW, Gilbert FJ, et al. Accuracy of T1 measurement in dynamic contrast-enhanced breast MRI using two- and three-dimensional variable flip angle fast low-angle shot. J Magn Reson Imaging 1999;9:163-71. [PubMed]
- Koh TS, Thng CH, Lee PS, et al. Hepatic metastases: in vivo assessment of perfusion parameters at dynamic contrast-enhanced MR imaging with dual-input two-compartment tracer kinetics model. Radiology 2008;249:307-20. [PubMed]
- Bisdas S, Seitz O, Middendorp M, et al. An exploratory pilot study into the association between microcirculatory parameters derived by MRI-based pharmacokinetic analysis and glucose utilization estimated by PET-CT imaging in head and neck cancer. Eur Radiol 2010;20:2358-66. [PubMed]
- Yu Y, Jiang Q, Miao Y, et al. Quantitative analysis of clinical dynamic contrast-enhanced MR imaging for evaluating treatment response in human breast cancer. Radiology 2010;257:47-55. [PubMed]
- Craciunescu O, Brizel D, Cleland E, et al. Dynamic contrast enhanced-MRI in head and neck cancer patients: variability of the precontrast longitudinal relaxation time (T10). Med Phys 2010;37:2683-92. [PubMed]
- Tofts PS, Berkowitz B, Schnall MD. Quantitative analysis of dynamic Gd-DTPA enhancement in breast tumors using a permeability model. Magn Reson Med 1995;33:564-8. [PubMed]
- Di Giovanni P, Azlan CA, Ahearn TS, et al. The accuracy of pharmacokinetic parameter measurement in DCE-MRI of the breast at 3 T. Phys Med Biol 2010;55:121-32. [PubMed]
- Deoni SC, Rutt BK, Peters TM. Rapid combined T1 and T2 mapping using gradient recalled acquisition in the steady state. Magn Reson Med 2003;49:515-26. [PubMed]
- De Naeyer D, Verhulst J, Ceelen W, et al. Flip angle optimization for dynamic contrast-enhanced MRI-studies with spoiled gradient echo pulse sequences. Phys Med Biol 2011;56:5373-95. [PubMed]
- Tofts PS. Modeling tracer kinetics in dynamic Gd-DTPA MR imaging. J Magn Reson Imaging 1997;7:91-101. [PubMed]
- Parker GJ, Roberts C, Macdonald A, et al. Experimentally-derived functional form for a population-averaged high-temporal-resolution arterial input function for dynamic contrast-enhanced MRI. Magn Reson Med 2006;56:993-1000. [PubMed]
- Rijpkema M, Kaanders JH, Joosten FB, et al. Method for quantitative mapping of dynamic MRI contrast agent uptake in human tumors. J Magn Reson Imaging 2001;14:457-63. [PubMed]
- Yuan J, Chow SK, Yeung DK, et al. A five-colour colour-coded mapping method for DCE-MRI analysis of head and neck tumours. Clin Radiol 2012;67:216-23. [PubMed]
- Yuan J, Chow SK, King AD, et al. Heuristic linear mapping of physiological parameters in dynamic contrast-enhanced MRI without T1 measurement and contrast agent concentration. J Magn Reson Imaging 2012;35:916-25. [PubMed]
- Roberts C, Little R, Watson Y, et al. The effect of blood inflow and B(1)-field inhomogeneity on measurement of the arterial input function in axial 3D spoiled gradient echo dynamic contrast-enhanced MRI. Magn Reson Med 2011;65:108-19. [PubMed]
- Noeske R, Seifert F, Rhein KH, et al. Human cardiac imaging at 3 T using phased array coils. Magn Reson Med 2000;44:978-82. [PubMed]
- Schabel MC, Morrell GR. Uncertainty in T(1) mapping using the variable flip angle method with two flip angles. Phys Med Biol 2009;54:N1-8.

