
Highly efficient eigen decomposition based statistical optical microangiography
Introduction
Optical coherence tomography (OCT) (1,2)/Optical coherence tomography angiography (OCTA) (3) has recently drawn increasing attention in the field of biomedical imaging due to its rapid clinical translation to ophthalmic imaging within 1 year or so. With a goal to contrast blood flow within microcirculatory tissue beds, there are a number of data processing methods available that can achieve OCTA. Most published methods use the magnitude of the OCT signal, such as speckle variance (4), correlation mapping (5), and split-spectrum amplitude decorrelation angiography (6). Some other methods use the phase information, such as phase variance OCT (7). Leveraging the complete information available in the OCT system, the complex OCT signal is explored, such as optical microangiography (OMAG) (8,9), complex differential variance (CDV) (10), and eigen-decomposition (ED) based OMAG (11). Among them, ED approach is a statistical analysis method that utilizes the statistical properties of time varying complex OCT signals to achieve the purpose of contrasting blood flow within tissue. ED analysis belongs to adaptive filtering category in statistical signal processing discipline (12,13), which has been widely used in magnetic resonance imaging (14) and ultrasonic imaging (15) where it serves to analyze dynamic signals from the measured signals in patients.
When an OCT probe scans a blood perfused tissue, the measured signal is contributed by the depth-resolved field speckle signals due to static tissue components and moving blood cells as well as additive system noise (Figure 1A). Assuming the speckle signal due to tissue components and that due to moving particles are not correlated, the multivariate statistics (12) can be applied to express the measured signals in multi-dimensional spaces in terms of their spatial and temporal frequency components (Figure 1B). Since the bio-tissue is heterogeneous, its OCT signal contains band-limited frequency components (typically Gaussian distribution) centered at zero frequency (3,16). In this case, a high-pass filtering should be amendable to separate the OCT signal due to moving blood cells from the static tissue components (Figure 1C), examples of which include differentiation OMAG (9) and feature space OMAG (17). However, the bulk tissue motion due to, e.g., heartbeat and breathing is inevitable for in vivo imaging, which causes the central frequency of the tissue components slightly drifting away from the zero frequency. Under this situation, the adaptive nature of ED filtering fits perfectly well to separate the moving signals from the tissue signals (Figure 1D), leading to a better mapping of vascular networks, as experimentally demonstrated by ED-OMAG on the basis of pixel by pixel or voxel by voxel computation in (11). While statistically sound, voxel based analysis has serious drawbacks to implement ED-OMAG for real time imaging because (I) it requires expensive computational power (typically >1 h to generate a 3D optical angiogram for a typical OCT dataset of 1,024×240×240 voxels); and (II) it may fail to work when the probing voxel/pixel is totally located within moving blood, due to the fact that under this circumstance, the moving speckle, rather than tissue signal dominates the measured OCT signals, which does not satisfy ED filtering requirement to remove static tissue components (13).

Methods
To overcome these drawbacks of the voxel-based eigen-decomposition (vED), here we propose a new ED approach by conducting statistical ED analysis on the entire B-scans, which we call B-scans eigen-decomposition (bED) for ease of discussion below. Because the entire B-scan is treated as a ‘voxel’ for the ED analysis, this “voxel” must be dominated by the tissue components because blood volume fraction within living tissue is <7%, which rules out the 2nd drawback in vED. Such approach is also equally applicable to the ED-analysis based on A-scans eigen-decomposition (aED). For simplicity, below we present the proposed approach based on bED.
As discussed above, the complex OCT signal within a single voxel is a result of the field superposition of static scattering component, dynamic scattering component and additive noise (10). This property of the OCT signal makeup offers an opportunity to visualize blood flow in vivo by suppressing the tissue signal with proper high pass filtering (HPF). In the OMAG scanning protocol (9), it requires to acquire repeated B-scans at one location in order to build a time series of complex B-scans for OCTA (Figure 2A). Assuming there is N repeated B-scans at one location, these B-scan signals can then be collectively expressed as a 2-D vector form Eq. [1]:


where X(i) is the ith complex B-scan OCT signal, and X is the B-scan ensemble, which consists of static tissue components Xt, moving components Xm and additive noise Xn Eq. [2]:

Now the problem for OCTA is to find Xm from X by the use of ED of X. Since the tissue signal Xt dominates X, it can be obtained through the eigenvector decomposition of the signal correlation matrix,  which can be estimated by Eq. [3],

where H is the Hermitian transpose operation. The correlation matrix is in general Hermitian symmetric and positive semidefinite. Thus, a complete (full rank) set of eigenvectors and orthonormal eigenvalues can be estimated through Eq. [4],

where E=[eB(1),eB(2),…,eB (N)] is the N×N unitary matrix of eigenvectors, Λ=[λB(1),λB(2),…,λB(N)] is the N×N diagonal matrix of eigenvalues. Note that eigenvalues {λB(1),λB(2),…,λB(N)}are sorted in descending order. Because the static tissue components dominate X, they only contribute to the first Kth eigenvectors. Hence, the dynamic signals due to moving blood can be isolated from the tissue signals by designing eigen regression filter as follows Eq. [5]:

where Xm is the moving signals on the B-scan after removing the static tissue signal. Note that K is determined by the sample and the repetition number N in the experiment. The frequency fi of each eigenvector can be estimated from the lag-one autocorrelation formula Ri(1) Eq. [6] (13):
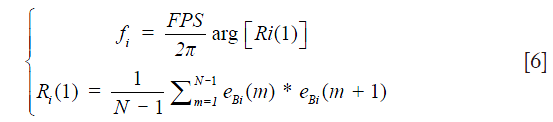
where FPS is the frame rate of the OCT system. arg returns the phase angle of the lag-one autocorrelation. From Eq. [6], it is trivial to appreciate that when the dominant eigen components of the first Kth eigenvectors (i.e., static tissue components) drifts away from zero frequency due to bulk tissue motion shown in Figure 1D, the blood flow signal can still be precisely retrieved by removing the first eigen components using Eq. [5]. This makes this ED approach adaptive, thus superior to other non-adaptive HPF approaches.
Results
To demonstrate the performance delivered by the proposed bED and aED, we conducted the imaging of cerebral blood flow in mice by the use of a spectral domain OCT system with an imaging speed of 92-kHz. The operating wavelength was 1,310 nm that had a spectral bandwidth of ~80 nm. The volumetric dataset was captured with a scanning protocol covering 2.0 mm × 2.0 mm area on the mouse cortex. For this scanning protocol (referring to Figure 2), each B-scan consisted of 240 A-scans (x-axis) with 1,024 pixels (z-axis) in each A-scan. In the slow scan (y-axis), there were 240 positions. At each position, the number of repeated B-scans (N=16) were collected, upon which the proposed ED-approach was applied to separate the moving signals due to flow from the tissue signals, upon which a single B-scan angiographic image was formed at this position. Hence, each volumetric dataset was composed of 1,024 by 240 by 240 (z-x-y) voxels. For cerebral blood flow imaging, the mouse was prepared with cranial window preparation for ease access to the brain cortex. All the animal procedures for the terminal experiment were approved by the Institute of Animal care and Use Committee of the University of Washington.
In the evaluation, the ensemble size of the signal vector is N=8 (we only utilize the first 8 of 16 frames in a position to contrast blood flow) for all the algorithms. For vED (ED based on voxels/pixels), 3 by 3 pixels were considered as a voxel. This treatment is appropriate because adjacent sample volumes within an imaging view of B-scan are more likely to share similar statistics, leading to a smoothing effect for final results. Figure 3A shows typical structural cross sectional image (averaged from an ensemble of 8 B-scans). Figure 3B-D show corresponding blood flow images generated by vED, aED and bED, respectively. It is clear that all the algorithms can contrast flow signal, but with different clarity, e.g., contrast. Among them, bED and aED give better contrast. Some tiny capillaries identified by bED and aED, as pointed by arrows in Figure 3, can hardly be resolved by vED. This is largely attributed to the use of 3 by 3 pixels as one voxel for the ED analysis in vED method, resulting in reduced spatial resolution.

To further investigate, we generated 2D enface angiograms by projecting the 3D ED-OMAG values along the depth of 0.5 mm from the cortical surface. The 0.5 mm depth was selected because the OCT signal attenuation is not significant at this range. The results are given in Figure 4 by the use of vED, aED and bED, respectively, where the images in the top row were resulted by the use of the maximum intensity projection. Visually, it is difficult to judge which algorithm delivers better performance because all the three methods examined provide more or less similar vascular networks for the mouse cortical layer. To investigate further, we quantitatively evaluated the angiograms shown in Figure 4A-C by using three metrics, i.e., SNR, image contrast, and vessel connectivity. To evaluate these metrics, however, a ground-truth angiogram is needed, which unfortunately is not available for in vivo studies. Here, we adopted an alternative way described in (3) to solve this problem, where we created an image by averaging all the three angiograms with equal weight (Figure 4D). This created image is taken as a surrogate for the ground truth, from which a binary vascular mask is generated (Figure 4E) by using a binary operation through adaptive Hessian filter (18). Finally, the SNR, image contrast and vessel connectivity were calculated according to the definitions described in (3). Note that for the metric of vessel connectivity, the lower value indicates a better vessel connection that an algorithm can deliver to an angiogram.

The quantitative results are tabulated in Table 1. Compared to vED, the proposed approaches of aED and bED have larger values in SNR and contrast, indicating they have better performance on SNR and contrast. The lower values of vessel connectivity in aED and bED mean the better performance in vasculature connectivity. The proposed methods have better performance is reasonable, because rather than the use of single pixel in vED, the pixels within entire B-scan or A-scan are now involved in eigen decomposition analysis, resulting in better statistical classification between the moving and tissue signals. Therefore, it is not surprising that the bEd approach delivers the best performance, as indicated by the quantification values in Table 1.

Full table
Finally, we assessed the most salient feature offered by bED and aEd approaches, which is the ‘computational cost’ saving. Here we compared the computation time needed for producing a cross sectional OCTA flow image (i.e., B scan) by applying each algorithm on a range of N from 2 to 16. ED algorithms are coded in MATLAB processing language running on a Windows 7 Pro computer using an Intel Xeon E5345 (2.33 GHz) processor with 16 GB of random access memory (RAM). In the evaluation, we extracted the blood flow signals from the measured complex OCT signals by taking the 1st eigen component as the static tissue signal. Average and standard deviation of computational times are reported for 240 randomly selected B-scans. The resulting computational costs with error bars are plotted in Figure 5 as a function of repetition numbers of B-scan needed to produce the blood flow B-scan for vED, aED, and bED algorithms, respectively. It can be seen that the vED algorithm takes roughly a constant time around 15 sec to generate a cross sectional flow image for all N. However, the computational times for aED and bED algorithms increase with the increase of B-scan repetitions. For a specific repetition of N=8, vED requires ~15 sec to produce the final B-scan blood flow image, while aED and bED only take ~0.06 sec and ~0.02 sec, respectively. The importance of bED approach is clear because it only requires about 1/3 computational cost of aED, and 1/750 of vED, demonstrating a drastic computational cost saving to perform OCTA. This is technically significant because such implementation would be very much practical for real time implementation of statistical eigen decomposition of the measured OCT signals for OCT based angiography. Note that, although computational cost of each algorithm could dramatically reduce by using high performance computer with graphic processing units. The comparisons of computational cost in this manuscript can still provide a good reference.

Conclusions
In summary, we have proposed a highly efficient and practical statistically based bED approach to contrast functional blood vessel networks within microcirculatory tissue beds in vivo for use in OCT based angiography. By applying ED on a set of repeated complex OCT B-scan datasets, the computational time to produce an angiogram is dramatically reduced even with better imaging performance in terms of SNR, image contrast, and vessel connectivity, demonstrating its practicality for real time implementations in hardware. To the best of our knowledge, this is the first time that the ED based approach is applied onto the B-scan OCT complex signals for the purpose of extracting blood flow signal from the measured optical signals. Though we have demonstrated its feasibility of bED and aED OMAG, it would be straightforward to apply the same concept onto the repeated OCT volumetric dataset, as recently demonstrated in (19) by the use of MHz swept source OCT systems.
Acknowledgements
Funding: The study is supported in part by National Heart and Lung Institute (R01HL093140); National Eye Institute (R01EY024158).
Footnote
Conflicts of Interest: The authors have no conflicts of interest to declare.
Ethical Statement: The study was approved by Institute of Animal care and Use Committee of the University of Washington (No. 4262-01).
References
- Fercher AF, Drexler W, Hitzenberger CK, Lasser T. Optical coherence tomography - principles and applications. Rep Prog Phys 2003;66:239. [Crossref]
- Tomlins PH, Wang RK. Theory, developments and applications of optical coherence tomography. J Physics D: Appl Phys 2005;38:2519. [Crossref]
- Zhang A, Zhang Q, Chen CL, Wang RK. Methods and algorithms for optical coherence tomography-based angiography: a review and comparison. J Biomed Opt 2015;20:100901. [Crossref] [PubMed]
- Mariampillai A, Standish BA, Moriyama EH, Khurana M, Munce NR, Leung MK, Jiang J, Cable A, Wilson BC, Vitkin IA, Yang VX. Speckle variance detection of microvasculature using swept-source optical coherence tomography. Opt Lett 2008;33:1530-2. [Crossref] [PubMed]
- Jonathan E, Enfield J, Leahy MJ. Correlation mapping method for generating microcirculation morphology from optical coherence tomography (OCT) intensity images. J Biophotonics 2011;4:583-7. [PubMed]
- Jia Y, Tan O, Tokayer J, Potsaid B, Wang Y, Liu JJ, Kraus MF, Subhash H, Fujimoto JG, Hornegger J, Huang D. Split-spectrum amplitude-decorrelation angiography with optical coherence tomography. Opt Express 2012;20:4710-25. [Crossref] [PubMed]
- Fingler J, Schwartz D, Yang C, Fraser SE. Mobility and transverse flow visualization using phase variance contrast with spectral domain optical coherence tomography. Opt Express 2007;15:12636-53. [Crossref] [PubMed]
- Wang RK, Jacques SL, Ma Z, Hurst S, Hanson SR, Gruber A. Three dimensional optical angiography. Opt Express 2007;15:4083-97. [Crossref] [PubMed]
- Wang RK, An L, Francis P, Wilson DJ. Depth-resolved imaging of capillary networks in retina and choroid using ultrahigh sensitive optical microangiography. Opt Lett 2010;35:1467-9. [Crossref] [PubMed]
- Nam AS, Chico-Calero I, Vakoc BJ. Complex differential variance algorithm for optical coherence tomography angiography. Biomed Opt Express 2014;5:3822-32. [Crossref] [PubMed]
- Yousefi S, Zhi Z, Wang RK. Eigendecomposition-based clutter filtering technique for optical micro-angiography. IEEE Trans Biomed Eng 2011.58. [PubMed]
- Harris RJ. A primer of multivariate statistics. 3rd Edition. Mahwah, NJ: Psychology Press, 2001.
- Moon TK, Stirling WC. Mathematical Methods and Algorithms for Signal Processing. Upper Saddle River, NJ: Pearson HALL, 2000.
- Hasan KM, Basser PJ, Parker DL, Alexander AL. Analytical computation of the eigenvalues and eigenvectors in DT-MRI. J Magn Reson 2001;152:41-7. [Crossref] [PubMed]
- Yu A, Lovstakken L. Eigen-based clutter filter design for ultrasound color flow imaging: a review. IEEE Trans Ultrason Ferroelectr Freq Control 2010;57:1096-111. [Crossref] [PubMed]
- Wang RK, Ma Z. Real-time flow imaging by removing texture pattern artifacts in spectral-domain optical Doppler tomography. Opt Lett 2006;31:3001-3. [Crossref] [PubMed]
- Zhang A, Wang RK. Feature space optical coherence tomography based micro-angiography. Biomed Opt Express 2015;6:1919-28. [Crossref] [PubMed]
- Reif R, Qin J, An L, Zhi Z, Dziennis S, Wang R. Quantifying optical microangiography images obtained from a spectral domain optical coherence tomography system. Int J Biomed Imaging 2012;2012:509783.
- Wei W, Xu J, Baran U, Song S, Qin W, Qi X, Wang RK. Intervolume analysis to achieve four-dimensional optical microangiography for observation of dynamic blood flow. J Biomed Opt 2016;21:036005. [Crossref] [PubMed]

