
Lumbar intervertebral discs T2 relaxometry and T1ρ relaxometry correlation with age in asymptomatic young adults
Introduction
The intervertebral disc (IVD) is considered the most important structure that ensures the functionality of the human spine (1). Many studies have evaluated the pathophysiology of the IVD degenerative processes and its potential contribution to the appearance of acute and chronic diseases of the lumbar spine (2). Such studies are increasingly common in the global scenario.
Water molecules, proteoglycans, glycosaminoglycans (GAGs) and collagen fibers present in the nucleus pulposus (NP) and annulus fibrosus (AF) are responsible for maintaining the structure and functionality of spinal discs (1,3). The use of quantitative techniques, such as T2 and T1ρ relaxometry, allows for the in vivo analysis of the biochemical composition of IVDs. Recently, these techniques have been increasingly employed in studies of IVD pathophysiology (4). Furthermore, the possibility of a volumetric measurement makes it feasible to calculate the volume of anatomical structures of interest (5).
During the aging process, there is a natural decrease in the percentage of proteoglycans and water accompanied by a concomitant increase in collagen content (6). A decrease in proteoglycans leads to a decrease in the hydrostatic pressure that maintains the integrity of the NP, thereby increasing the tensile forces on the AF and predisposing the nucleus and annulus lamellae to disruption (7). It is believed that the degenerative process begins in the early decades of adulthood, and disc degeneration has indeed been detected at increasingly early ages (8).
The physiological changes of the IVD from childhood to old age have recently been reported (9). However, few studies have focused on the degenerative changes of the IVDs during the early decades of adulthood (8,10-12). Importantly, individuals tend to engage in intense labor or athletic activities in the early decades of adulthood, which represent the ideal period to implement preventative strategies that avoid or minimize future lower back pain and chronic degenerative spinal conditions (13,14).
The aim of the present study was to determine whether T2 and T1ρ relaxometry maps can detect premature aging-related variation in the IVD composition of asymptomatic young adults. We also evaluated the relationship between disc volume and age in this group. Additionally, a possible effect of anthropometric factors in the relaxation times (T2 and T1ρ) and disc volume was explored.
Methods
Sample
It is a prospective, cross-sectional and observational study. Following institutional review board approval (ethical approval ID: 4236/2012), we recruited 90 asymptomatic volunteers (42 men and 48 women) aged between 20 and 40 years old during 1 year. We obtained written informed consent from all of the volunteers. The average age of the participants was 27.1±4.8 years old (20–40 years), their average body mass was 68.36±14.49 kg (44–122 kg), their average height was 1.69±0.09 m (1.46–1.90 m), and their average BMI was 23.4±3.6 kg/m2 (15.9–39.0 kg/m2). To be included in the study, subjects had to be between 20 and 40 years of age, have an Oswestry Disability Index (ODI) score of less than 10, and classified as sedentary or irregularly active according to the International Physical Activity Questionnaire (IPAQ). We did not include individuals who reported persistent low back pain for more than 3 months, or who had spine or hip diseases or previous hip or spine surgery.
Acquisition and image processing
Spinal magnetic resonance imaging (MRI) was performed on all volunteers using a 1.5 T scanner (Achieva, Philips Healthcare, Best, Netherlands) with a 16-channel spine coil (SENSE-SPINE; Philips). The volunteers remained in the supine position with their legs extended and relaxed. Spin-echo sequences were acquired in the sagittal plane to generate quantitative T2 and T1ρ relaxometry maps using identical geometric parameters: FOV =22 cm × 22 cm, thickness =4 mm, slices =16, matrix =256×256 and no gap between slices. The following contrast parameters were used: T2 multiecho sequence, TE =20/40/60/80/100/120/140/160 millisecond (ms) and TR =3,000 ms; T1ρ-prepared MS turbo spin echo sequence, TE =20 ms, TR =2,000 ms, Single phase spin lock (SL) pulse, SL frequency =250 Hz, TSL =2/10/20/40/60 ms. The total image acquisition time was 13 minutes and all exams were acquired on afternoon period.
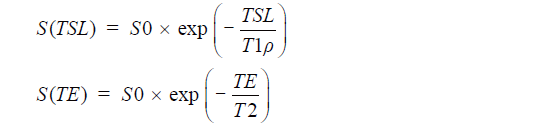
We used MINC tools and Display software (McConell Brain Imaging Center, Montreal, Quebec, Canada) to analyze the images. The relaxometry maps were generated using homemade scripts based on MINC tools from the corresponding data. T1ρ and T2 maps were computed on a pixel-by-pixel basis using an exponential decay model (Figure 1). S0 and S(TSL) are the equilibrium magnetisation signal and T1rho-prepared magnetisation signal with the spin-lock time of TSL. S(TE) is the signal acquired with the echo time (TE):

Five lumbar IVDs were manually segmented to the full extent, i.e., encompassing the complete NP and AF, considering all sagittal slices and taking care not to segment the subchondral bone and vertebral endplate, in the last echo image (TE =160 ms) of the T2 multiecho acquisition (Figure 2A).

Another segmentation was performed using only the central sagittal slice of each lumbar MRI using regions of interest (ROIs) of fixed dimensions (26.77 mm2) and positioned at the NP, anterior annulus fibrosus (AAF) and posterior annulus fibrosus (PAF) (Figure 2B). Our ROI positioning methodology was similar to the manual approach of Mok et al. (15). The nucleus ROI was placed in the most central area of the disc. The annulus ROI were positioned in the most anterior and posterior portions of the disc. A clear separation of NP and inner AF was not possible especially for degenerated discs. The endplates and ligaments would all appear as dark signals on T2-weighted images, therefore, sufficient space was allowed for dark signal band near the endplate, near the anterior border close to the abdominal fat, and near the posterior border close to the spinal fluid.
After the volumetric segmentation, the IVD volumes were obtained from the disc labels. These labels were superimposed in the relaxometry maps to extract T1ρ and T2 values (Figure 3).

A total of 450 discs from 90 patients were manually segmented; none was excluded. One researcher was responsible for the first segmentation of the 450 discs. A second examiner segmented all discs to allow the evaluation of inter-observer reproducibility. The first researcher performed a second segmentation after an interval of 2 months to permit the analysis of intra-observer reproducibility. The researchers responsible for segmentation were previously trained and had 2 years experience in research in quantitative MRI with spinal discs.
Statistical analysis
Intra- and inter-observer agreement was performed using intraclass correlation (ICC) with a confidence interval (CI) of 95%. To verify the distribution of the study variables, we used the Shapiro-Wilk test. Spearman correlation was used to observe the relationships between age, disc volume and BMI and the values obtained using the T2 and T1ρ maps. For comparison between the relaxometry values according to sex, the Mann-Whitney test was performed. Kruskal-Walis test with Dunns post-hoc test was performed to compare NP, AFA and AFP relaxation times. SPSS v. 20 (IBM, Armonk, New York, USA) and GraphPad Prism v. 5 (GraphPad Software, San Diego, California, USA) were used to conduct all of the analyses.
Results
The manual segmentation performed by the researchers showed good intra-observer (ICC =0.92, 95% CI, 0.87–0.95) and inter-observer agreement (ICC =0.92, 95% CI, 0.85–0.95).
Table 1 shows the values of relaxometry for each lumbar disc. The cranial and caudal segments of the lumbar spine, namely L1L2 and L5S1, respectively, had the lowest relaxation time values, while the highest values were observed for the L3L4 central disc segments. A similar trend was observed for the IVD volumes. The average relaxation times for men were T2 =116.0±15.9 ms and T1ρ =51.6±9.1 ms; for women, T2 =114.7±13.7 ms and T1ρ =52.9±12.2 ms. There was no significant difference between men and women for either relaxometry map (T2, P=0.37; T1ρ, P=0.97). The relaxation times of the NP were higher than the anterior and PAF both T2 (Kruskal-Wallis =37.37; P<0.0001) and T1ρ (Kruskal-Wallis =45.49; P<0.0001). In T2 relaxometry there was no difference between the anterior and posterior annulus, however, in the AAF T1ρ relaxometry values were higher than the PAF (Table 2).

Full table

Full table
Figure 4 shows a graphical representation of the relationship between the relaxation times obtained by relaxometry maps and the subject characteristics. There was a negative correlation between age and T2 relaxation time (r=−0.30, P<0.0001) and a positive correlation between disc volume and relaxation time T2 (r=0.15, P=0.002) (Table 3).


Full table
As shown in Table 4, we observed a negative linear correlation between T2 relaxation times and age at all lumbar disc levels (P<0.02 at all levels). There was no correlation between age and volumetry for any disc (P>0.07 at all levels). We also observed no relationship between age and T1ρ values for any disc level (P>0.06 at all levels). BMI, height and weight were not correlated with any lumbar IVD relaxometry measurement.

Full table
Figure 5 is a graphical representation of the T1ρ and T2 discs relaxation times for men and women according to the age. In relaxometry T2 it is possible to perceive a decay in values with aging in men (r=−0.43, P=0.004) and women (r=−0.41, P=0.003). This decrease is slightly more pronounced in men (curve slope =−1.08±0.35) than in women (curve slope =−0.83±0.27).

The stratification of the IVD into NP, AAF and AAF made possible to analyze separately the correlation of each sub-region with ageing (Figure 6). Table 2 shows the correlation values (r) for each disc sub-region (NP, and PAF AAF) at each disc level (L1L2 to L5S1). T2 relaxation times of NP and PAF correlate negatively with aging at all disc levels, except for the sub-region PAF in L5S1 disc. T1ρ relaxometry correlates only with the sub-region NP of L1L2 and L3L4 IVDs.

Discussion
We aimed to verify the possibility of T1ρ and T2 relaxometry maps to detect disc biochemical composition changes related to aging in a population of asymptomatic and sedentary young adults. We found a negative linear correlation between age and lumbar IVD water content, as detected by T2 relaxation times, but we were not able to detect aging related changes in the proteoglycan content of the disc evaluated by T1ρ relaxation times. We also did not find any significant correlation in the same population between IVD volume and age.
Previous reports have shown that relaxometry techniques are sufficiently sensitive to detect the early degenerative processes of the IVD in young adults (4). Most of these studies have focused on relating the relaxometry values with the Pfirrmann classification (10,16-18). This classification, despite being widely used, has several gaps and limitations. An attempt to classify a continuous degeneration process into discrete grades like Pfirrmann will be limited, no grading system can perfectly determine if a particular disc should be classified in a particular category or in the next one (19). To fulfill a gap in the literature we aimed to evaluate whether is possible to identify age-related variations in T1ρ and T2 IVDs relaxation times in asymptomatic young adults.
Our results show that, even in the first two decades of adulthood, increasing age contributed to a decrease in the T2 relaxation time of lumbar discs in asymptomatic subjects. We did not identify the same trend using T1ρ relaxometry. T2 relaxometry is a quantitative technique strongly correlated with the water content present in the IVD (4,20). T1ρ mapping, on the other hand, has a stronger association with the presence of proteoglycan molecules, particularly aggrecan (21). Proteoglycans consist of a protein that is covalently attached to GAG chains (3), which in turn present chondroitin sulfate. These molecules are responsible for generating a negative charge, which attracts and retains water molecules.
Based on our results, we can suggest that, for subjects between 20 and 40 years of age, T2 mapping may be more appropriate than T1ρ mapping and IVD volumetry for the identification of aging-related changes in the lumbar IVDs. The IVD degenerative process begins with the reduction of proteoglycans in the extracellular matrix of the NP, resulting in water loss (3). This phenomenon was detected by T2 relaxometry, where a weak to moderate correlation with aging was observed (Table 2). We observed a slight tendency towards a reduction in the concentration of proteoglycans with age in our asymptomatic young volunteers, but T1ρ mapping was insufficient to detect statistically significant differences in the NP for all the IVD levels (Table 2 and Figure 6B). However, we believe that the minimal loss of proteoglycans led to secondary water loss that was detectable by T2 mapping (Figure 4A-D and Figure 6A,C,E). This relationship remained similar even when stratified the disc values according to gender. T2 PAF relaxometry showed similar behavior to the NP (Figure 6E). Nevertheless, the AAF presented no correlation between relaxometry and aging in our study (Table 2 and Figure 6C,D). Overall, IVDs T2 relaxometry values showed better correlation with aging than T1ρ values in young adults.
A previous report suggests that T1ρ relaxometry is more sensitive than conventional T2-weighted MRI for the detection of early IVD degeneration (22). Yoon et al. (23) showed that T2 relaxation has a stronger correlation with IVD degeneration and morphologic changes than T1ρ in symptomatic patients. Wang et al. identified significant reduction of T1ρ and T2 relaxation times of lumbar IVD with age, however, the relative performances of T1ρ against T2 were broadly similar (24). Our findings favor the concept that T2 relaxometry may be more appropriate to assess initial aging related changes in IVD composition in asymptomatic young adults.
Pfirrmann et al. (25) evaluated these parameters in a sample with a wide age range of 20 to 78 years. In a study of a healthy population, Marinelli et al. (10) also found a progressive reduction in the T2 relaxation time until the fifth decade of life, with a more pronounced reduction between the third and fourth decade. These findings are in agreement with our results. In a study that used semi-quantitative scales to classify the degree of IVD degeneration, Sharma et al. (8) found an increasing prevalence of degeneration of NP from the second to fourth decades of life, with a slight decrease in the third decade.
We found that increasing age in young adults did not induce evident changes in lumbar IVD volume, although changes in the IVD water content were detectable. This is in accordance with previous literature suggesting that disc volume may not be strongly influenced by age during the initial degenerative process, despite some dehydration secondary to the replacement of liquid by fibrous tissue in NP (26). The increased compressive modulus leads to extravasation of water out of the NP extracellular matrix (27), which explains the observed behavior of the T2 relaxation time.
The fact that our sample was composed of subjects with low-level physical activity may be a contributing factor to early dehydration. Gawri et al. (28) noted that moderate physiological loads on the spine can have a positive effect on the production of structural proteins and proteoglycans and can thus retard the degradation of the matrix. Dzierżanowski et al. (29) found that active exercise significantly improves the range of lumbar motion, which increases disc hydration and nutrition and reduces pain in the lower spinal segments. In a systematic review, Lazary et al. (30) noted the importance of physical exercise programs and strengthening exercises to prevent the emergence of disc pathologies. Additionally, those authors emphasize the importance of maintaining an ideal posture as a prophylactic factor that protects against disc degeneration. Our findings corroborate other results in the literature (8,10) and support the conclusion that spinal degenerative or aging processes may begin in young persons.
The relationship between anthropometric characteristics and disc changes is variable. In our study group, we found no correlation between BMI, height or weight and T2 or T1ρ disc relaxation times. Zobel et al. (16) showed previously that IVD composition assessed by relaxometry correlates with BMI in case of overweight.
With respect to detect differences between nucleus and annulus, our results corroborate findings previously reported (12,18,24). The NP relaxation time was higher in both techniques. However T1ρ relaxometry could detect subtle differences between different portions of the annulus as opposed to T2 relaxometry.
There are limitations of our study that deserve mention. Heredity is widely accepted as a strong factor behind disc degenerative changes (31). Unfortunately, we could not control for hereditary effects. Furthermore, a longitudinal study design would be ideal to confirm the effects of age. Our study population was composed of asymptomatic young adults who did not engage in regular physical activity. Therefore, our results may not allow inferences about the physiological variation of biochemical composition of IVDs during aging after 40 years. Additionally, we cannot extrapolate our results for athletes.
A potential application of our results for future clinical research is the appreciation that T2 relaxometry may be more appropriate to assess IVD aging. T1ρ imaging is prone to image artifacts and quantification errors, which remains one of the greatest challenges to adopt this technique in routine clinical practice (18). Additional problems related to high specific absorption rate due to the long duration of spin-lock pulses are present, especially when body RF transmitter rather than local transceiver coil is used (32). The sequence of T1ρ used in this study is the most conventional and simple, in the preparation phase of the magnetization it uses a locking pulse with a single phase. This form is quite affected by field inhomogeneities B1 and B0, bringing a reduction in signal and a faster decay (33,34). Therefore, our reported values were lower compared to other studies (35-37).
We conclude that T2 relaxometry identified gradual disc dehydration related to aging in the first two decades of adulthood in asymptomatic and non-athlete volunteers. T1ρ relaxometry and disc volumetry did not show significant correlation with age in our study group. Our results suggest that T2 relaxometry may be more adequate to detect early aging related IVD changes.
Acknowledgements
We thank the Science Center of Images and Medical Physics of Ribeirão Preto Medical School for their support.
Funding: This study was funded by National Council of Technological and Scientific Development (CNPq, Grant No. 473688/2012-3), Coordination for the Improvement of Higher Level- or Education-Personnel (CAPES, Scholarship Grant No. 01500990612), and Financing of Studies and Projects (FINEP, 01/2006 Ref. 0184/07) of Brazil.
Footnote
Conflicts of Interest: The authors have no conflicts of interest to declare.
Ethical Statement: The study was approved by institutional review board of Ribeirão Preto Medical School, University of São Paulo (No. 4236/2012) and written informed consent was obtained from all patients.
References
- Chan WC, Sze KL, Samartzis D, Leung VY, Chan D. Structure and biology of the intervertebral disk in health and disease. Orthop Clin North Am 2011;42:447-64. vii. [Crossref] [PubMed]
- Hancock MJ, Maher CM, Petocz P, Lin CW, Steffens D, Luque-Suarez A, Magnussen JS. Risk factors for a recurrence of low back pain. Spine J 2015;15:2360-8. [Crossref] [PubMed]
- Colombini A, Lombardi G, Corsi MM, Banfi G. Pathophysiology of the human intervertebral disc. Int J Biochem Cell Biol 2008;40:837-42. [Crossref] [PubMed]
- Lotz JC, Haughton V, Boden SD, An HS, Kang JD, Masuda K, Freemont A, Berven S, Sengupta DK, Tanenbaum L, Maurer P, Ranganathan A, Alavi A, Marinelli NL. New treatments and imaging strategies in degenerative disease of the intervertebral disks. Radiology 2012;264:6-19. [Crossref] [PubMed]
- Kasch R, Mensel B, Schmidt F, Drescher W, Pfuhl R, Ruetten S, Merk HR, Kayser R. Percutaneous disc decompression with nucleoplasty-volumetry of the nucleus pulposus using ultrahigh-field MRI. PLoS One 2012;7:e41497. [Crossref] [PubMed]
- Antoniou J, Steffen T, Nelson F, Winterbottom N, Hollander AP, Poole RA, Aebi M, Alini M. The human lumbar intervertebral disc: evidence for changes in the biosynthesis and denaturation of the extracellular matrix with growth, maturation, ageing, and degeneration. J Clin Invest 1996;98:996-1003. [Crossref] [PubMed]
- Urban JP, Roberts S. Degeneration of the intervertebral disc. Arthritis Res Ther 2003;5:120-30. [Crossref] [PubMed]
- Sharma A, Parsons M, Pilgram T. Temporal interactions of degenerative changes in individual components of the lumbar intervertebral discs: a sequential magnetic resonance imaging study in patients less than 40 years of age. Spine (Phila Pa 1976) 2011;36:1794-800. [Crossref] [PubMed]
- Sivan SS, Wachtel E, Roughley P. Structure, function, aging and turnover of aggrecan in the intervertebral disc. Biochim Biophys Acta 2014;1840:3181-9.
- Marinelli NL, Haughton VM, Anderson PA. T2 relaxation times correlated with stage of lumbar intervertebral disk degeneration and patient age. AJNR Am J Neuroradiol 2010;31:1278-82. [Crossref] [PubMed]
- Niu G, Yang J, Wang R, Dang S, Wu EX, Guo Y. MR imaging assessment of lumbar intervertebral disk degeneration and age-related changes: apparent diffusion coefficient versus T2 quantitation. AJNR Am J Neuroradiol 2011;32:1617-23. [Crossref] [PubMed]
- Menezes-Reis R, Salmon CE, Carvalho CS, Bonugli GP, Chung CB, Nogueira-Barbosa MH. T1ρ and T2 mapping of the intervertebral disk: comparison of different methods of segmentation. AJNR Am J Neuroradiol 2015;36:606-11. [Crossref] [PubMed]
- Soer R, Brouwer S, Geertzen JH, van der Schans CP, Groothoff JW, Reneman MF. Decline of functional capacity in healthy aging workers. Arch Phys Med Rehabil 2012;93:2326-32. [Crossref] [PubMed]
- Janwantanakul P, Pensri P, Jiamjarasrangsri V, Sinsongsook T. Prevalence of self-reported musculoskeletal symptoms among office workers. Occup Med (Lond) 2008;58:436-8. [Crossref] [PubMed]
- Mok GS, Zhang D, Chen SZ, Yuan J, Griffith JF, Wang YX. Comparison of three approaches for defining nucleus pulposus and annulus fibrosus on sagittal magnetic resonance images of the lumbar spine. J Orthop Translat 2016;6:34-41. [Crossref]
- Zobel BB, Vadalà G, Del Vescovo R, Battisti S, Martina FM, Stellato L, Leoncini E, Borthakur A, Denaro V. T1ρ magnetic resonance imaging quantification of early lumbar intervertebral disc degeneration in healthy young adults. Spine (Phila Pa 1976) 2012;37:1224-30. [Crossref] [PubMed]
- Borthakur A, Maurer PM, Fenty M, Wang C, Berger R, Yoder J, Balderston RA, Elliott DM. T1ρ magnetic resonance imaging and discography pressure as novel biomarkers for disc degeneration and low back pain. Spine (Phila Pa 1976) 2011;36:2190-6. [Crossref] [PubMed]
- Chen C, Huang M, Han Z, Shao L, Xie Y, Wu J, Zhang Y, Xin H, Ren A, Guo Y, Wang D, He Q, Ruan D. Quantitative T2 magnetic resonance imaging compared to morphological grading of the early cervical intervertebral disc degeneration: an evaluation approach in asymptomatic young adults. PLoS One 2014;9:e87856. [Crossref] [PubMed]
- Urrutia J, Besa P, Campos M, Cikutovic P, Cabezon M, Molina M, Cruz JP. The Pfirrmann classification of lumbar intervertebral disc degeneration: an independent inter- and intra-observer agreement assessment. Eur Spine J 2016. [Epub ahead of print]. [Crossref] [PubMed]
- Mwale F, Iatridis JC, Antoniou J. Quantitative MRI as a diagnostic tool of intervertebral disc matrix composition and integrity. Eur Spine J 2008;17 Suppl 4:432-40. [Crossref] [PubMed]
- Zuo J, Joseph GB, Li X, Link TM, Hu SS, Berven SH, Kurhanewitz J, Majumdar S. In vivo intervertebral disc characterization using magnetic resonance spectroscopy and T1ρ imaging: association with discography and Oswestry Disability Index and Short Form-36 Health Survey. Spine (Phila Pa 1976) 2012;37:214-21. [Crossref] [PubMed]
- Johannessen W, Auerbach JD, Wheaton AJ, Kurji A, Borthakur A, Reddy R, Elliott DM. Assessment of human disc degeneration and proteoglycan content using T1rho-weighted magnetic resonance imaging. Spine (Phila Pa 1976) 2006;31:1253-7. [Crossref] [PubMed]
- Yoon MA, Hong SJ, Kang CH, Ahn KS, Kim BH. T1rho and T2 mapping of lumbar intervertebral disc: Correlation with degeneration and morphologic changes in different disc regions. Magn Reson Imaging 2016;34:932-9. [Crossref] [PubMed]
- Wang YX, Griffith JF, Leung JC, Yuan J. Age related reduction of T1rho and T2 magnetic resonance relaxation times of lumbar intervertebral disc. Quant Imaging Med Surg 2014;4:259-64. [PubMed]
- Pfirrmann CW, Metzdorf A, Elfering A, Hodler J, Boos N. Effect of aging and degeneration on disc volume and shape: A quantitative study in asymptomatic volunteers. J Orthop Res 2006;24:1086-94. [Crossref] [PubMed]
- Gruber HE, Hanley EN Jr. Ultrastructure of the human intervertebral disc during aging and degeneration: comparison of surgical and control specimens. Spine (Phila Pa 1976) 2002;27:798-805. [Crossref] [PubMed]
- Périé D, Iatridis JC, Demers CN, Goswami T, Beaudoin G, Mwale F, Antoniou J. Assessment of compressive modulus, hydraulic permeability and matrix content of trypsin-treated nucleus pulposus using quantitative MRI. J Biomech 2006;39:1392-400. [Crossref] [PubMed]
- Gawri R, Moir J, Ouellet J, Beckman L, Steffen T, Roughley P, Haglund L. Physiological loading can restore the proteoglycan content in a model of early IVD degeneration. PLoS One 2014;9:e101233. [Crossref] [PubMed]
- Dzierżanowski M, Dzierżanowski M, Maćkowiak P, Słomko W, Radzimińska A, Kaźmierczak U, Strojek K, Srokowski G, Zukow W. The influence of active exercise in low positions on the functional condition of the lumbar-sacral segment in patients with discopathy. Adv Clin Exp Med 2013;22:421-30. [PubMed]
- Lazary A, Szövérfi Z, Szita J, Somhegyi A, Kümin M, Varga PP. Primary prevention of disc degeneration-related symptoms. Eur Spine J 2014;23 Suppl 3:S385-93. [Crossref] [PubMed]
- Battié MC, Videman T, Parent E. Lumbar disc degeneration: epidemiology and genetic influences. Spine (Phila Pa 1976) 2004;29:2679-90. [Crossref] [PubMed]
- Collins CM, Wang Z. Calculation of radiofrequency electromagnetic fields and their effects in MRI of human subjects. Magn Reson Med 2011;65:1470-82. [Crossref] [PubMed]
- Witschey WR 2nd, Borthakur A, Elliott MA, Mellon E, Niyogi S, Wallman DJ, Wang C, Reddy R. Artifacts in T1 rho-weighted imaging: compensation for B(1) and B(0) field imperfections. J Magn Reson 2007;186:75-85. [Crossref] [PubMed]
- Wheaton AJ, Borthakur A, Charagundla SR, Reddy R. Pulse sequence for multislice T1rho-weighted MRI. Magn Reson Med 2004;51:362-9. [Crossref] [PubMed]
- Wang YX, Zhao F, Griffith JF, Mok GS, Leung JC, Ahuja AT, Yuan J. T1rho and T2 relaxation times for lumbar disc degeneration: an in vivo comparative study at 3.0-Tesla MRI. Eur Radiol 2013;23:228-34. [Crossref] [PubMed]
- Wei F, Zhong R, Zhou Z, Wang L, Pan X, Cui S, Zou X, Gao M, Sun H, Chen W, Liu S. In vivo experimental intervertebral disc degeneration induced by bleomycin in the rhesus monkey. BMC Musculoskelet Disord 2014;15:340. [Crossref] [PubMed]
- Yue ZJ, Liu RY, Lu Y, Dong LL, Li YQ, Lu EB. Middle-period curative effect of posterior lumbar intervertebral fusion (PLIF) and interspinous dynamic fixation (Wallis) for treatment of L45 degenerative disease and its influence on adjacent segment degeneration. Eur Rev Med Pharmacol Sci 2015;19:4481-7. [PubMed]

