
Quantitative comparison of dose distribution in radiotherapy plans using 2D gamma maps and X-ray computed tomography
Introduction
In radiotherapy the tumor control is directly correlated to the prescribed dose. The truly delivered dose is expected to be as close as possible to the prescribed dose. This depends on the accuracy and performance of the dose calculation algorithm which converts the prescribed dose into monitor units to perform the irradiation of the patient. Many years ago, the delivered dose was calculated considering homogeneous tissues densities equivalent to water, whatever their real densities. The advanced dose calculation algorithms, integrated in treatment planning system (TPS), such as collapsed-cone convolution (CCC), anisotropic analytical algorithm (AAA), and more recently Acuros XB® have remarkably improved the accuracy of dose calculation, especially by taking fully account of real tissue density and by introducing more realistic electron transport models (1-7). These new algorithms have been rapidly integrated and used in the clinical practice of radiation oncology. However, a critical point is the discrepancy between these fast changing dosimetric methods regarding the long delay necessary to assess the clinical outcomes, in particular the benefits/risks balance. Risks could increase if we ignore the limits of this new generation of TPS, especially for thoracic irradiations due to the lung heterogeneity. The purpose of this paper is to illustrate a method to evaluate and quantify the consequences of the use of algorithms taking account of electrons transport on dose distribution calculated for lung, in one hand. In the other hand, to determine how dose volume histogram (DVH) metrics correlate with local difference in dose distribution using 2D gamma index (γ). We have evaluated if the dose difference correlates with γ passing rates and if an adjustment of the prescribed dose is necessary to reproduce clinical results similar to those acquired with the former algorithms.
Methods
Treatment plans
This study is based on twelve radiotherapy treatment plans for lung cancer. A computed tomography (CT-scan) was carried out for each patient, then the images were loaded into Eclipse® TPS (Varian Medical Systems, Palo Alto, CA). The target volumes, including the security margins and the organs at risks, were delineated by the radiation oncologist. The treatments were performed with 18 MV photons. The conventional radiation course varied from 50 to 66 Gy in fractions of 2 Gy. The plans were initially calculated with Modified Batho (MB) density correction method, and then recalculated with AAA using the same prescribed dose. MB does not model the change in lateral transport of electrons, but use the electron density information in one dimension (1D) along a ray path from the source to the point of interest (8-10). The dose distribution using AAA is obtained by the superposition of the doses from the photons and electrons convolutions (11,12).
Evaluation of radiotherapy treatment plans
Figure 1 shows the flowchart of the comparison of dose calculation algorithms including 2D γ-maps, dosimetric and statistical analysis.

Quantification of dose differences according to the 2D γ-index
The impact of secondary electrons on heterogeneity correction was analyzed using the two dimensional (2D) γ-index by comparing the dose distributions from MB and AAA (13-15). The DICOM images were exported for each patient from TPS to RIT-113® (Dosimetry System Version 5.2, Radiological Imaging Technology, Inc., CO). The results were displayed using 2D γ-maps showing the pixels with γ-values greater than one, which were outside of tolerance range. In order to discriminate over/under-estimated dose, a color code was attributed to the dose difference (ΔDose). Six criteria levels were applied and analyzed: 1%/1, 2%/2, 3%/3, 4%/4, 5%/5 and 6%/6 mm. For each criteria level, the results from 2D γ-index, including the γ-passing rates (γrates) which are indicating the number of voxels with γ≤1, mean gamma (γmean) with standard deviation (γSD) and maximum gamma (γmax) were evaluated. The dose difference in percentage was calculated as:

Dose volume histograms metrics
The dosimetric effects on the target coverage was firstly quantified using dosimetric parameters provided by the cumulative and differential dose volume histograms [cDVH, dDVH] for each radiotherapy plan. For each target the minimum dose (Dmin), mean dose (Dmean), maximum dose (Dmax), as well as the calculated dose to 95% of the target volume (D95) were compared. In addition, the Coverage Index (COI), Conformity Index for the target volume (CITV) and S-index were calculated to determine the setup effects on dose distribution (16-18):
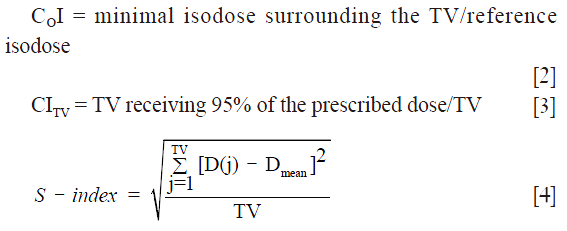
where D(j) is the relative dose in the lesion voxel j, Dmean is the average relative dose in the lesion and TV is the target volume built of elementary voxels.
Statistical analysis
The DVH metrics and the results from 2D γ-index were included in the analysis. A bootstrap simulation method with 1,000 random samplings was used to calculate the 95% confidence interval (95% CI) (19). The correlation coefficients (ρ) from Spearman’s rank correlation test were analyzed to assess inter-variable correlation between DVH metrics from MB and AAA, and γ-index with ΔDVH. The Wilcoxon signed rank test was used to calculate the P value. A bilateral statistical test was carried out with an error α=5%, corresponding to 95% CI. The dose difference is considered significant when P<0.05.
Results
2D gamma maps
We observed that to satisfy the tolerance 95% of pixels with γ≤1, the criteria 6%/6 mm was needed at least. The Figure 2 shows the results of γ including γmean, γmax and γSD for all the sets of γ criteria. The Figure 3A shows the isodose curves calculated using MB and AAA and the Figure 3B shows an example of 2D γ-maps. The red and blue coloring indicate when γ>1 and identify overestimated dose (DAAA > DMB) or underestimated dose (DAAA < DMB), respectively.


Quantification of the impact on dose volume histogram (DVH) metrics
The Figure 4 shows the cumulative and differential DVH from MB and AAA. It takes account of the electrons transport in lateral directions, which causes a decrease of dose for all parameters evaluated in this study. The simulated 95% CIs with bootstrap for ΔDmin, ΔDmean, ΔD95 and ΔDmax in percentage were, respectively, [7.3; 10.1], [1.5; 2.2], [5.5; 8.2] and [1.0; 3.0]. The Wilcoxon test showed a significant difference with P<0.01, except for the maximum dose. The Figure 5 shows the correlation matrix for DVH metrics obtained from MB and AAA.


The 95% CIs for CITV were respectively [0.91; 0.97] and [0.7; 0.8] using MB and AAA, with P<0.01. The 95% CIs for COI were respectively [0.8; 0.9] and [0.7; 0.8] using MB and AAA, with P<0.01. Similarly, AAA was predicting more heterogeneous dose in the target predicting more values for S-index. Thus, the 95% CIs for S-index were [1.2; 2.9] using MB method and [2.4; 4.1] using AAA method, with P<0.01.
Correlation between γ-index and ∆DVH metrics
The Figure 6 shows the correlation coefficients (ρ) obtained from Spearman’s test for γrates or γmean with ∆DVH metrics. A good correlation between γrates, resulting from 1%/1, 2%/2 or 3%/3 mm, with ∆Dmin, ∆Dmax and ∆COI, can be seen. A similar correlation between γmean and ∆DVH metrics was also observed.

Discussion
Numerous studies have evaluated the impact of dose calculation algorithms on dosimetric data for lung irradiations using 1D or 3D methods, equivalent tissue air ratio, AAA, Acuros XB and the most accurate Monte Carlo (MC) algorithm (18,20-25). They reported that the most accurate dose calculation algorithms had a significant impact on DVH metrics and radiobiological indices.
However, this study highlights the discrepancies which can be observed when estimating the dose, in the same patient, taking account or not of the electrons transport, respectively with AAA or MB. This is the first study, which evaluates the amplitude of this effect on DVH and target coverage using 2D γ-index. In this context, dose differences were expected, but the magnitudes of the discrepancies are very remarkable and considerable, since the lung density is lower compare to other tissues. MB-1D overestimated the target coverage producing treatment plans looking better. However, this study confirms that using AAA, which models the lateral electron transport, the target coverage and the dosimetric data are degraded, compared to the MB-1D density correction. For example, it can be seen in Figure 3 that the 95% isodose, presented in green color, does not cover the target at all with AAA. This will affect the target coverage by the reference isodose. The 100% isodose curve, presented in red color, was less extended in lateral direction indicating less maximum dose in the target. This is due to the fact that the dose of the secondary electrons is transported farer through the lung. As a result, this will introduce more heterogeneous dose distribution, explaining the over/under estimated dose compared to former algorithms.
The γ analysis in 2D showed that the difference between MB and AAA could reach up to ±10%. Therefore, the tolerance level of 95% pixels with γ≤1 was not respected using the routinely γ tolerance 2%/2 mm or 3%/3 mm for quality assurance. Actually the 6%/6 mm criteria were needed to satisfy the required tolerance. The γ-maps, presented in blue color, confirmed that the dose in the beam entrance in the target would be decreased with AAA compared to MB. In the other hand, the extension of secondary electrons, presented in red color, was increased around the healthy lung and organs at risks. This may introduce higher delivered dose for organs at risks, and, as a result, this will predicted more toxicity for healthy lung.
We strongly advise to ascertain better knowledge about the new algorithms before integrating them in radiation oncology department. The γ approach might be a valuable solution to make a medical decision about the need or not for adjustment of the prescribed dose. However, this study has some limits. The dose calculation algorithm is based on AAA. Currently, more advanced algorithms such as Acuros XB in Eclipse® or CCC integrated in Pinnacle® (Philips Radiation Oncology Systems, Fitchburg, WI) are available for dose calculations. We compared radiotherapy plans using 18 MV, but the use of 6 MV is preferred to treat the lung cancer due to the significant loss of lateral dose equilibrium for high energy in the low density medium (26). In this context, MC simulation could bring more accurate information about extended lateral range of electrons in low density, and provides a quantitative estimation of lateral and longitudinal effects. Nevertheless, the computation time with MC method is not fast enough to be clinically integrated within a TPS yet. The 2D gamma method can be used to quantify the dose difference between former algorithms and future MC algorithm. The appropriate γ criteria must be assessed to better estimate the correlation between DVH metrics from MC with γ passing rates.
Conclusions
In this study, we evaluated the dosimetric effects resulting from the transport of electrons on lung radiotherapy treatment plans. We observed a significant effect on the target coverage and the dosimetric data. We revealed the advantage of gamma analysis to show the spatial information about the local dose difference in the target, and the limitations in the use of DVH parameters in evaluating and comparing treatment plans. Significant differences in the delivered dose and D95 were observed between MB-1D and AAA considering that AAA represents the (almost) true delivered dose. This shows that readjusting the prescribed dose and/or optimizing the protection of the organs at risks should be taken into consideration when using more advanced algorithms in order to obtain the best possible clinical outcome.
Acknowledgements
None.
Footnote
Conflicts of Interest: The authors have no conflicts of interest to declare.
References
- Rana S. Clinical dosimetric impact of Acuros XB and analytical anisotropic algorithm (AAA) on real lung cancer treatment plans Int J Cancer 2014;2:02019. review.
- Ojala J. The accuracy of the Acuros XB algorithm in external beam radiotherapy – a comprehensive review. Int J Cancer 2014;2:020417.
- Bush K, Gagne IM, Zavgorodni S, Ansbacher W, Beckham W. Dosimetric validation of Acuros XB with Monte Carlo methods for photon dose calculations. Med Phys 2011;38:2208-21. [Crossref] [PubMed]
- Aarup LR, Nahum AE, Zacharatou C, Juhler-Nøttrup T, Knöös T, Nyström H, Specht L, Wieslander E, Korreman SS. The effect of different lung densities on the accuracy of various radiotherapy dose calculation methods: implications for tumour coverage. Radiother Oncol 2009;91:405-14. [Crossref] [PubMed]
- Bragg CM, Conway J. Dosimetric verification of the anisotropic analytical algorithm for radiotherapy treatment planning. Radiother Oncol 2006;81:315-23. [Crossref] [PubMed]
- Ahnesjö A. Collapsed cone convolution of radiant energy for photon dose calculation in heterogeneous media. Med Phys 1989;16:577-92. [Crossref] [PubMed]
- Vanderstraeten B, Reynaert N, Paelinck L, Madani I, De Wagter C, De Gersem W, De Neve W, Thierens H. Accuracy of patient dose calculation for lung IMRT: A comparison of Monte Carlo, convolution/superposition, and pencil beam computations. Med Phys 2006;33:3149-58. [Crossref] [PubMed]
- Task Group No.65, the Radiation Therapy Committee of the American Association of Physicists in Medicine. Tissue inhomogeneity corrections for MV photon beams. Madison, WI: Medical Physics Publishing, 2004.
- Batho HF. Lung corrections in cobalt 60 beam therapy. J Can Assoc Radiol 1964;15:79-83. [PubMed]
- El-Khatib E, Battista JJ. Improved lung dose calculation using tissue-maximum ratios in the Batho correction. Med Phys 1984;11:279-86. [Crossref] [PubMed]
- Sievinen J, Ulmer W, Kaissl W. AAA Photon Dose Calculation Model in Eclipse. Palo Alto (CA): Varian Medical Systems, 2005. [RAD #7170B].
- Gagné IM, Zavgorodni S. Evaluation of the analytical anisotropic algorithm in an extreme water-lung interface phantom using Monte Carlo dose calculations. J Appl Clin Med Phys 2006;8:33-46. [Crossref] [PubMed]
- Low DA, Harms WB, Mutic S, Purdy JA. A technique for the quantitative evaluation of dose distributions. Med Phys 1998;25:656-61. [Crossref] [PubMed]
- Spezi E, Lewis DG. Gamma histograms for radiotherapy plan evaluation. Radiother Oncol 2006;79:224-30. [Crossref] [PubMed]
- Chaikh A, Giraud JY, Balosso J. A 3D quantitative evaluation for assessing the changes of treatment planning system and irradiation techniques in radiotherapy. Int J Cancer 2014;2:02033.
- Yoon M, Park SY, Shin D, Lee SB, Pyo HR, Kim DY, Cho KH. A new homogeneity index based on statistical analysis of the dose-volume histogram. J Appl Clin Med Phys 2007;8:9-17. [PubMed]
- Feuvret L, Noël G, Mazeron JJ, Bey P. Conformity index: a review. Int J Radiat Oncol Biol Phys 2006;64:333-42. [Crossref] [PubMed]
- Chaikh A, Giraud JY, Balosso J. A method to quantify and assess the dosimetric and clinical impact resulting from the heterogeneity correction in radiotherapy for lung cancer. Int J Cancer Ther Oncol 2014;2:020110. [Crossref]
- Chaikh A, Giraud JY, Perrin E, Bresciani JP, Balosso J. The choice of statistical methods for comparisons of dosimetric data in radiotherapy. Radiat Oncol 2014;9:205. [Crossref] [PubMed]
- Chetty IJ, Devpura S, Liu D, Chen D, Li H, Wen NW, Kumar S, Fraser C, Siddiqui MS, Ajlouni M, Movsas B. Correlation of dose computed using different algorithms with local control following stereotactic ablative radiotherapy (SABR)-based treatment of non-small-cell lung cancer. Radiother Oncol 2013;109:498-504. [Crossref] [PubMed]
- Liu MB, Eclov NC, Trakul N, Murphy J, Diehn M, Le QT, Dieterich S, Maxim PG, Loo BW Jr. Clinical impact of dose overestimation by effective path length calculation in stereotactic ablative radiation therapy of lung tumors. Pract Radiat Oncol 2013;3:294-300. [Crossref] [PubMed]
- Hedin E, Bäck A. Influence of different dose calculation algorithms on the estimate of NTCP for lung complications. J Appl Clin Med Phys 2013;14:127-39. [PubMed]
- Chandrasekaran M, Panettieri V, Baker C, Nahum AE. The clinical impact of differences in photon dose algorithms: 3DCRT and SBRT of lung tumors. Radiother Oncol 2011;99:S427-S428. [Crossref]
- Huang BT, Lu JY, Lin PX, Chen JZ, Li DR, Chen CZ. Radiobiological modeling analysis of the optimal fraction scheme in patients with peripheral non-small cell lung cancer undergoing stereotactic body radiotherapy. Sci Rep 2015;5:18010. [Crossref] [PubMed]
- Chaikh A, Giraud JY, Balosso J. Clinical comparison of density correction methods associated with Pencil Beam Convolution algorithm for clinical situations. Medical physics international Journal 2014;1:49-53.
- Wang L, Yorke E, Desobry G, Chui CS. Dosimetric advantage of using 6 MV over 15 MV photons in conformal therapy of lung cancer: Monte Carlo studies in patient geometries. J Appl Clin Med Phys 2002;3:51-9. [Crossref] [PubMed]

