
Breath-hold black blood quantitative T1rho imaging of liver using single shot fast spin echo acquisition
Introduction
Liver fibrosis is a key feature in most chronic liver diseases. It can lead to liver cirrhosis, terminal liver failure, and hepatocellular carcinoma. Currently, the golden standard for diagnosis of liver fibrosis is biopsies. Biopsies, however, is invasive and carries risks of complications (1). A noninvasive, robust, and reliable method for assessment of liver fibrosis would provide important benefits for clinical care and research, such as development of novel pharmacological strategies to treat hepatic fibrosis (2).
T1rho, which measures the spin-lattice relaxation time in the rotating frame, is a valuable biomarker for assessment of tissue macromolecular environment. With preclinical study on rat liver, Wang et al. (3) reported that increase in T1rho values with increase in the stage of fibrosis. In the following clinical studies, it was reported that middle- to late-staged fibrotic liver has proportionately elevated T1rho value compared to normal liver (4-6). Recently, Singh et al. (7) reported that statistically significant correlation between stages of fibrosis and T1rho values was observed in human subjects; however, this study is limited to small sample size. Another recent study by Takayama et al. (8) shows that T1rho has potential as a biomarker of liver function in patient with chronic liver disease.
Currently it remains inconclusive whether T1rho imaging can be used for detection of early stage liver fibrosis. An obstacle to clinical evaluation is the lack of robust methods for quantitative T1rho imaging of liver in human subjects. Liver is rich in blood vessels that may contribute to elevated T1rho measurement of parenchyma (5,9). The presence of bright blood signal also increases sensitivity of T1rho quantification to motion. As reported in literatures (5,9), even minor spatial misregistration between images acquired with different time-of-spinlock (TSL) can lead to artificially high T1rho measurement of liver parenchyma. Technical improvements are required for further clinical studies and translation of T1rho imaging in liver.
There are a number of pulse sequences reported for quantitative T1rho imaging (10-20). Table 1 is a summary of the pulse sequences that have been used for T1rho quantification of liver. Note most of them are based on fast gradient echo acquisitions without suppression of blood signal. Blood vessels display bright signal intensity in these sequences and care is needed to avoid quantification error from blood signal. Most of these methods were reported of being implemented with multiple breath-holds or respiratory triggering for motion compensation, which is difficult to prevent small motion displacement between images acquired at different TSLs. Recently Singh et al. (7) reported a single slice acquisition with a breath-hold of 12 seconds at 1.5 T. However, the maximum TSL is limited to 30 ms that is suboptimal for T1rho quantification of liver, as healthy liver parenchyma can have T1rho value larger than 40 ms (22) and those with fibrosis even higher T1rho value.

Full table
Fast/turbo spin echo (FSE/TSE) has been used for quantitative T1rho imaging of knee and brain (10,20,25). In this study we proposed a pulse sequence for quantitative T1rho imaging of liver based on single shot fast/turbo spin echo (SSFSE/SSTSE) acquisition. We used the inherent black blood effect of SSFSE and combine it with double inversion recovery (DIR) (26) to achieve suppression of blood signal. Two main factors affecting suppression of blood signal when using FSE acquisition are the flip angle of refocusing RF pulses and the echo time (27,28). In this work, we presented theoretical analysis based on the extended phase graph algorithm (EPG) (29-31) to demonstrate that T1rho measurement is insensitive to the variation of these parameters when using FSE acquisition, which provides flexibility to optimize the proposed pulse sequence for black blood effect and other image qualities. This is potentially an important advantage of the proposed approach as it has been reported in literatures that T1rho quantification based on the segmented gradient echo acquisition and balanced SSFP acquisition does depend on the choice of flip angles and the location where the data at the center of k-space is acquired (15,16).
Materials and methods
MR pulse sequence
Figure 1 shows a scheme diagram of the proposed pulse sequence for 2D quantitative T1rho imaging of liver. The pulse sequence starts with a 90 degree RF pulse followed with crusher gradients to reset net magnetization, which assures the signal is constant at the beginning of T1rho-prep (15). A long T1 recovery time is followed to allow longitudinal signal recovery before T1rho-prep. Spectral attenuated inversion recovery (SPAIR) with T1 nulling time at the beginning of T1rho-prep was used for fat suppression. A RF pulse cluster which has simultaneous compensation of B1 RF and B0 field inhomogeneity is used for T1rho-prep (32).

Differently to the previously reported methods used for T1rho quantification of liver, SSFSE is used in the proposed pulse sequence. The echo train of SSFSE starts with a few refocusing RF pulses with tailored flip angle to establish pseudo steady state followed with a RF train with constant flip angle. SSFSE requires the CPMG condition to avoid image artifacts and achieve high signal-to-noise efficiency. For liver imaging, the large field of view (FOV) may result in phase error from eddy current that can cause violation of the CPMG condition. Effective phase correction is important for the proposed pulse sequence to maintain robust T1rho quantification. We use the dummy gradient approach (Philips Healthcare, Best, the Netherlands) to compensate eddy current during FSE echo train. The crusher gradient used at the end of T1rho-prep can result in short-term eddy current effect in FSE acquisition. A 2-ms delay was added after T1rho-prep to address the short-term eddy current from these crusher gradients (33).
One of the major advantages to use SSFSE is that the blood flow cannot maintain CPMG condition, which provides SSFSE an inherent black blood effect. SSFSE alone may be insufficient for blood suppression, particularly along through-slice direction (34). We combine the DIR (26) with SSFSE to achieve improved black blood effect in our pulse sequence.
T1rho-prep is susceptible to the off-resonance effect. Therefore, it is desirable to suppress fat signal within liver. In our pulse sequence, we use SPAIR, which applies a 180 degree adiabatic inversion pulse tune to the fat resonance. The time delay of SPAIR is chosen such that fat signal is zero at the beginning of T1rho prep. The same strategy of fat suppression was used in reference (15). To improve the robustness of fat suppression under non-ideal imaging environment, we employ the gradient reversal technology (35) in addition to SPAIR for fat suppression, where the polarity of the slice selective gradient of the refocusing RF pulses is reversed compared to that of the excitation RF pulse, and therefore fat is not refocused during FSE train.
Extended phase graph (EPG) analysis of quantification accuracy
In FSE acquisitions, two main factors affecting suppression of blood signal include the flip angle of refocusing RF pulses and the echo time (27,28). These two parameters are also critical to reduce image blurring. Here we use the EPG algorithm (29-31) to demonstrate that for the proposed pulse sequence, the choices of the refocusing flip angle and the echo time do not impact T1rho quantification as long as SNR is sufficient. This feature provides flexibility to optimize the pulse sequence for black blood effect.
Following the EPG algorithm summarized by Busse et al. (30), we let  and
and  be the Kth -order configuration of transverse magnetization and longitudinal magnetization, respectively. The signal at the nth echo within the echo train is characterized by the 0th order transverse configuration
  . If the magnetization after the 90-degree excitation RF pulse is purely transverse, we have:

where  is the magnetization after T1rho-prep. The transverse and longitudinal configurations at the nth echo in echo train, and , can be calculated as linear combinations of the configurations at the (n-1)th echo, based on three processes involved which include precession due to gradient and off-resonance, nutation due to refocusing RF pulse, and T1 and T2 relaxation (30). By iteratively applying these linear operations and trace back to the first echo with initial condition given in Eq. [1], the transverse signal at the nth echo can be expressed as:

where  . are the flip angle of the refocusing RF pulses, and
  is a constant scaling factor which is a function of T1, T2 and the flip angles.
B1 inhomogeneity causes the flip angle of the excitation RF pulse to deviate from 90-degree. If the flip angle of the excitation RF pulse is θ, we have:

Similarly to the derivation of Eq. [2], we have:
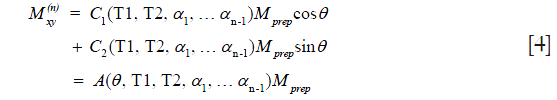
where  is a constant scaling factor which is a function of θ, T1, T2 and the refocusing flip angles.
Eqs. [2] and [4] indicate that the non-90 degree excitation induced by B1 inhomogeneity, the choice of echo time, and the refocusing flip angle only affects the scaling and not the relaxation profile stored in . Therefore, if is a mono-exponential decay function of TSL, quantification of T1rho by fitting data to a mono-exponential relaxation model is valid if imaging data is acquired with FSE. This is advantageous compared to the other acquisition methods. As reported by Li et al. (15), when using fast gradient echo acquisitions, the T1 relaxation during echo train can compromise the magnetization contrast imparted by the T1rho-prep and result in a complicated signal profile. Witschey et al. (16) also shows T1rho measurement is dependent on the flip angle and location of the center of k-space acquired in echo train when using balanced SSFP acquisition.
Figure 2 illustrates the property described by Eqs. [2] and [4]. For 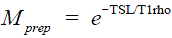 . , the signal profile along the FSE echo train was calculated using the EPG algorithm with various choices of the excitation and refocusing flip angles. Note for any given echo along the echo train, regardless of the excitation and refocusing flip angles, the relaxation rate in the mono-exponential decay imparted in is preserved accurately.

Simulation
We used EPG algorithm to simulate signal profile of SSFSE readout after T1rho-prep. The magnetization was prepared with TSL 0, 10, 30 and 50 ms, respectively. For comparison, we also simulated transient signal with spoiled gradient echo acquisition after T1rho prep with the same TSLs. The other parameters used for simulation include T1 900 ms, T2 35 ms and T1rho 40 ms. TR is 4.5 ms for spoiled gradient echo acquisition. Without losing generality, the initial magnetization prior to spinlock is assumed to be 1. The signal profile was Fourier transformed to spatial domain and then fit to a mono-exponential model to quantify T1rho. We measured T1rho value with the combination of the variation of the following acquisition parameters: flip angle, the location in echo train where the center of k-space was acquired, and echo train length. For SSFSE, we simulated data with two flip angles of the excitation RF pulse (60 and 90 degree), and three refocusing RF trains, including two constant flip angle trains (90 and 180 degree) and one variable flip angle train. For spoiled gradient echo acquisition, we simulated data with six constant flip angle train, including Ernst angle (5.7 degree), 1, 3, 10, 15 and 20 degree. For both SSFSE and spoiled gradient echo acquisition, data sets were simulated when the center of k-space was acquired at the 1st and 3rd echo in echo train, respectively, and with echo train length 1 and 10, respectively. The combination of these parameters formed 24 data sets with SSFSE acquisition and 24 data sets with spoiled gradient echo acquisition.
MR imaging
The volunteer studies were conducted with the approval of the Institutional Review Board (IRB). Data were collected from a Philips Achieva TX 3.0 T scanner equipped with dual transmit (Philips Healthcare, Best, the Netherlands). A 32 channel cardiac coil (Invivo Corp, Gainesville, USA) was used as receiver and body coil was used as transmit. RF shimming was applied to reduce B1 inhomogeneity. The subjects were scanned in supine position. Two-dimensional axial images were acquired with phase encoding along anterior-posterior direction. Four sets of images with TSL 0, 10, 30 and 50 ms were acquired for T1rho quantification. The spinlock frequency was 500 Hz. The parameters for MR imaging included: TR/TE 2,500/15 ms, in-plane resolution 1.5 mm × 1.5 mm, slice thickness 6 mm, SENSE acceleration factor 2, half scan factor (partial Fourier) 0.6, number of signal averaging 1, delay time for SPAIR 250 ms, and delay time for DIR 720 ms. Note with these timing of the pulse sequence, the T1 recovery time (shown in Figure 1) is 2,240 ms. Assume liver has T1 900 ms at 3 T, the magnetization of liver recovers to about 92% of that at equilibrium state with this T1 recovery time. The k-space was scanned in low-high profile order, i.e., it starts with center of k-space then gradually steps to high frequency region. Data sets were acquired with different level of blood suppression. The entire single slice T1rho data sets with four spinlock time were acquired within a single breath-hold of 10 seconds.
To validate the EPG analysis and simulation, we also performed multiple in vivo knee scans. The subject was scanned with transreceiver knee coil (Invivo Corp, Gainesville, USA). The knee scan was repeated 61 times with the excitation flip angle ranging from 65 to 125 degree, the refocusing flip angle ranging from 50 to 120 degree, and TE ranging from 5 to 30 ms. Same imaging parameters described previously were used for knee scan.
Image analysis
Image analysis was implemented in Matlab R2015a (Mathworks, USA). For liver data, a small window with size 4 by 4 was used to smooth the images to increase signal-to-noise ratio (SNR) prior to T1rho quantification. The four images with different TSL were fitted to a mono-exponential model to calculate T1rho map. Non-linear least square fit with the Levenberg-Marquardt algorithm was used for fitting.
Results
Figure 3 shows the simulation results. Note regardless of the flip angle of the RF pulses, the echo train length, and the echo time, T1rho prep with SSFSE acquisition gave the correct T1rho quantification. In contrast, T1rho prep with spoiled gradient acquisition gave correct T1rho quantification when echo train length is 1 and the data acquisition started at the beginning of the echo train. When echo train length increased and/or the center of k-space was not acquired at the beginning of the echo train, the T1rho measured from transient signal of spoiled gradient echo acquisition deviated from the correct T1rho value. This is consistent to what has been discussed by Li et al. (15).

For the 61 knee scans acquired with various flip angles of the excitation and refocusing RF pulse, and echo time, we measured T1rho on ROIs from three groups of muscle. The three ROIs are chosen to have relatively uniform tissue distribution and the mean of the image intensity within each ROI was fit to a mono-exponential model to calculate the mean T1rho value within this ROI. The mean and standard deviation of the measured T1rho within three ROIs across 61 experiments are 32.3±0.4, 31.2±0.3 and 31.5±0.4 ms, respectively. The corresponding coefficient of variation (CV) is 1.29%, 1.03%, and 1.33%, respectively.
Figure 4 shows the acquired T1rho-preped images with different level of blood suppression and the corresponding T1rho map. The three scans were acquired with refocusing flip angle 120, 90 and 75, respectively. TE was same for all three scans. The first two scans had no DIR and the third scan had DIR. Note T1rho-preped SSFSE images acquired with relatively large flip angle had poor blood suppression. By reducing the flip angle of the refocusing RF pulses, blood suppression was improved and image blurring was reduced. However, residual blood signal is visible. By combining DIR with SSFSE acquisition with small refocusing flip angle, blood signal in liver was greatly reduced. Note the improved blood suppression resulted in significantly reduced T1rho value in liver parenchyma.

Discussion
In this study we demonstrated the feasibility to obtain singe slice T1rho map of liver within a single breath-hold of 10 seconds at 3.0 T filed strength with 500 Hz spinlock frequency. Recently, Singh et al. reported single breath-hold acquisition of 12 seconds at 1.5 T field strength with maximum TSL of 30 ms (7). Higher field strength can impose further restriction on the maximum duration of the spinlock RF pulse. Parallel transmit provides reduced SAR compared to conventional transmit. Our scanner is configured with dual-transmit and the SAR of our pulse sequence is within the FDA limit under this configuration.
SSFSE is a standard clinical sequence for anatomical assessment of liver. We demonstrated that it was feasible to tune the refocusing flip angle and the echo time in the proposed pulse sequence without altering mono-exponential relaxation model for T1rho quantification. Desired image contrast can be obtained by tuning refocusing flip angle and echo time. Therefore, the proposed pulse sequence potentially can be used for simultaneous anatomical and biochemical (T1rho) assessment of liver, which may facilitate its incorporation into clinical protocol.
Singh et al. (24) previously reported a blood suppression method for quantitative T1rho imaging of liver. In this method, a non-selective 180 degree RF pulse was applied to invert water signal and then a delay time was chosen so that the blood signal was zero at delay time. This method has advantage that it does not rely on flow property of blood. However, it results in signal loss of liver tissue. With the same timing of our MRI pulse sequence, and assume T1 of blood and liver are 1,600 and 900 ms, respectively, the magnetization of liver tissue recovers to 22% of that at equilibrium state if using this method, whereas the magnetization of liver recovers to 92% of that at equilibrium state using the proposed pulse sequence.
Even though T1 relaxation can result in prolonged T1rho measurement when using segmented gradient echo acquisition methods, it may still provide valid differentiation of T1rho at different state if such prolongation is comparable at these states. Therefore, it may be feasible to differentiate liver at normal and diseased state using the gradient echo methods if the prolongation of T1rho value from spoiled gradient echo acquisition is comparable for normal and diseased liver tissue.
Reduction of refocusing flip angle in FSE acquisitions increases its sensitivity to motion. It has been noticed that SSFSE with small refocusing flip angle applied in liver imaging can result in shading at upper abdomen region due to influence of cardiac motion (36). The problem can be mitigated by applying cardiac gating and collect SSFSE data during expiration phase when motion is insignificant (36). It is a limit of our study that we have not fully investigated this issue. Further study is needed to optimize the pulse sequence parameters and evaluate the tradeoff between image qualities.
SSFSE alone is insufficient for blood suppression, particularly along through slice direction (34). We combined DIR with SSFSE for blood suppression. Motion-sensitized driven-equilibrium (MSDE) methods (37,38) and delay alternating with nutation for tailored excitation (DANTE) (39) have been reported to provide superior blood suppression in vessel wall imaging than DIR. Compared to both DANTE and MSDE methods, the advantages of DIR include lower sensitivity to motion and less SNR loss. We plan to further investigate these methods for blood suppression in quantitative liver imaging.
We used constant refocusing flip angle in our study. Variable flip angle can be used for reduced blurring, reduced SAR, and higher SNR efficiency. We plan to further investigate the use of variable flip angle in the proposed pulse sequence.
Conclusions
We proposed a pulse sequence for black blood quantitative T1rho imaging of liver based on SSFSE acquisition. We demonstrated that it is feasible to use this pulse sequence to acquire entire T1rho data of a single slice with four TSLs and 500 Hz spinlock frequency at 3.0 T field strength within a single breath-hold of 10 seconds. The black blood effect together with a single breath-hold acquisition mitigates potential quantification errors in liver due to motion in previous methods, and therefore improves the robustness of T1rho imaging of liver.
Acknowledgements
The author WT Chen would like to acknowledge the colleagues from General Electric and Stanford University on development of CubeQuant which precedes this work. We also would like to acknowledge Feng Huang, Chengguang Zhao, and Zhigang Wu from Philips Healthcare for support on pulse sequence development.
Funding: This study was partially supported by grants from the Research Grants Council of the Hong Kong SAR (Project No. 476313 and Project No. SEG CUHK02).
Footnote
Conflicts of Interest: The authors have no conflicts of interest to declare.
References
- Thampanitchawong P, Piratvisuth T. Liver biopsy:complications and risk factors. World J Gastroenterol 1999;5:301-4. [Crossref] [PubMed]
- Friedman SL. Hepatic fibrosis -- overview. Toxicology 2008;254:120-9. [Crossref] [PubMed]
- Wang YX, Yuan J, Chu ES, Go MY, Huang H, Ahuja AT, Sung JJ, Yu J. T1rho MR imaging is sensitive to evaluate liver fibrosis: an experimental study in a rat biliary duct ligation model. Radiology 2011;259:712-9. [Crossref] [PubMed]
- Wang YX, Zhao F, Wong VW, Yuan J, Kwong KM, Chan LY. Liver MR T1rho measurement in liver cirrhosis patients: a preliminary study with a 2D fast field echo sequence at 3T. Proceedings of the 20th Annual Meeting of ISMRM. Melbourne, Australia, 2012:20.
- Allkemper T, Sagmeister F, Cicinnati V, Beckebaum S, Kooijman H, Kanthak C, Stehling C, Heindel W. Evaluation of fibrotic liver disease with whole-liver T1ρ MR imaging: a feasibility study at 1.5 T. Radiology 2014;271:408-15. [Crossref] [PubMed]
- Rauscher I, Eiber M, Ganter C, Martirosian P, Safi W, Umgelter A, Rummeny EJ, Holzapfel K. Evaluation of T1ρ as a potential MR biomarker for liver cirrhosis: comparison of healthy control subjects and patients with liver cirrhosis. Eur J Radiol 2014;83:900-4. [Crossref] [PubMed]
- Singh A, Reddy D, Haris M, Cai K, Rajender Reddy K, Hariharan H, Reddy R. T1ρ MRI of healthy and fibrotic human livers at 1.5 T. J Transl Med 2015;13:292. [Crossref] [PubMed]
- Takayama Y, Nishie A, Asayama Y, Ushijima Y, Okamoto D, Fujita N, Morita K, Shirabe K, Kotoh K, Kubo Y, Okuaki T, Honda H. T1 ρ Relaxation of the liver: A potential biomarker of liver function. J Magn Reson Imaging 2015;42:188-95. [Crossref] [PubMed]
- Wang YX, Yuan J. Evaluation of liver fibrosis with T1ρ MR imaging. Quant Imaging Med Surg 2014;4:152-5. [PubMed]
- Duvvuri U, Charagundla SR, Kudchodkar SB, Kaufman JH, Kneeland JB, Rizi R, Leigh JS, Reddy R. Human knee: in vivo T1(rho)-weighted MR imaging at 1.5 T--preliminary experience. Radiology 2001;220:822-6. [Crossref] [PubMed]
- Borthakur A, Wheaton A, Charagundla SR, Shapiro EM, Regatte RR, Akella SV, Kneeland JB, Reddy R. Three-dimensional T1rho-weighted MRI at 1.5 Tesla. J Magn Reson Imaging 2003;17:730-6. [Crossref] [PubMed]
- Wheaton AJ, Borthakur A, Kneeland JB, Regatte RR, Akella SV, Reddy R. In vivo quantification of T1rho using a multislice spin-lock pulse sequence. Magn Reson Med 2004;52:1453-8. [Crossref] [PubMed]
- Regatte RR, Akella SV, Wheaton AJ, Lech G, Borthakur A, Kneeland JB, Reddy R. 3D-T1rho-relaxation mapping of articular cartilage: in vivo assessment of early degenerative changes in symptomatic osteoarthritic subjects. Acad Radiol 2004;11:741-9. [PubMed]
- Li X, Han ET, Ma CB, Link TM, Newitt DC, Majumdar S. In vivo 3T spiral imaging based multi-slice T(1rho) mapping of knee cartilage in osteoarthritis. Magn Reson Med 2005;54:929-36. [Crossref] [PubMed]
- Li X, Han ET, Busse RF, Majumdar S. In vivo T(1rho) mapping in cartilage using 3D magnetization-prepared angle-modulated partitioned k-space spoiled gradient echo snapshots (3D MAPSS). Magn Reson Med 2008;59:298-307. [Crossref] [PubMed]
- Witschey WR, Borthakur A, Elliott MA, Fenty M, Sochor MA, Wang C, Reddy R. T1rho-prepared balanced gradient echo for rapid 3D T1rho MRI. J Magn Reson Imaging 2008;28:744-54. [Crossref] [PubMed]
- Du J, Carl M, Diaz E, Takahashi A, Han E, Szeverenyi NM, Chung CB, Bydder GM. Ultrashort TE T1rho (UTE T1rho) imaging of the Achilles tendon and meniscus. Magn Reson Med 2010;64:834-42. [Crossref] [PubMed]
- Han ET, Chen W, Shankaranarayanan A. Novel Magnetization-Prepared Multi-Slice Multi-Shot EPI Pulse Sequence for T1rho Quantitation. Proceedings of the 18th Annual Meeting of ISMRM. Stockholm, Sweden, 2010:515.
- Shankaranarayanan A, Saritas EU, Nishimura DG, Chen W, Han ET. In Vivo MR High Resolution T1rho Mapping of the Spine at 3T Using a Reduced-FOV Approach. Proceedings of the 18th Annual Meeting of ISMRM. Stockholm, Sweden, 2010:2465.
- Chen W, Takahashi A, Braun H, Gold G, Han E. 3D Quantitative Imaging of T1rho and T2. Proceedings of the 19th Annual Meeting of ISMRM, Montreal, Canada, 2011:231.
- Zhao F, Wang YX, Yuan J, Deng M, Wong HL, Chu ES, Go MY, Teng GJ, Ahuja AT, Yu J. MR. T1ρ as an imaging biomarker for monitoring liver injury progression and regression: an experimental study in rats with carbon tetrachloride intoxication. Eur Radiol 2012;22:1709-16. [Crossref] [PubMed]
- Deng M, Zhao F, Yuan J, Ahuja AT, Wang YX. Liver T1ρ MRI measurement in healthy human subjects at 3 T: a preliminary study with a two-dimensional fast-field echo sequence. Br J Radiol 2012;85:e590-5. [Crossref] [PubMed]
- Chen W, Chen X, Wang G, Chan Q, Wang H, Li J, Li X, Wang S, Yao B, Xu D. Quantitative 3D Whole Liver T1rho Mapping at 3.0T. Proceedings of the 23rd Annual Meeting of ISMRM. Toronto, Canada, 2015:124.
- Singh A, Haris M, Cai K, Witschey W, Hariharan H, Reddy R. Fluid Suppressed T1ρ Mapping of Human Liver on Clinical Scanners. Proceedings of the 23rd Annual Meeting of ISMRM. Montreal, Canada, 2011:4502.
- Jordan CD, McWalter EJ, Monu UD, Watkins RD, Chen W, Bangerter NK, Hargreaves BA, Gold GE. Variability of CubeQuant T1ρ, quantitative DESS T2, and cones sodium MRI in knee cartilage. Osteoarthritis Cartilage 2014;22:1559-67. [Crossref] [PubMed]
- Edelman RR, Chien D, Kim D. Fast selective black blood MR imaging. Radiology 1991;181:655-60. [Crossref] [PubMed]
- Busse R. Flow sensitivity of CPMG sequences with variable flip refocusing and implications for CSF signal uniformity in 3D-FSE imaging. Proceedings of the 14th Annual Meeting of ISMRM. Seattle, USA, 2006:2430.
- Storey P, Atanasova IP, Lim RP, Xu J, Kim D, Chen Q, Lee VS. Tailoring the flow sensitivity of fast spin-echo sequences for noncontrast peripheral MR angiography. Magn Reson Med 2010;64:1098-108. [Crossref] [PubMed]
- Hennig J. Multiecho imaging sequences with low refocusing flip angles. J Magn Reson 1988;78:397-407.
- Busse RF, Hariharan H, Vu A, Brittain JH. Fast spin echo sequences with very long echo trains: design of variable refocusing flip angle schedules and generation of clinical T2 contrast. Magn Reson Med 2006;55:1030-7. [Crossref] [PubMed]
- Weigel M. Extended phase graphs: dephasing, RF pulses, and echoes - pure and simple. J Magn Reson Imaging 2015;41:266-95. [Crossref] [PubMed]
- Witschey WR 2nd, Borthakur A, Elliott MA, Mellon E, Niyogi S, Wallman DJ, Wang C, Reddy R. Artifacts in T1 rho-weighted imaging: compensation for B(1) and B(0) field imperfections. J Magn Reson 2007;186:75-85. [Crossref] [PubMed]
- Chen W, Koon P, Shankaranarayanan A. 3D Quantitative Imaging of Relaxation Parameters of Whole Brain. Proceedings of the 20th Annual Meeting of ISMRM. Melbourne, Australia, 2012:3419.
- Jara H, Yu BC, Caruthers SD, Melhem ER, Yucel EK. Voxel sensitivity function description of flow-induced signal loss in MR imaging: implications for black-blood MR angiography with turbo spin-echo sequences. Magn Reson Med 1999;41:575-90. [Crossref] [PubMed]
- Park HW, Kim DJ, Cho ZH. Gradient reversal technique and its applications to chemical-shift-related NMR imaging. Magn Reson Med 1987;4:526-36. [Crossref] [PubMed]
- Madhuranthakam AJ, Busse RF, Brittain JH, Rofsky NM, Alsop DC. Sensitivity of low flip angle SSFSE of the abdomen to cardiac motion. Proceedings of the 15th Annual Meeting of ISMRM. Berlin, Germany, 2007:2523.
- Wang J, Yarnykh VL, Hatsukami T, Chu B, Balu N, Yuan C. Improved suppression of plaque-mimicking artifacts in black-blood carotid atherosclerosis imaging using a multislice motion-sensitized driven-equilibrium (MSDE) turbo spin-echo (TSE) sequence. Magn Reson Med 2007;58:973-81. [Crossref] [PubMed]
- Wang J, Yarnykh VL, Yuan C. Enhanced image quality in black-blood MRI using the improved motion-sensitized driven-equilibrium (iMSDE) sequence. J Magn Reson Imaging 2010;31:1256-63. [Crossref] [PubMed]
- Li L, Miller KL, Jezzard P. DANTE-prepared pulse trains: a novel approach to motion-sensitized and motion-suppressed quantitative magnetic resonance imaging. Magn Reson Med 2012;68:1423-38. [Crossref] [PubMed]

